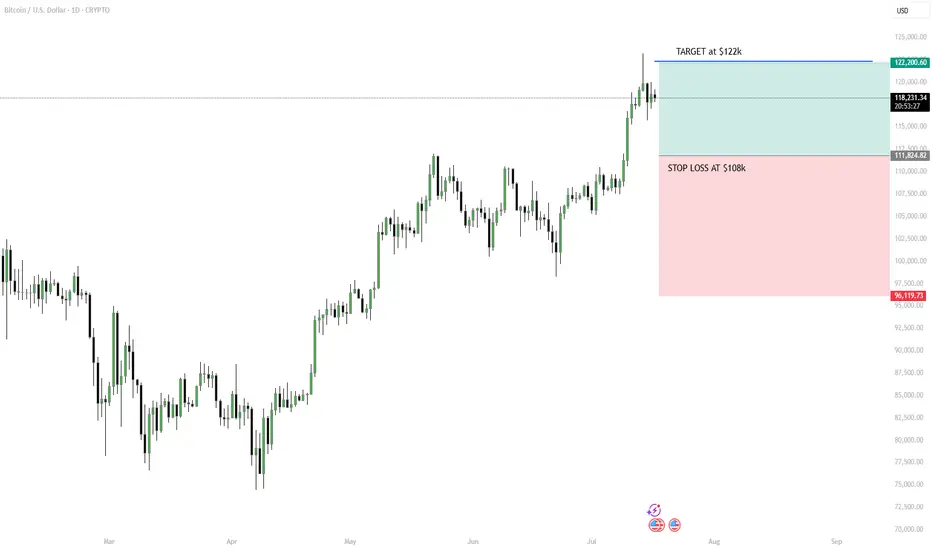
Strategy: “Breakout Bounce” – Buy the Retest, Ride the WaveHello Traders! BTC has broken out above $118K–$120K after a strong uptrend. Now it’s pausing, and a short-term pullback looks likely. Instead of buying the top, we wait for the price to retest previous resistance (around $112K–$114K), which could turn into support.
MY PLAN:
Wait for pullback to $112K–$114K zone.
Look for a bullish candle (daily or 4H) to confirm entry.
Target: $122K short-term or trail stop if trend continues.
Stop loss: Below $108K to manage risk.
Tip: Don’t chase. Be patient, follow the setup, and use proper risk management.
Please leave a comment and don't forget to support a fellow trader! Also, you can leave in the comments your target and plan ideas!
Have a great day y'all!
-Neo
Bitcointrend
BTC/USDT – 4H Chart Technical AnalysisBTC/USDT – 4H Chart Technical Analysis
Market Structure & Trend
Overall Trend : Bearish (clearly defined by a consistent downtrend channel).
Current Structure : Price is in a corrective downtrend within a descending channel, after multiple rejections from the supply zone.
Key Technical Zones
1. Supply Zone
Strong rejection zone where the price previously reversed sharply.
Still acting as resistance, located around the upper range.
2. Demand Zone
Currently being retested for the fifth time, weakening its strength.
Recent price action shows liquidity sweep and swing low break inside this zone, potentially trapping early longs.
Fair Value Gaps (FVG) & Fibonacci Levels
1D FVG sits below the current demand, aligning with:
Golden Pocket (0.618–0.65 Fib).
Acts as a high-probability bounce zone for long entries if demand fails.
A break below this FVG could open up deeper downside toward the 0.786 Fib or beyond.
Psychological Levels
105,000 – Major resistance & potential take-profit area for long positions.
100,000 – Key support and liquidity magnet if the demand zone fails.
Volume Profile
High Volume Node: 102,000 – 106,800 — price tends to gravitate here, indicating potential consolidation or resistance.
Low Volume Area: Below 100,500 — suggests thin liquidity, which may cause sharp moves if price drops into this range.
Scenarios & Trade Ideas
Bullish Scenario
If price holds above the demand zone (after multiple retests) and confirms on LTF:
Potential Long to local resistance.
On breakout, target the 105,000 psychological level.
Confluence: High volume area offers both support and a magnet.
Bearish Scenario
If price fails to hold the demand zone:
Enter short position targeting the 1D FVG and 100,000 psychological level.
If that breaks, expect sharp continuation due to low volume below.
Conclusion
Price is at a pivotal point — currently balancing on weakened demand after multiple retests. Watch for LTF confirmation:
Above demand = bullish recovery setup.
Below demand = bearish continuation toward 100,000 and the FVG.
Manage risk tightly due to the proximity of both key zones.

BITCOIN - under resistance since 2011-Birth of a new cycle soon
The Chart Clearly explains itself
Since before Bitcoin PA went into its current channel, it was under a Huge Arc that resisted any move higher...strongly, Every single ATH, Every one, even the most recent
This is Easily seen by the Blue Arc
And as you can see, maybe THIS is the real reason why PA is struggling to break higher....It just cannot break over that Arc.
The main chart is Monthly, Lets look at the weekly.
You can clearly see what happened in 2021, rejected twice and again this cycle.
And you can see how, by December This year, 2025, PA will be squeezed very tight.
And PA usually moves before the APEX>
And, if we are going to repeat the previous cycle moves, the 1st year after a New ATH usually sees a decline in price, as can be seen by the red boxes.
But PA needs to break OVER that Arc first. and then remain ABOVE IT.
This would then create a new cycle pattern.
And we need it.
Currently, we can go back to Lows of 88K before we loose support on that lower trendline but from there, we need to break over.
A Strong move in SEPTEMBER / OCTOBER would be Ideal
Just saying

XECUSDT Forming Bullish WaveXECUSDT is displaying a strong bullish wave pattern, suggesting a potential continuation of its current uptrend. The structure reflects a healthy impulse wave formation, often indicative of early stages in a major bullish cycle. Price action has consistently respected key support zones while printing higher highs and higher lows—a classic sign of market strength. With volume backing this movement, investor sentiment appears increasingly positive as XEC begins gaining traction among altcoin watchers.
Technically, the asset has broken out from its consolidation phase and now targets the next resistance zones that could unlock a 50% to 60% price increase. This wave pattern is particularly compelling for swing traders and position traders, as the setup offers clear entry points and a strong risk-to-reward ratio. Volume surges during bullish candles confirm the accumulation phase is over, and momentum is building for a sustained leg up.
Fundamentally, XEC (eCash) continues to strengthen its ecosystem, focusing on fast, low-fee payments that appeal to real-world adoption. Its consistent development updates and community support are bringing more visibility to the project. As blockchain adoption grows globally, eCash's utility as a digital currency is becoming more relevant—attracting both retail and institutional interest.
This is a critical moment for XECUSDT, and traders watching this bullish wave structure could be early in capturing significant upside potential. If momentum continues and broader crypto sentiment remains favorable, the 50% to 60% target range appears well within reach in the near term.
✅ Show your support by hitting the like button and
✅ Leaving a comment below! (What is You opinion about this Coin)
Your feedback and engagement keep me inspired to share more insightful market analysis with you!

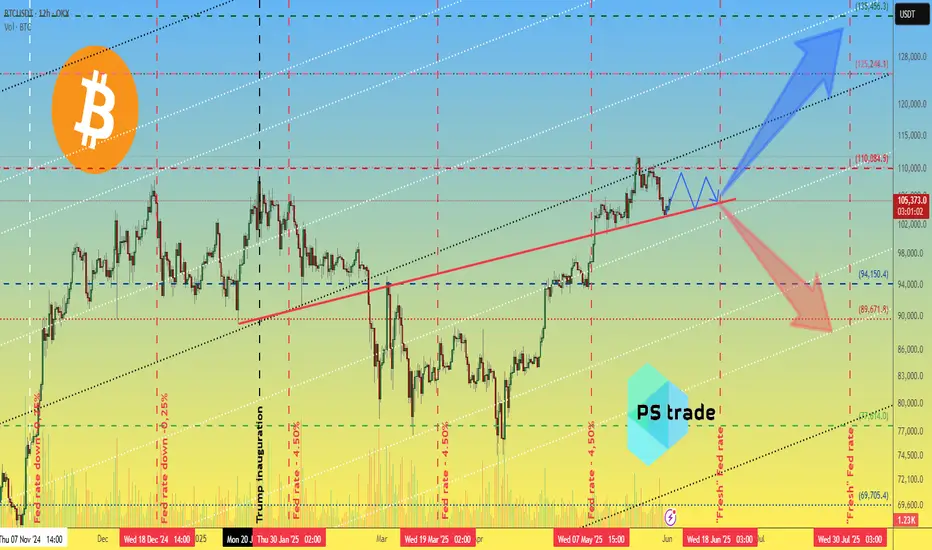
Bitcoin BTC price analysis🍿 At the OKX:BTCUSDT chart, we show one of the scenarios that could play out in the first half of June.
Much will be decided today with the opening of the US market. It is very likely that there will be a downward movement at the opening in response to the new tariffs announced by Trump on Friday after the markets closed.
🕯 Well, then we'll have to “keep our fingers crossed” that market players show their strength and hold on and buy back the drop — like say: we're tired of shaking with every crazy statement from Trump.
💰 If the price of CRYPTOCAP:BTC stays above $103k, there is a chance that it will be “stuck” in the $103-110k consolidation. The market needs to digest and redistribute the results of two months of #BTCUSD price growth from $75k to $112k.
And considering the position of the BTC.D and USDT.D indices, there is a chance that the “little bit” of capital will pass to the altcoins, and they will shoot up a little.
⁉️ Probably, the safest thing to do would be to watch the altcoins and buy only those that have started a significant upward movement with volume.
What do you think?
Bitcoin weekly / Daily showing a Dip to sub 100K possibleBitcoin weekly / Daily showing a Dip to sub 100K possible but is avoidable.
On the weekly, we can see how PA is top of Range, just below the arc that has rejected everything since 2011.
There is more resistance overhead than support below and the first Real line of support sits around 103,599 , 101K then we go to 98K.
If we loose 98K for some strange reason, it is a png drop to around 88K - I doubt we will see that just yet.
However, as you can see on the weekly chart, that is the area of a STRONG line of support that has been used this cycle 4 times to propel PA higher.
The Indicators are Bull Bear Power, showing the momentum of the Trend. We have just begun a Red Bear Candle..gut this is currently sitting on a line of resistance....
The RSI is above its average and has just been rejected off the high, so the likelihood os that this will retreat lower in time or with a sharp drop.
The ADX shows trend strength NOT DIRECTION. This has just turned and has begun rising and with BTC PA falling, it suggests the beginning of a Bear trend - MAYBE
Looking at the Daily
We can see once again, PA got pushed away from the Arc of Resistance ( blue) and has begun falling.
The Bull Bear power chart shows ua how the Bears maybe meeting resistance right now and we may see a drop in bear power in the near future.
RSI has fallen below its average now and now has bumped into the Neutral line that does offer support, as we saw recently and in early 2025
Again, the ADX is Low and turning up , indicating a new trend maybe forming but we have to wait to see what this maybe
To conclude, we need to wait to get a clearer picture right now but it seems almost certain that a new trend is forming.
On the shorter term we have the chance of a bounce back / Range horizontal at current price range but the longer term looks a little more bearish for now
We are half way through June and as suggested in my posts about monthly colour candle close, It seems that a Red June candle would be a Good thing but it needs t be a not to deep candle.
So 2 more weeks of scary PA would be OK but nerve raking.
We shall have to watch close here....

Just a quick word of WARNING for BITCOIN- Local resistanceEasy to see and understand line od resistance here.
This is trhe line of rejection from 2017 and could well pose a problem in the short term
Technically, PA has the ability to break through this line but we need to see if it does.
BITCOIN is at a crossroads and this is just one of about 3 things that stand in ts way.
As mentioned earlier today, we have crossed one major hurdle today, this is the next one.
Hold on tight Guys and Gals, things could get very interesting but, for now, my preferred move for BTC is to range across for a little longer and come back to this next month
Unless the next 8 days are a strong push above this line and then try and stay above it

BITCOIN Seems to have Broken the LONG Term resistance- BIG DAY
The chart really does say it all
You can see the Arc, above PA that has rejected PA Every ATH since 2013
It created the point of rejection on 6 ATH in Total and presented a huge problem if it was not broken. And I can assure you, that arc touches Every ATH.
Just recently, this same line rejected PA Twice, with strength.
The Zoomed chart below shows you where we are now
This image shows you the two 2021 ATH points. and the last two touches { which I find remarkably close to the 2021 double ATH but in miniature }
And, as you can see, we have a candle ABOVE this Arc of resistance. and the Big question is now, WILL WE STAY ABOVE
And what is also notable is how this has happened perfectly at the end of the FIB TIME SCALE used.
This line will have to be tested as support one day and when that day comes, we really REALLY need to remain above.
And once we do that..we really will be in price discovery, in a way that we have never been before.
I am looking at some charts that may offer projected lines of resistance but I am waiting to see what happens here first before publishing them
ENJOY THE RIDE

BTC Double Top Patterns As we see BINANCE:BTCUSD made a new high that can be a double top formation on chart.
Also when we see the RSI chart it is seeing resistance above 60 and keep falling below 60.
So Looks like a bearish trend and if BINANCE:BTCUSD breaks its 3 months support around 91700 then we can see BINANCE:BTCUSD around 76000.
Lets see!
This post is just my perception and for study purpose only.
As crypto market has high risk of loosing money. Please invest your hard earned money carefully.
I will not be responsible for any loss in the crypto market.

BITCOIN 3 x Double Top, Dip, Range, Bounce since Jan 2023
The Chart says it all really.
The 3 times PA has gone sideways, it can be seen as a Double Top, Dip and Range.
The Accumulation / Distributions was similar on Both previous occasions ( 2023, 2024 ) and, so far, are also very similar on this occasion in 2025.
But there are some major differences.......
IF these were to be seem as forms of WYCKOFF Ranges, then the longer the Range period, the stronger the move higher after and I find it very clear, that the move higher after the 2023 range was a lot higher than the move higher after the 2024 Range
2023 Range was approx 189 days ( marked on a Weekly chart so up to 7 days inaccuracy )
2024 Range was approx 168 days.
Currently, we are on 147 days. ( I mark this as a significant date as there was a 20 day difference between 2023 ane 2024 and the 147 is 20 days short of the 2024)
However, this is slightly different this time as we Dropped out of original Range box and have Just pushed back higher into original range Box, so, even though we have had a good few weeks, we are still in Range, the Original Range Box
On the original Chart, the dotted line just below PA is the approx line of the 50 Week SMA and we bounced off that Twice in 2024 to push higher and we just bounced off that again to return to original range box.
But as you can see, that was only a Wick down. It may not have been a Full on bounce to take us out of the upper range box and I see Momentum slowing for a while now
This also happened on previous occasions but on a smaller scale.
This can be seen better on the Daily chart, that includes the SMA's
SMA's 50 Red, 100 Blue, 128 Green & 200 Yellow
The first thing to note is how the 200 is about to cross the 100
This is NOT a thing to panic about as the recent push higher will not be reflected in these Averages for a while but it does show the Depth of the Dip we just came out of.
What IS important is how PA is ABOVE the Averages..
But the Candle size are small and we are cooling off on a Daily MACD
We are NOT overbought on this MACD yet and so we could see a turn higher but Longer term, so long as we remain in the upper Range Box, it would be good if this cooled off to Neutral again
For me, I am hoping for a GREEN MAY candle Close and that could very well happen but the candle may not be Large, which leaves PA still in this Range by month end, but maybe in the upper edges of it....around 110K
This would then allow for the possible Small RED June, that would take PA back to lower range. as we saw in 2020 - .THEN we have a nice cooled PA
OR we could just go for it NOW and see what happens as we did in 2017
it is impossible to predict this but we can be ready ..
BUY BOTCOIN - HOLD BITCOIN

Bitcoin Month end approachs and THIS is where we are- Cross Road
As we end April, we can see a similar size candle to the one we saw in April 2017 and, if we are still following the 2013 - 2017 Fractal ( even if a little loosely now) then we can expect the next Few months to lead to the Next ATH.
However, as explained in the previous post about the Long Term Resistance Arc and how we may be in the Closing stages of the First Bitcoin Cycle, the over head resistance is STRONG ( dashed Arc )
These 2 lines of resistance at around 109K usd form an intersection and this is with little doubt the point to try and break through. Historically, BTC PA has tried to aim towards intersections of Trendlines when they have strength
So, This is what I am expecting for MAY but I will explain this in more detail in the montlly Candle Colour post in a couple fo days
What to expect
The April candle Will close GREEN and we now need a Green MAY candle and this MAY candle needs to break over the dotted Threshold line, as it did in May 2017
And we have to wait and see if that happens

What if I show you Bitcoin is at end of 1st cycle only ?
The Chart above involves TWO things we may need to pay attention to.
There is so much involved in this and I could go on for hours because, for me, this opens the door to so many things for Bitcoin.
And I am now looking at this past 14 years as the "Beginnings".
And we need to wait and see Where we go next before we label that
So..
What do we have here.
The ARC of Resistance. - I have talked about this before. Simply put, PA on every ATH since 2011 has been rejected by the same line / Arc - This needs no more than the Arc on a chart to see...
It is as simple as that.
Beneath this, we have that Dashed line of Support that has Never been Broken. Created off a High in 2011, it got retested as support in 2015 and not again until 2023.
Between these two points, you will notice how that Arc of resistance was at its furthest points from the line of support below.
It is like the Beginning and End of a sequence.......
The next thing we have is a Very interesting thing called the Trend-Based FIB Time.
It is important to understand what this is, So ;-
Trend-Based Fib Time is a technical analysis tool that uses the Fibonacci sequence to predict probable price corrections within an existing trend. It is represented by vertical lines at specific time intervals that show potential areas where a swing high, low, or reversal could occur. These intervals are based on the Fibonacci sequence and are not concerned with price levels but rather with time. The tool helps traders identify how far a wave is likely to travel in the trend.
Note what is in Bold there.
And then look at the chart..It clearly shows us, where PA touched that line of support twice, the Cycle / Wave. The RED zones. And between these was the Trend. The over all Gain in price, over Time.
We have 3 Waves in total. The 3 ATH to ATH from 2017 to now
To further support this idea, see how PA did not come down to the Line of support between the 2017 - > 2021 ATH's
That was MID CYCLE - Strength
And so now, while we all wait for the next push up, I want to show you a zoomed, Daily version of this chart
The Current ATH we have was absolutely on the day of the END of this Fib Time cycle.
I promise you I did not "Adjust this to suit." That was the genuine result.
And I was Stunned.
And more than that, This image also very clearly shows us that Time and Room is running out for PA.
It faces the strongest lines of Support and resistance it has ever faced and these lines reach an apex in Dec.....
PA ALWAYS REACTS BEFORE THE APEX
So, What is Next ?
The chances of Bitcoin crashing to the Floor are highly unlikely unless all the corporations that have been buying BTC, decide to sell them all at the same time.
This IS a possibility ONLY if they are working with the TradFi banking organisations, that tried to Crash BTC in 2022 / 2023
OK OK, that involves ridiculous amounts of Losses for many ..so..NO
BUT PA IS GETTING SQUEEZED
And so we wait....and Wait till we see Bitcoin PA break out, Enter a Brand New Trend..a Long Term Cycle.....and we may call it Adulthood.....
Or, we will have a Story to tell our Grandchildren about a Dream of breaking Free of Banking that Came Oh so Close
I cannot wait to see what happens Next - and I am HODL

The Big drop is coming This is just my idea I'm hoping Bitcoin will fall to 72000 if it does I'm thinking it going to keep dropping to 70000. This would be great if your in a sell now might take a day or 2 to get there but I'll wait if the monoooy is right lol. COINBASE:BTCUSD

BITCOIN HAS TO BREAK LONG TERM TREND by DEC - SQUEEZE APEX DECI have posted this before and I post it again now, just months away from a CRUCIAL point for Bitcoin PA
As with any time scale trading chart, An Apex is a point of reaction. PA usualy reacts BEFORE the Apex is met.
This Giant Apex is in DEC 2025
Every single ATH in the life span of Bitcoin has been rejected by the Arc of Resistance that is overhead.
We can also see how from the ATH in 2011, a trend line was formed that has acted as Support ever since 2012. PA has never dropped below this line.
So, as you can see, PA has been in a diminishing "Sandwich" and Now, we are coming to the Crunch
We can see how the ATH's have been a reducing % Rise ever since this point also.
And you will notice how this number on the chart reduces each time, even though the real value is increasing.
Low to ATH A ( ATH 2011) - 3,465,178%
Low to ATH B ( ATH 2013) - 49,670 %
Low to ATH C ( ATH 2017) - 9,865 %
Low to ATH D ( ATH 2021) - 2,148 %
E is not over yet but coing on current ATH we have
Low to ATH E ( ATH 2025) - 575 %
So, you see the reduction of % rise, held back all along by the ARC Of RESISTANCE
What is interesting, is that since PA has been in the chanel formed in 2011, when comapred to each other, we have been seeing a rise of 20% of the previous rise ( on average )
This closer chart shows you this in more detail
I will ignoew the A - B as thia is out of channel
C-B = 19.6 %
D-C = 21.77 %
Currently E-D = 26.7 %
As you can see, we are currently OVER that average % Rise.
And we are also heading into a tight APEX in Dec.
The expected 200K ATH this cycle will take us out of the pattern, out of the Apex and out of the 20 % average rise of previousl
This really is CRUNCH TIME for Bitcoin
The REALLY interesting thing is, What would be Next ?
This would break the Cycle routine.
We may already have broken that as described in previous charts of mine from years ago
But what IS Certain is that something HAS to happen.
This Cycle ATH will reveal a HUGE amount but we have yto Wait and see what will happen

BITCOIN TRENDS with Heiken Ashi candles & Trend indicator ADX Why HEIKEN ASHI Candles ?
Heikin Ashi is a charting technique that can be used to predict future price movements. It is similar to traditional candlestick charts. However, unlike a regular candlestick chart, the Heikin Ashi chart tries to filter out some of the market noise by smoothing out strong price swings to better identify trend movements in the market. ( Source TradingView )
What is ADX ?
The ADX indicator measures trend strength without indicating direction. It is derived from the Positive Directional Movement (+DI) and Negative Directional Movement (-DI):
+DI (Positive Directional Index): Measures upward price movement.
-DI (Negative Directional Index): Measures downward price movement.
ADX Value: Higher values indicate stronger trends, regardless of direction.
( Source TradingView)
To summarise, Heiken Ashi candles filter out Noise and help identify Trend Direction
ADX shows you Trend Strength - NEVER the direction of Trend, using prince index.
OK, so now we ready. The main chart has 2 Vertical Bold lines that will be explained in a Bit but Note where they are on the Chart
The one on the left is near where the Rise in PA turns and becomes a Ranging PA- PA slowed right on that line.
The 2nd line is near the TOP and before the point where PA entered a descending channel that leads us to where we are currently
Note on the chart, the Orange dotted line. This is the BASIS line of the Bollinger bands. This is The Basis line and shows us the Average of PA and, as you can see, we are currently below Average. This shows a Negative Trend.
See how PA is above the basis line in a Positive Trend
Also note in the chart how the lines of candles are Smoother. Each New candle begins on the centre line of the previous and so it becomes a Lot easier to see if PA rises or drops from previous with out the Jagged Noise of traditional candles. - Taller candles show more Strength than previous;
So now to the ADX Chart
See those 2 Dashed Vertical lines and note how the ADX ( YELLOW ) changes direction at those points.
To remind you, the Left one was where BTC PA Slowed down from a Steep Rise, A BULLISH TREND, and turned to Ranging.
The Drop in the ADX at this point showed us that the previous trend was weakening. I remind you, it DOES NOT SHOW TREND DIRECTION even though, in this case, they follow each other.
PA Ranged horizontal on average till we met the Next line, where the previous Trend Strength had reached Neutral ( Note, this is around 20 on the ADX scale )
At the next dashed lime. ADX began rising. Trend strength was increasing.
Initially, we saw BTC PA rising to a New ATH and so, it was easy to assume that the Trend Was Bullish again. However, as we see now, it turns out it was a BEARISH trend.
So how do we know when this is going to end ?
The ORANGE line DI+ ( positive price action ) and the RED DI - ( Negative price action ) can help
These are Price Direction index. When DI + rises, this indicates a positive price action and Visa Versa for DI -
On its own, this is not easy But, for instance, notice how while we been in the descending channel, the DI+ dropped while the DI- has ranged along the 20 line on average.
This indicates a controlled Drop in PA and NOT a Full on Bearish capitulation. There is strength there in PA and this can be seen by the Slow rise of the ADX
On a shorter time scales, over the last 5 days we have seen PA rise in price.
this is reflected more in the DI- dropping ( Negative price action loosing strength ) more than in the DI + remainf horizontal.( NOT gaining Strength )
This could indicate that we are not finished Dropping yet - and yet, at the same time, we see the ADX weakening.
The Bears maybe getting Tired.
If we now return to the Chart
This fatigue we maybe seeing in the Bears could be reflected in the simple fact that we are now Near a long term Rising line of Support ( bold line) and that we are nearer the lower line of the descending channel ( also support) - We are also very near the 2.272 fib extension that has proved to be support previously.
The upper bollinger band is around 90K, which happens to be near Top of current range.
So, we may see a push higher soon but we need to understand that the Longer term still Looks like we will continue in the Range Bound for a Few more weeks.
I hope this helps but be prepared for anything

BITCOIN $BTCUSD | BTC BEARISH TREND & STRATEGIC BITCOIN RESERVEBITCOIN BITSTAMP:BTCUSD | BTC BEARISH TREND & STRATEGIC BITCOIN RESERVE Mar09'25
Sparros Exchange Trend Table:
BITSTAMP:BTCUSD Weekly: Bullish
BITSTAMP:BTCUSD Daily: Bearish
BITSTAMP:BTCUSD 4H: Bearish
BITSTAMP:BTCUSD 1H: Bearish
Bitcoin Zones:
Bitcoin BUY/LONG ZONE (GREEN): $90,500 - $106,000
Bitcoin DO NOT TRADE/DNT ZONE (WHITE): $84,000 - $90,500
Bitcoin SELL/SHORT ZONE (RED): $69,000 - $84,000
Bitcoin is currently trading at $86,000, reflecting a bearish trend after reaching its all-time high nearly two months ago. The cryptocurrency has experienced substantial volatility, with the price having previously consolidated in higher ranges.
As of recent developments, the U.S. government has announced a "Strategic Bitcoin Reserve," indicating the government’s growing commitment to digital assets. This move is seen as part of a broader strategy to strengthen the U.S.'s position as a leader in the global digital currency space, though no specific amount of Bitcoin has been disclosed for this reserve.
This is what I would personally look at before entering trades, everything is subject to change on a daily basis and as I analyze different timeframes and ideas.
ENTERTAINMENT PURPOSES ONLY, NOT FINANCIAL ADVICE!
trendanalysis, trendtrading, priceaction, priceactiontrading, technical indicators, support and resistance, bitcoin, bitcoin price, bitcoin halving, btcusd, btc,
BTC, BITSTAMP:BTCUSD , bitcointrades, bitcoinlong, btcusdlong, bitcoinshort, btcusdshort, bitcoinanalysis, bitcointrend, bitcoinrange, bitcointriangle, triangle, ascendingtriangle, chartpatterns, trianglechart, ascendingtrianglebreakout, chartpatternbitcoin, bitcointriangle, bitcoinhalvingschedule, bitcoinbreakout, bitcoinrange, bitcoinrangebreakout, triangularpattern, flag, bitcoinpatterns, bitcoinchartpatterns, btcpatterns, btctriangletrade, btctrianble, btctrend, btctrades, btclong, btcshort, btcrange, btcbreakout, btcbreakdown, bitcoinover100000, bitcoin100, bitcoinover100, onehundredthousand, bitcoinascendingtrianglepattern, bitcoinpullbacks, bitcoindrop, bitcoinpricerally

Important Bitcoin levels. The game of expectations.Today, it is important for Bitcoin to close below 88,000. There is a high probability that today the price will drop to the 0.5 Fibonacci level, thereby partially closing the gap on the daily chart, and the RSI will consolidate below 30 even with a closing price below 88,000. All these factors combined will be sufficient to trigger strong accumulation with a breakdown of the structure, leading to a new all-time high within the next 2-3 weeks.
However, the market doesn’t always play out perfectly. There remains a possibility of a prolonged scenario. In this case, from the current price block (88k - 86k), the price may form a local bounce with a full ABC cycle in the coming days and test the key resistance level (106,200). After that, the price will likely return to the 0.5 Fibonacci level and possibly retest this important level.
A similar scenario occurred last year during a similar phase of prolonged correction, where the price eventually reached the 0.5 Fibonacci level, though not immediately.

Daily Market Review and Analysis for BTC: January 2, 2025#BTC (1h)
The cryptocurrency market capitalization rose by 2.74% over the last 24 hours, BTC dominance fell by 0.6%.
#Bitcoin continues its local uptrend, which is especially clearly visible on lower timeframes (up to 15 minutes). In particular, the price of the first cryptocurrency continues to periodically rebound from trend liquidity, which indicates that the liquidity pool will soon reach the level of $97,544 and then roll back to the area of $96,200.
This scenario will be relevant if the price consolidates with the body of the hourly candle below $95,924. But as mentioned above, now the most realistic scenario is to take the liquidity price at $97,544.
As for the global scenario, BTC is in a bullish cycle and the primary target in the medium term is the buyers' liquidity level (BSL) at $99,963, where the price is likely to fall for the sellers' liquidity (SSL) withdrawals at $90,500 and $88,722.

Terrifying BTC Macro Resistance TrendlineThis is not to say that I am predicting BTC to crash from here, it could always break this trend and pump into another galaxy. But looking at this perfect trendline, it is hard not to stop and think for a second.
If at this time last year when BTC was around $38,000, what would your thoughts have been on a $100k bull run target?
That being said, the logarithmic trend looks much more promising.

BTC 6 MONTH OUTLOOK- PRE BULL MARKETThis is a composite of quite a few systems, but the screen here has been reduced for ease of reading. The economic sentiment right now is not favorable so a pullback of BTC is very likely. This is not signaling a weakness in crypto, but just the overall uncertainty in investors in ANY market. Look for the BTC pullback end of March early April. Securities and Banking are seeing difficult times. The safest market may be Crypto (ie Bitcoin). It doesn't mean Bitcoin won't have it struggles (It will), but its promise is to safeguard those who hold it from the ever present uncertainty of the BANKING sector which is a whole different topic.
On this chart you will find secondary support/resistance lines here (dashed blue lines). Hard resistance and supports (sold blue lines). The yellow line is a projection that I am seeing for BTC over the next 6-8 months. I do think once we exist the Gann Box that we will be in a full blown BTC Bull market. For now some intermediate tops and bottoms will be seen. Not in a bull market yet, but soon so stack up! I am! Buy Low- Sell High
Any questions/ comments leave them below.
I warrant that the information created and published, doesn't constitute investment advice, and isn't created solely for qualified investors.

Trend Direction and Trading Indicator TutorialThe Tenoris Trend Indicator determines support and resistance using a proprietary method that I've not seen in other indicators.
Over the last 10 days a potential gain of 15% on Bitcoin is shown on the chart.
The key is knowing which Red and Green arrows are most likely to indicate the reversal of the price trend from short to long or long to short (red to green or green to red arrows and boxes).
The arrows are used for trade entries and exits and the boxes in relationship to the price of a closed candle are used to predict price direction.
The time frame of the chart is critical for maximizing the accuracy of the indicator.
In general a 7D candle on crypto and a 30 day candle on stocks and a quarterly candle on indexes like the S&P provides the most accurate trend direction.
On Bitcoin a 4H candle chart can be successfully used to determine entires for short term trades lasting a few days. In extensive back testing and live trading a gain of 10% a month or more is consistently possible.
The key to using the indicator is knowing which arrows are the most indicative of a trend change. When a green candle closes above the red boxes it's likely that price is going to go from trending down to up. When a red candle closes below a green box it's likely that price will trend down.
Compared to moving averages, and other directional trend indicators the Tenoris Trend Indicator is superior in detecting trend changes much earlier than other methods of technical analysis commonly used.

BTC Weekly Chart is Showing Major StrengthThe last weekly close and open for BTC have broken the overall weekly structure of consolidation. A weekly close above the support would confirm this. Things are looking good for BTC in the bigger picture. Hold on to your hats, we have a year of volatility coming to us.
Not financial advice.
Do your own DD.
Thanks for looking at the idea.

BTC: Two Likely Scenarios I'm WatchingBitcoin hasn't yet been able to break out above the diagonal resistance that formed after the most recent high.
Until we're able to do a bump-and-run ABOVE this trendline, lower lows seem the most likely until we've found a zone with sufficient buying pressure to take us back upwards. Lower lows and lower highs mean short term bearish, unfortunately.
I discuss the reasoning for these two scenarios in a little more detail, here:
However, this doesn't imply that there won't be decent range trades / swing trades in this area - in fact, there's been incredible opportunities whilst Bitcoin chops around. Follow here to make sure you never miss a moment!
___________________
BINANCE:BTCUSDT
