Bull and Bear W FractalsThis is not comprehensive, but it's something I have noticed for a while. There is a general W shape, and depending on which side of the W base is lower, it seems to indicate an overall trend moving forward.
Bitcointrend

Bitcoin Timeline ChartedKey events from Bitcoin's history, most of which likely had a significant impact on it's value.

Bitcoin Timeline ChartedKey events in Bitcoin's history, most of which likely had a significant impact on Bitcoin's value over time.

Forever Short BitcoinSure, you may be able to get some small gains upwards, but that next Fibo level will be impossible to break through. Keep in mind, most the analysis you'll see uses extremely short-term charts at the hourly level. I'm still amazed there are still people throwing their money away on this particular crypto while the options for gains are so much better with returns on a percentage level much higher in Litecoin or EOS for example. Just look at the moving averages, RSI, and Stochastic. All are near flashing overbought and that's with this incremental trend up. In brief, I'll short Bitcoin my entire life and feel no guilt on any money I lose in the short-term.

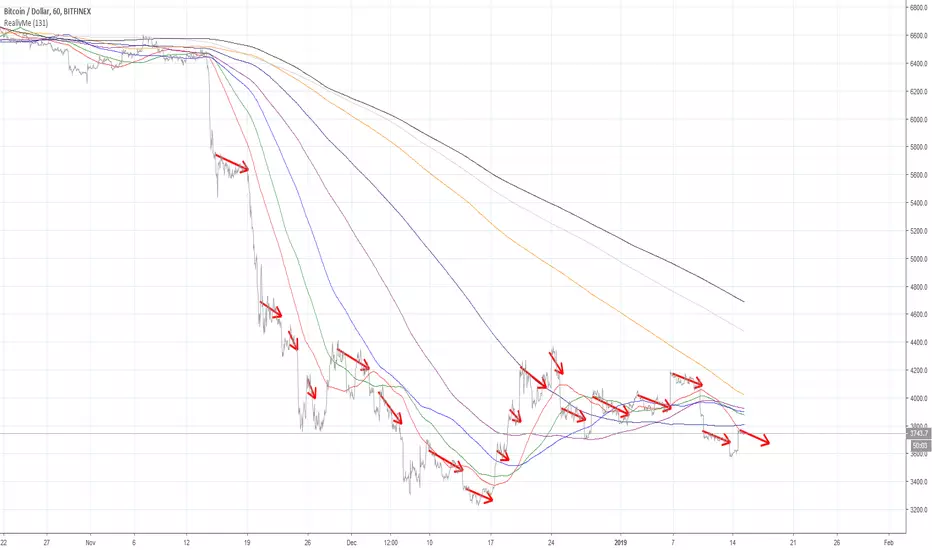
Bitcoin could drop another 34% here's why..Hellow tradingview,
- After almost 1 whole year of trading inside a descending triangle we finally broke out to the downside and hit the 3000$ target with near perfection.
- Now we can see on the chart above Bitcoin could potential form a new descending triangle.
- After a weak correction to the upper side we topped out at 4245$, we formed a bullish pattern and broke out of it. But selling pressure was so high wich resulted in a big drop once again. At this time i am looking for a double bottom around 3150$ more or less.
- I want to point out that the pattern is still not active YET, if we touch the lower trend-line again which is very likely, the pattern becomes active.
- Quick measurement shows us that a target of 2000$ is very possible for Bitcoin
- Pattern becomes invalid if we break above the upper trendline or break below it.
Safe trading!

BTC: Elusive "Bottom". Not even sideways yetThis is just a quick idea to share about Bitcoin.
See these telltale arrows?
They tell you the true story of where we are.
Still not impress by $BTC…I charted these lines on 9/6/2018, and Bitcoin is following my analysis to a T where it is ranging in this triangle. Ideally I want to see it break out past $7400 with conviction before I start to believe in a long term bull run. Until then, this very well could be a lower high and we could see Bitcoin break the triangle bearish.
How I plan to trade BTCUSD:
Stack buys around $4800-$5200
Buy on breakout if price breaks above $7400. If BTC breaks $7400 I expect a nice run all the way up to $8500.
About me:
I am a professional trader with over thirteen years of trading experience. I am fortunate enough to have had the opportunity to retire at age thirty, and I now trade for pure amusement. I love the crypto community, and would like to further flourish within it by helping any newcomers learn to trade and invest. If you found this chart helpful, please give it a like and follow me on Twitter.
Thank you,
Mike, the OMEGA Trader

BTC - Interesting Bear and Bull Fight Hey all,
I had tried to explain everything on the chart via the contents and drawings but if you still have any question then ask it on comment box.

Bitcoin The Bigger Picture Oversold Bears Running Out Of Steam Hi all just a quick update i believe we hit the bottom of the support yesterday and could be
looking at a bounce from this level..I've thrown this chart together quickly so we can keep
any eye on the bigger picture, we are still trending in this triangle on the 4hr chart it
looks alot cleaner.Im really busy at the moment programming but i will try and keep
the charts up to date i will also check the EMA 10/21/50 in a post below good luck, I stll
stick to what i have always said we will pick up from now and over the weekend.
I see us going bullish again short term / medium term bullish / long term Vbullish
people are still holding on for the $6k pull back which i find very unlikely and
the time of year we are in, people are still taking their profits and looking for a
place to re buy back in i believe, people are saying where are the buyers some have
been ladder buying on the way back down..
This is my belief we will be bullish over the weekend i would like to see a new re test
for the 9k - 10k region even if we hit $9200 it would break us out of this trending pattern
above..
Time will tell good luck all if you want to help sponsor me my btc and eth address are
below.Also check the news the shills are back out and trying their best to convince
people like last time bitcoin is done for they are absolute full of B$..And i truely
believe people are going to wait until its too late to even buy back in some people
think its going to $5k i doubt that very much..My bearish price was $7600 and $7200
rock bottom this is my own price you should have your own TA that supports where
you are buying in and selling..
Good luck to the bears bulls and the whales the whales are still there looking to get
as much btc as cheap as they can i belive and this is where i think most will miss
the opportunity, it will eventually go bullish and the price will go up so fast it will
leave some big key players out of the market.
====================================
BTC
1LuVYASn75HZeLeKksExKTNwZpF59zXWk7
======================================
ETH
0x6C4aa3B856D167977d39b4AB49aC66D967Edd9F2
EMA CHART BELOW

Bitcoin Btcusd Double Bottom Or Just Support/Resistance $8100Good afternoon everyone hope you are all well and enjoying the weather ok lets get to it I noticed we have a lot of support & resistance at the $8000 - $8100 level as we posted this a few days ago im not sure if we can call this a double bottom but time will tell i need to check other trends and indicators to confirm if we are in fact going to bounce from this we are out of the trending channel a while ago the ema look like crap to be honest, once that cross over happens it was obviously going to go bearish, im just throwing this idea out there i did expect a pullback to $7600 but we went bullish again there was a lot of sideways movement yesterday and low volume towards the end of the day let's see what today brings, i have many charts with many different trend but there not up for sharing i do not want to create fear or even create false hopes.
But we need did warn people yesterday to keep a close eye once we fell out of the trending channel and was confirmed not to be a bear trap it was game over (short term)..You will notice this area is filled with support / resistance looking from past history we put a chart up yesterday showing this area, time will tell the EMA 10, 21 ,50 look like they have crossed on almost all of the time frames although i cant check fully not having pro..But take notice of past times we have bounced from this region it could be ALGORITHMS automatically buying at this price who knows..The amount of shilling and manipulation is only getting
worse not better.
Will update tonight once i have double checked the charts over again. And yes the SHILLS are now posting this past 20 mins all over
youtube Twitter and on here same old crap...And no not every one who disagrees with me or other people are shills they come out
at specific times to install fear.

Accumulation, Supports, and Playing the RangeIt's going to take a few days to reset the indicators on higher time frames and playing this range could be very profitable if your buying the dips and selling the peaks, I've outlined a few of the key areas to look for the breakout depending on exactly how bullish or bearish this correction may be.
Look to buy in the 8600s and sell in short of 9k. If we were to brake the resistence here, then it would be super bullish, so I expect we will fall again.
Look to buy in the 8500s and sell in short of 8900. Although it's possible we break up here, I'm more likely to believe that we correct at least one more time.
Look to buy in the 8400s and sell in short of 8800. This seems like the less bullish but still not bearish place to break and I'll still play this area safe. Although rebuying on a breakout seems smart.
Look to buy in the 8300s and sell in short of 8700. After a few days of resetting indicators I assume the odds of breaking out here are quite a bit better and would be more likely to hold my position but I would sell into weakness knowing we could very well test our recently turned downtrend line to make sure it's support, we have not been testing the lows TA wise so in all honesty it may not happen. Be ready for it though.
If we do fail to break out into new highs, we will test the downtrend line which sits slightly above the 8200 area over a few days of this range and at that point would reset a majority of the indicators which should be a great area to bounce from. This is the most bearish scenario I can see currently and since theoretically we shouldn't feel bearish, I wouldn't hold out too long for this.
At any point in time things could go bad. A long squeeze would put us back into a bearish scenario and more than likely for the entire year. It's possible so make sure to set your stop losses. None the less, I feel the odds of this are slim. Most of the people whom held out for months, people who've recently invested, and the current trends of the past few weeks suggest to me that we are looking to break the 9k area into 10k area at some point to retest the double top around 11k but I'm not permabullish and can suggest that we will eventually fall from some part of that range for a much larger correction.
At this point I don't see us getting a better buy in than the 8200-8300 before the next breakout. If you play the range, you should be able to accumulate some extra BTC before we do that.
Not a financial advisor,
BCG

The Complete Trend Line History of Bitcoin: 2013-2018Just experimenting plotting trend lines using line charts. Starting from 2013 I will update following up to 2018.
Personally, I like this method because it removes the details that candles provide and gives you a straight-forward way to determine important highs and lows.
Let me know what you guys think.
-Wellwastedyouth
