BTC (Bitcoin) Analysis 20/03/2021it seems bullish to us yet
there are total of 3 Take profits if price doesn't break bellow 41000USD Support
3 TP is confirmed if the 2 TP triggers followed by some price correction and Retracements
Bitcoinusd

NVDIA 4HR- Pull back Very LikelySorry for the small screen, but this is pretty straightforward. Bearish Divergence on MACD (not shown cause screen size) along with price action showing slowed momentum when trying to push through the very local high ie. Double top.
I would try to catch the bounce at the EMA and or anything within the 0.326-0.618 fib retrace area for all you swing traders out there.
Simple, predictable price action.
You shall respect the TA, while the weak fall down the wayside.
-b

BCH/USDT will probably go out of the banner shock!BCH/USDT will probably go out of the banner shock!
🚀📈 Exciting News! 📉🚀
📉 BCH/USDT has recently experienced 5 consecutive days of slight decline, indicating the release of short selling momentum.
But wait, there's more! 📈 The positive trend is pulling up, showing signs of a potential upward surge! 💹
💪 With the closest support around 225.04 (June 29, 2023 opening price), the outlook is promising for potential rebounds! 📊
🚩 Get ready for a flag-shaped oscillation pattern ahead, offering opportunities for both short-term traders and long-term investors! 📈🚩
🌟 Don't miss out on this golden opportunity!
Stay tuned for potential profits as BCH/USDT prepares for exciting price movements!
#BCH #USDT #ForexTrading

Bitcoin in serious juncture.We had Positive XRP news that affected the market positively through the week. The market is ready to accept such. But 32 000 +- needs to be broken.
Right now w/Crypto markets and GOLD we are recoiling. Bitcoin is BULLISH all year long. A breakout will mean a Bull run and will catch momentum !

Ninja Talks EP 31: Bruce Lee TradingEmbracing Bruce Lee's Timeless Insights to Conquer the Markets
"Empty your mind, be formless, shapeless like water. If you put water into a cup, it becomes the cup. If you put water into a bottle, it becomes the bottle. If you put it in a teapot, it becomes the teapot. Water can flow or it can crash. Be water, my friend." - Bruce Lee
Embrace Adaptability: Just as water adapts to any vessel it occupies, be flexible and adaptable in your financial speculation. Markets can change rapidly, and being rigid in your approach can lead to missed opportunities. Adaptability allows you to adjust your strategies according to market conditions and seize profitable opportunities.
Cultivate an Open Mind: Emptying your mind, as Bruce Lee suggests, means letting go of preconceived notions and biases. Approach financial speculation with an open mind, ready to learn and explore new ideas. Embrace different perspectives, strategies, and techniques, as they can broaden your understanding and lead to better decision-making.
Flow with the Market: Water flows effortlessly, finding the path of least resistance. Similarly, in financial speculation, it's crucial to flow with the market rather than fight against it. Pay attention to market trends, follow the momentum, and align your trades with the prevailing direction. This doesn't mean blindly following the crowd, but rather understanding the market's dynamics and adjusting your positions accordingly.
Be Shapeless in Risk Management: Water takes the shape of its container, and in financial speculation, you must be adaptable in managing risks. Tailor your risk management strategies to suit different market conditions. Employ appropriate risk mitigation techniques, such as position sizing, stop-loss orders, and diversification, to protect your capital and navigate uncertain market environments.
Maintain Emotional Balance: Just as water remains calm and tranquil, strive for emotional balance in your financial speculation. Emotions like fear and greed can cloud judgment and lead to impulsive decisions. Practice emotional discipline, keep your emotions in check, and make rational choices based on sound analysis rather than being driven by emotions.
Learn to Flow and Crash: Water can flow gently or crash with great force. Similarly, as a financial speculator, you must learn to navigate different market conditions. During times of stability, adopt a flowing approach, where you follow trends and take advantage of gradual market movements. However, when faced with turbulent times, be prepared to crash, which means having the ability to protect your positions, cut losses quickly, and adapt to changing market dynamics.
Find Your Own Path: In Bruce Lee's quote, he advises, "Be water, my friend." This suggests that you should find your own path in financial speculation. While you can learn from others and study successful strategies, ultimately, you must develop your own approach that aligns with your goals, risk tolerance, and strengths. Being water means discovering your unique style and adapting it to achieve success in the financial markets.
By integrating these seven points derived from Bruce Lee's quote, you can approach financial speculation with a profound mindset, leveraging adaptability, open-mindedness, market flow, effective risk management, emotional balance, versatility, and a personalized approach to carve your path to success.
That’s all for todays episode Ninjas!
Like, comment, follow and I’ll see you in the next episode.
Keep your blades sharp.
Ninja Nick

Bitcoin BTC price is at a crossroads Vote on where price will goThe BTCUSDT price has been consolidating in a narrow range of $30-31 thousand for 21 days.
MM, which keeps the price in this range, has its own goals, which we can only guess at.
We expected that yesterday's announcement of the "fresh" US CPI, which came in better than forecast (3.0%), would push the price of BTC up (SP500 +1% after yesterday's US CPI announcement), but no.
The BTCUSDT price was smoothly falling to the lower boundary of consolidation yesterday.
This only proves once again that in the cryptocurrency market, it is still quite easy for the big money to fulfill their "tasks" and direct the price in the direction they want.
On the chart, we have presented two fractals of Bitcoin price movements that have occurred in the past.
It turns out that the price of BTCUSDT is now at a crossroads and the next few days may be "hot".
Of course, the activation of both the white and blue fractals will occur after the price consolidates above FWB:31K , or below $30k, respectively.
But still, which movement of the BTCUSDT price do you prefer in the coming days? Up or down? Please vote in the comments below the idea
We think that "the mood" of active participants in the crypto market will be interesting for many to see
_____________________
Did you like our analysis? Leave a comment, like, and follow to get more

Trading Life- I don't post much right now because nothing exciting is on.
That said i will give u one more advise :
- When u trade you really need to switch timeframes.
- if you see nothing is interesting on 1 week or 1 Day, go to H12, then go H8, then go H6. etc...
- Now check your favorite indicators and look at some divergences.
- Divergences are the base of trading.
- Divergences tell you when you can "try" to enter a trade or not.
- if the market just follow the river, there's nothing to do, just watch.
- Spot for Divergences than bet on a trade is much better.
- Now check my graphic and get it.
- Really simple.
- Spot on Divergences and understand movements.
- Remember that trading is tricky.
- Naturally the market will always inverse what u think :D
- Sometimes, there's nothing to trade.
Stay Safe !
Happy Tr4Ding !

Bitcoin BTC price confuses everyone, and only 1 side winsFor more than 2 weeks, MM has been skillfully moving the BTCUSDT price in the range of $30-31k and "removing" the stops of both longs and shorts below and above this range.
We are betting that the exit from this trade will be upwards, at least to $32300-32500.
"Accidentally" on the upside, the price of BTC can be pushed higher to the targets we wrote in this idea.
Still, it seems to us that in consolidations from below are better and more confident in buying back the BTC price. And before that, the BTCUSD price falls easily because MM allows it and drives "small money" into short positions.
One example is the FUD of 30.06 about the failure of the Btc Etf Blackrock, the price fell exactly where it was profitable for MM and rebounded sharply upwards).
Well, we placed our bet: "Croupiers, spin the wheel" :)
Have a great weekend!)
_____________________
Did you like our analysis? Leave a comment, like, and follow to get more

bitcoin in next moveBitcoin on the Day has a Possible M possible bullish wedge. we are in Mojor decision point in my opinion as it will choice our next possible month price action trend direction.
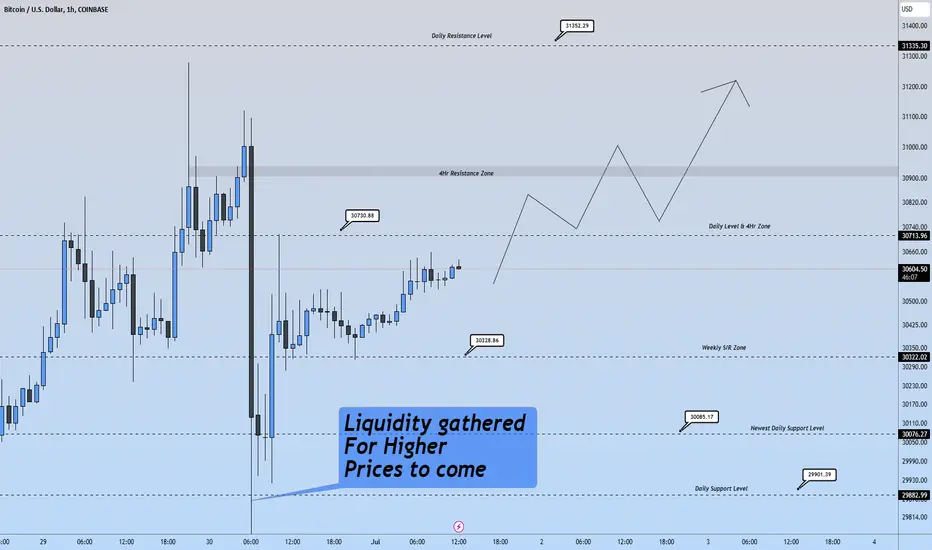
Momentum gaining traction after Monthly Close 🚀The final week of June was spent consolidating as some Buyers took profit and Short Sellers have attempted to force price down. After the Monthly candle closed on Saturday, we can see it as the beginning for a new ascent. Since then price has climbed 2.35% at the time of writing and reached a high of 3%. Weekly timeframe : There is no Supply AKA Resistance level on the weekly timeframe up to $47K. As long as the Weekly timeframe holds above $30,328 Weekly Support Level, we can look for higher prices. Daily timeframe : Our remaining pit stops for a bullish ascent will be a fight to close above $31,352 Daily resistance and $31,787 Daily resistance. After that there will likely be liquidity above structural wick highs at $32,373. I would not be surprised if BTC wanted a retest at $30,715 Daily S/R Zone once more before a further ascent. It used this price level as a resistance for the entirety of last week and it will likley act as a support moving forward.

HIGH/USDT Significant long moveAnalysis of Long Move for HIGH/USDT at Daily Chart-Time:
The HIGH/USDT pair is currently experiencing a significant long move on the daily chart, indicating a strong bullish market sentiment. Traders may consider taking long positions, anticipating further price appreciation.
Technical analysis using moving averages, such as the EMA (Exponential Moving Average), supports the presence of a bull market. The upward slope of the moving averages indicates positive momentum and potential buying opportunities for traders.
The RSI (Relative Strength Index) can be used to confirm the bullish trend. An RSI reading above 50 suggests bullish sentiment and reinforces the notion of a long move for HIGH/USDT.
Applying Fibonacci levels and Fibonacci retracement to the price action can help identify key support and resistance levels within the long move. Traders can look for price retracements to Fibonacci levels, such as 38.2% or 50%, as potential areas for adding to long positions.
Volume analysis and the volume profile are important indicators of the strength of the long move. Increasing volume during upward price movements signifies higher demand and supports the bullish trend in HIGH/USDT.
Breakouts above significant resistance levels and the formation of higher highs and higher lows indicate a sustained upward trend. Trendlines can be drawn to connect these higher lows, providing potential entry and exit points for long positions.
Support levels act as price floors during pullbacks and corrections, offering opportunities for traders to enter or add to their long positions. Monitoring these support levels is crucial for managing risk and setting appropriate stop loss levels.
When trading the HIGH/USDT pair, it is important to consider volatility, which can present both opportunities and risks. Traders should adjust their strategies accordingly and be prepared for potential price fluctuations. Liquidity is also essential, ensuring smooth execution of trades and minimizing slippage.
In conclusion, the HIGH/USDT pair is currently in a long move at the daily chart-time, signaling a strong bullish market sentiment. Traders may consider long positions based on technical analysis, including moving averages, RSI, Fibonacci levels, and volume analysis. Monitoring support levels, managing risk, and accounting for volatility and liquidity are important factors for successful trading in this bullish market environment.

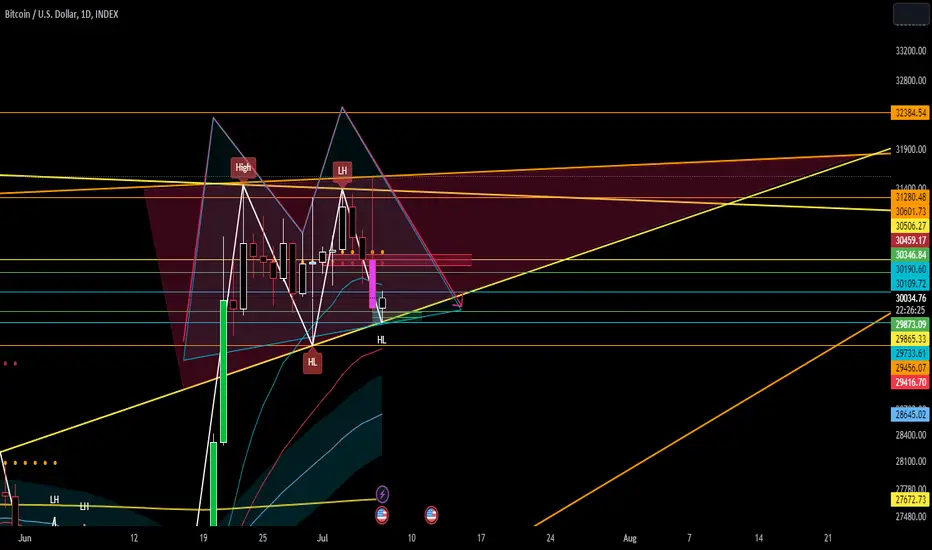
Solid Monthly Candle & Momentum through Weekly Candle Closure↗️The Monthly closed strongly Bullish with a solid engulfing candle of the previous monthly candle. We closed above $29,243 Monthly resistance. Also we closed above the weekly timeframe Resistance level at $30,322. The Monhtly candle closed but we have not see the weekly closure yet. Into the close of the weekly candle I'm anticipating a bullish push to the Upside. Our massive liquidations on Friday I believe served as a catalyst for a clear path forward. Looking at the monthly candle we can expect another Higher High on the next candle since it's in an uptrend and that was confirmed with market structure during the close of March's Monthly candle.
It's my belief that we will soon see our deeply feared $30,730 Daily Resistance Level act as a support for price.
bBITCOIN bullish pattren btc made head and shoulders pattern and has been reteset
target for this pattren around 39-40K

Positional struggle on the Bitcoin price. Buyers' turn to attackDuring this week, sellers tried to push the BTC price below $30k at least 3-4 times.
But, as you can see on the chart, all attempts failed and the Bitcoin price bounced up within the $30-31k consolidation.
It was the buyer's turn to strike back and test the strength of the sellers.
The most difficult task is "first strike" and trying to break above $31400.
If buyers manage to fix the BTCUSD price above consolidation, then further growth should be easier.
Targets are $32650, $33600, $34550.
Buyers have a good chance to "nice close" both the weekly and monthly candlesticks in a few days.
The critical point is below $29500-30000 , where a large number of stop orders are hidden, and if sellers manage to bring the BTCUSDT price down there, it will be a matter of hours before it drops to $28000.
_____________________
Did you like our analysis? Leave a comment, like, and follow to get more

Yet Again Bitcoin! Failure to close above $30,715 🧟Looking for downside as we move into the next Daily candle for a few reasons. We have had 3 Daily candles back to back fail to close above $30,715 Daily Resistance which was initially created on June 24th. this resistance has held for nearly a week now after a 25% pump from the lows. In the short term it's fair to anticipate a bit more depreciation in bitcoin value. Bitcoin is currently in a range and has been since the 23rd of June. The price behavior has been alot less amusing than the prior week. Just yesterday after dipping into Daily support at $29,901 .. it only took about 15 hours before price ran 2.8% back to the highs. The high of the range $30,715 said " not today" and price still sits in the range. Price is currently in the top half of the range.
I believe Inflation red folder news tomorrow during NY Session will help lead the way down and retrace back to at least our newest daily support level $30,085. At that point in time, if we get there, we will reassess. If we've entered the Fomo phase, why have we not continued pumping. Price is stalling at Medium term highs as the Monthly candle comes to a closure.
As the new monthly candle opens in 24 hours, it will likely create a bottom wick before it attemtps to drive up. That is the idea for this retracement into the new monthly candle
1Hr Timeframe

BITCOIN Scalp 24 June 2023Hello Trader
Bitcoin now is on bullish environment
last Friday showing market break high of Wednesday and Thursday with strong bull candle
Now what i'm anticipate on Saturday is market retrace and continue the expansion leg
During Asia Session Market grab Sell Side LQ and break higher sign Asia session bullish
now i'm waiting retracement on London to continue higher at least to $31,100
I anticipate a Long from below Midnight Opening Price (00:00 NY time)

Bitcoin will PUMP more soon, but NOT that much as you thinkHello, everyone!
While CRYPTOCAP:BTC continues it's fluctuations next to the $30k, a lot of traders have question if it's going to continue pumping without any significant correction to $40k+ or it's just a trap and dump is imminent in the upcoming week. Let's consider the currect price action to understand it.
📈 Why the pump continuation is likely?
If we consider the growth from FWB:25K to FWB:31K as the entire impulse it should consists of 5 Elliott waves. As I defined the appropriate time frame here is 2h because we need 100-140 bars to apply analysis. Awesome oscillator is showing us that wave 3 has been ended (likely), but we have not seen the zero line crossunder. It means that wave 4 has not been finihsed yet. At the same time the target area inside the 0.38-0.5 Fibonacci retracement levels has not been reached. The super strong support now is located at $29100 because of target area and the end of the lower degree wave 4(inside the wave 3). From this price I expect another one leg up in wave 5 to $32k.
📉 Why bears can win this battle?
On the 4h time frame we have already seen two bearish reversal bars with the squat MFI state. All these bars were the sign of the waves 3 in 3 anf 5 in 3 finish. The wave 5 is imminent, but when we will see the third bearish reversal bar the situation is gonna be very dangerous. When the price will set the new higher high and Awesome oscillator prints divergence it's gonna be the bearish sign of incoming big corretion. That's why you should be very careful now.
Best regards, Ivan
____________________________________________________________
🔥Please, follow me and smash the rocket🚀 button to support me🔥

Crypto's Impending Boom: Market Shifts and Global DynamicsCryptocurrencies in the Face of Rising Bond Yields and a Strengthening Dollar
Cryptocurrencies have been on a short-term downward trend, attributed to deteriorating liquidity within crypto and outside crypto due to rising bond yields and the strengthening dollar, as they are sensitive to rates and liquidity fluctuations. Their recent downturn can also be explained by the fact that they had performed much better than their interest rate & liquidity models had suggested and by US tech stocks sucking flows and liquidity.
Capital Flows: The Rising Crypto Tide in Hong Kong
Significant rallies in the crypto sector could be on the horizon, especially when the double bottoms in Bitcoin and Ethereum are swept. Some important reasons are the impending acceptance of crypto exchanges by Hong Kong and the return of cash to Voyager's creditors. As Chinese citizens grapple with capital outflows, liquidity flows from China could be redirected to the crypto sector through Hong Kong. At the same time, with mounting US-China tensions, cryptocurrencies could provide an alternative, potentially the only proxy investment to AI (US big tech).
In the Face of Uncommon Volatility: A Premonition of Crypto Spikes
As we navigate the debt ceiling crisis, we might experience volatility spikes, even though volatility remains subdued. Next week we might start seeing some significant moves, as USD 3.6 billion worth of options expired this Friday, constituting roughly 26% of Deribit's open interest. Implied volatility is at its lowest, with DVOL trading at 44 for BTC and ETH and shorter-dated even lower. This is relatively uncommon, and whenever we've seen such low volatility, a significant spike in vol has followed soon after.
A Confluence of Events: Setting the Stage for Crypto Price Surge
The latest spike in January coincided with a price rally, which may reoccur, given the significant expiration of mainly call options, with a Put/Call ratio of 0.38. With events such as Voyager distributing >1B in cash to creditors, Hong Kong authorizing crypto trade for its citizens, US tech investors capitalizing/diversifying on >3T gains and redirecting some into crypto, and potential issues with the US banking system or USD stablecoins due to a possible US default, the stage is set for a potentially explosive growth in crypto prices. The last part is something many ignore, but FUD, or real issues around banks or stablecoins, could recreate the conditions for another SVB - USDC type rally, as investors view Bitcoin and Ethereum as the safe havens of crypto and of the financial system broadly.
Bullish on Synergy: The Powerful Integration of AI and Crypto
The convergence of AI and crypto can create new business models, enhance decision-making processes, improve trust and transparency, and unlock organizational and operational efficiencies. Some areas where AI and crypto can synergize: AI-Powered Smart Contracts, New forms of financial tools, AI-to-AI financial transactions, Enhanced Security and Privacy both for AI and Cryptocurrencies and so on. AI will integrate and interact with open and trustless systems like crypto, but it's unlikely to interact with closed systems like banks. The confluence between the two technologies is apparent, making me bullish long-term.
Trade ideas
As mentioned in my recent ETHBTC idea, Ethereum looks stronger than Bitcoin. However, Bitcoin looks cleaner than Ethereum. Bitcoin has two critical untested areas lower: 25000-25700 - with 25200 and the double bottom at 25800 being the basic levels, and 22600-23600 - which is an area that the market didn't test appropriately as it went higher, especially 22600, which was the critical breakout level.
BTCUSD has two triple tops higher, one around 27600 and the other around 29900. It's unclear whether the double bottom will be swept first or one or both of the triple tops will be swept first, but to me, it's clear that the market will probably rally much higher once the bottom is swept. Given everything I mentioned above, it's better to bet on the upside and not short the market here. Therefore long around 25700 and cut below 24900, long around 23600 and cut below 22500, with targets at 27600 and 29900.
Despite all the bankruptcies and negativity around US regulations, it's better to go long than short, as everything else seems quite positive. Although there are some potential negative catalysts for crypto, and 2023-2024 could be like 2019-2020 for crypto, I think that dips are for buying and that it's more likely than not that we are in a bull market rather than a bear market.

Ending of a Dramatic Week / Bitcoin ₿Quite the week for BTC.
1) A Buy Publishing was made last thursday at price $25,607
2) A Long Ethereum Publishing was made on Saturday at price $1,728
3) A Neutral Publishing was made on Tuesday at price $27,943
4) A Short Publishing was made Yesterday at price $29,318
Current Price is $30,177
BTC has been breaking zones to the upside and it is easy to understand that many players could be engaging in a chase with the market. I Choose patience and good Risk/Reward ideas over chasing the market and hoping that it will continue to rise. I can take a buy here but it's risky. Better to wait on a pullback. In the meantime I see good RR trade ideas. At the end of the day it comes down to the repetition of a process that has probabilities in your favor. And of course manging risk and cutting losses short when you are wrong.

Risk/Reward Bitcoin Setup ⛲Risk/Reward is the name of the game. In my scalping this morning I've taken 10 trades. I have gone on a losing streak of 10 trades in a row. After reading the books I've become aware that this is not unsual for a profitable system in the markets. I like the analogy of pulling marbles out of a hat. If you have an edge in the market then over the long term the marbles you pull out of the Hat will net you a positive R. However, in the short term you may pull out 10 marbles consecutively that do not net you anything. This is where trust in your experience and system will serve us as traders for a long time to come.
Technicals : Price has arrived at our monhtly supply zone 29,305$. Price is up 9ish percent over 2 days. The Market is not random and I'm aware of that. 8 4hr candles in a row is not common and that is a fact. Combining these confluences..

Bitcoin price and altcoins future: dreams or nearest trueTwo months ago, we published the BTCUSDT idea with two possible price movement fractals
As you can see, the green fractal is working quite well
Today's fractal, which we took from the history of BTC trading in 2016, also fits quite well with the current behavior of market participants.
The two fractals have an interesting coincidence: they do not predict a sharp rise in the BTC price. They show that in the past, in similar situations, there was a long consolidation in a narrow trading range with a smooth "creeping" growth.
If we believe the fractals superimposed on the current trading situation, then the BTCUSDT price of will be able to update the maximum of 2023, above $31,000, only by the end of this year.
What will happen to altcoins during this time?
In order for altcoins to start growing, the dominance of BTC needs to start falling.
At the moment, BTC.D has updated the highs of 2021-2023 and the growth potential of at least to 51-53% is now visible.
Assuming that the BTCUSDT price will be trading in the range of $25,000-30000 by the end of the year, and that BTC.D will simultaneously falling to at least 44%, this will be "a ray of hope" for the growth of altcoin prices.
The logic is as follows: while the BTCUSD price is trading in a narrow range for a long time, the "big money" may get bored and start to gradually transfer capital from Bitcoin to altcoins. Or pumps alts in BTC pairs is the technical aspects of the "magicians"
In turn, this process may trigger the following:
a drop in the dominance of BTC.D, the main thing is not to increase the dominance of USDT)
pumping of certain "categories" of altcoins. By the way, we are still thinking about what "caste" of altcoins will be called the next "future of the crypto market", as it was with ICOs, DeFi, NFTs, or AI with Web3.
the inflow of "new and fresh" money to the crypto market, because here everything is growing so fast that you can get fabulously rich in a matter of days)
which can scale the pace and number of altcoin pumps.
What are your thoughts on the above? Is it real? What type of altcoins will start the next alt-season? Share your thoughts in the comments.
_____________________
Did you like our analysis? Leave a comment, like, and follow to get more

Bullish Descending Wedge ? ₿ Weekly S/R Level $24,363Price is squeezing to the downside as we approach our 24,363$ Weekly S/R Zone. It also happens to be an extreme Daily Zone. The next Daily zone being at 22K which is a 10% drop from $24,363 Level. Short Traders have enjoyed a consistent downside push across the past 2 Months ever since BTC tapped into the $30,000 Weekly Level. This Long idea has to do more with the psychology of some players wanting to jump in the short/downside train. We'll see if a correction will change their minds as I can see a correction to clear out liquidity after we touch into a weekly S/R level ( 24,363$) . This Weekly s/r level was quite relevant during August 22' and February 23' .

BTC shorters panic is comingFrom 26th of April till today shorters gained 25000 positions on Binance
Shorters will start to close their losses as soon as price will breake up (it will break up),
That will cause panic.
Pressure on price from the bottom because of closing shorts will spur new longs.
My previous BTC target around 35000 still active.
