BTC perfect wick to wick symmetrical triangle - 109K or 98K You are looking at a 100% perfect wick to wick symmetrical triangle
Widest vertical range of the triangle from
Top wick: ~$105,700
Bottom wick: ~$100,700
Height = $5,000
Breakout level (horizontal mid-point of triangle):
Roughly $103,500 -104,000
Bullish Breakout Target:
$103,500 + $5,000 = $108,500
$104,00 + $5,000 = $109.000
108.5 to 109K will be your pure pattern target if BTC breaks to the upside with volume.
Bearish Breakdown Target: GETTEX:98K
FOR FUN I ASK CHAT GPT WHAT ARE THE ODDS WE BREAKOUT
Break Direction Target Confidence
Up (likely) $109,000 60–70%
Down (less likely) $98,000 10–15%
Bitcoinusd

Does bitcoin want to take liquidity at lower levels before moon?BTC is ranging with a volume gap below. The volume gap below suggests that there is no liquidity until 98k. If the market wants to hunt for liquidity before going to the moon, that is where it will go.
Full TA: Link in the BIO

BTC | New ATH Incoming | + 135% ??A very interesting fractal from 2021 lead to a 135% increase - and a new all time high.
Bitcoin has been following similar patterns to the bullish twin-peaks in 2021. After a multi-month correction, the price proceeded to increase another 135% over the next few months. Some weeks fast, and some weeks sideways.
Is it possible that BTC follows a similar pattern - and increase another 135%, all the way to 170k?
Hec, I'd even be happy with just a 100% ! That would lead us up to around 149k, which can also be considered a phycological resistance zone.
While you're here! Check out this post on PEPE:
_________________
BINANCE:BTCUSDT

Bitcoin May 13, 20251. Trend Overview (Short- to Mid-Term)
• Bitcoin is in a strong uptrend, supported by the steep rise from ~84,000 to over 104,000.
• The price is currently in a consolidation zone near recent highs, indicating indecision but not yet weakness.
• The price is above all major moving averages (9 EMA, 20 SMA, 50 SMA, 200 SMA) — a classic bullish structure.
• However, the sharp angle of the short-term trendline shows the rally may be overextended and vulnerable to a pullback.
⸻
2. Price Action & Candle Pattern
• The recent small-bodied candles with long upper wicks show buying pressure weakening near 104,000 — a common sign of exhaustion or distribution.
• No strong bullish engulfing or reversal candles yet — currently a neutral-to-cautious stance.
⸻
3. Volume Analysis
• Volume has decreased during this sideways movement.
• This hints at buyer fatigue or waiting for a catalyst.
• Volume spikes were mostly seen on bullish candles earlier, showing strong buying interest earlier in the rally, but less so now.
4. Key Technical Levels
Resistance
104,000
Multiple rejections here; breakout level for bullish continuation
Support
102,100–102,800
Confluence of 9 EMA and rising trendline — make-or-break zone
Support
100,000
Psychological round number + recent base
Support
98,600
20 SMA support — deeper correction zone if trend breaks
⸻
5. Pattern and Risk Assessment
• A rising wedge pattern appears to be forming — typically bearish if confirmed.
• The uptrend is intact, but:
• A close below 102,100 on higher volume could trigger a short-term pullback toward 100,000 or 98,600.
• A close above 104,000 with volume would confirm bullish continuation.
⸻
Overall Conclusion
Bitcoin remains technically bullish, but it’s now at a critical decision point:
• As long as price stays above the 102,100–102,800 zone, bulls are in control.
• Watch volume closely — low volume favors pullback; high-volume breakout above 104,000 favors another leg higher.
• A rising wedge + weakening volume implies caution — partial profit-taking or tight stop-losses would be prudent for short-term traders.

BTCUSD , 1DPattern is looking very good , we can expect a very good move if the upper trendline will Break
wait until for the break of upper trendline
follow for more swing trade ideas

Bitcoin blows up the market: $100,000 broken.Bitcoin (BTCUSD) surged past the key $100,000 mark again on Thursday, May 8, 2025 — for the first time since February this year. During the day, BTC traded between $101,500 and $102,700, posting a daily gain of around 5.3%. Its market capitalization exceeded $2 trillion.
Why Bitcoin is back at $100K — and what’s driving it higher:
Macro tailwinds:
Growing expectations of Fed rate cuts , reinforced by Donald Trump’s calls for lower interest rates, have fueled risk appetite across markets — Bitcoin included.
US – UK trade deal hype : Hints of a potential trade agreement between the US and the UK announced by President Trump added a major boost to market sentiment, sparking a rally.
Institutional demand : Massive inflows into US spot Bitcoin ETFs continue. Over $1.8 billion flowed in last week alone, with some sources reporting $2.68 billion by Thursday — the largest weekly inflow since mid-December 2024. Companies like MicroStrategy are leading the charge with more BTC purchases.
Weaker dollar & falling bond yields : These trends have enhanced Bitcoin’s appeal as a hedge.
Market sentiment & BTC dominance : Breaking above $100K triggered optimism and possible FOMO (fear of missing out). Bitcoin’s market dominance now exceeds 60%, the highest since early 2021, reflecting investor preference for BTC over altcoins in the current phase.
The appointment of Paul Atkins as SEC Chair , along with a softer US regulatory stance and Arizona’s new pro-crypto law, are setting the stage for continued growth.
FreshForex analysts note that the current rally is mainly driven by institutional players, while retail investors have yet to fully engage.

Will it fall? Yes. The reasons are HERE!Reasons why it will drop:
1. hypurrscan.io
This is an insider — take a closer look.
2. Selling pressure during the first attempt to rise.
3. Selling pressure is still ongoing.
4. Very low liquidity ahead. It's easy to push the price down because the rise happened with almost no consolidation.
5. Whoever is applying pressure needs to accumulate cheaper.

Bitcoin BTC price analysis - READ the text !There was some positive news: "The US and China have agreed to reduce tariffs for 90 days."
The price of CRYPTOCAP:BTC has entered the zone of total sales - $105-110 thousand.
🕯 Metrics show that large wallets are now opening short positions worth hundreds of millions of dollars, and on the other hand, no less large wallets that organized this rebound in the OKX:BTCUSDT price are very tempted to launch the final stage of cascading liquidations of shorts.
🍿 So, stock up on popcorn - it's going to be "fun" today/tomorrow, and then we'll go to the stronger side!)
Globally, before the growth wave begins, we want to see the final "shake-up" of the longs who have survived everything and still held their positions and didn't give up.
1️⃣ Weak correction in the range of $90-91k - to close the GAP that formed on this rebound and then continue to confidently update ATH with a clear conscience.
2️⃣ A strong correction to the range of $80-82k - during which it will be very interesting to watch the capital flow and dominance.
Which scenario is closer to your heart? Write in the comments!
_____________________
Did you like our analysis? Leave a comment, like, and follow to get more

BITCOIN - Important Breakout (BoS)Hello Traders !
On Monday 5 May, The BTC reached the support level (92800 - 93500).
The price broke the higher high (Break of Structure).
So, I expect a new bullish move🚀
_______________
TARGET: 104000🎯

Btc alien technologyHello guys i was spot on before and i will continue be spot on 140k-160k FLUSH TO 40-42k maybe wick 38.5k
Thanks retail Waits for 20-30k and not happening Bye ✋
Then load up cause NeXT leg Will be historICAL
ADAPT OR DIE
CRYPTO IS THE FUTURE CURRENCY.
AI IS FUTURE TECHNOLOGY
WEB3 IS EXPANDING.

Bitcoin Struggles at the $95,000 BarrierIn today’s session, BTC has once again posted a decline of over 2%, as the previous bullish bias struggles to break through the $95,000 resistance level. The neutrality forming on the chart around this zone reflects the uncertainty in market sentiment, which is also evident in the Crypto Fear and Greed Index, currently oscillating in the neutral range at 45 points. The market appears to be watching closely for developments in the trade war and the Federal Reserve's interest rate decision on Wednesday before resuming the buying pressure that has driven BTC in recent weeks.
Short-Term Bullish Trend
Since April 9, a sustained bullish trend has been forming in BTC’s price, until momentum stalled near the $95,000 resistance zone. Prolonged price neutrality around this level may begin to slow the upward momentum that had been developing and lead to a consolidation phase. However, the long-term outlook still shows a clear dominance of buying interest.
Technical Indicators:
RSI: The RSI line approached the overbought zone near the 70 level, but has since begun to trend downward, suggesting that the recent buying momentum is weakening. This opens the door for potential short-term bearish corrections.
MACD: The MACD histogram is slowly approaching the zero line, which may indicate a balance of forces in the market. Furthermore, if a crossover between the MACD line and the signal line occurs in the short term, it could be interpreted as the start of a sustained bearish momentum that may affect upward price movements.
Key Levels to Watch:
$95,000 – Major Resistance: The most relevant resistance level for BTC, aligned with the 61.8% Fibonacci retracement. A breakout above this zone could confirm the strength of buying interest and pave the way for a more extended bullish trend.
$90,000 – Nearby Support: This level aligns with neutral consolidation areas from previous sessions and could serve as a short-term support in the face of potential pullbacks.
$86,500 – Key Support: This level is marked by the 50-period simple moving average. A drop to this level could break the short-term bullish structure and extend bearish momentum.
Written by Julian Pineda, CFA – Market Analyst

BTCUSDTLooks like BTCUSDT wants to make us smile again 🙂 A new opportunity for a Sell signal has emerged, and I’ll be taking advantage of it. However, don’t forget that in 35 minutes**, the *U.S. Services Purchasing Managers' Index (PMI)* data will be released — and that could cause some market volatility. I’m opening the trade with that in mind, so make sure you adjust your risk accordingly.
🔍 Criteria:
✔️ Timeframe: 15M
✔️ Risk-to-Reward Ratio: 1:1.60
✔️ Trade Direction: Sell
✔️ Entry Price: 94333.33
✔️ Take Profit: 93908.54
✔️ Stop Loss: 94598.39
🔔 Disclaimer: This is not financial advice. It's a trade I’m taking based on my own system, shared purely for educational purposes.
📌 If you're also interested in systematic and data-driven trading strategies:
💡 Don’t forget to follow the page and subscribe to stay updated on future analyses."

Ratio Charts in TradingView and IAAbove you can see the Bitcoin to Ethereum ratio chart. Ratio analysis between two or more symbols is a critical method for comparing the strength and weakness of assets relative to each other. TradingView offers basic capabilities for this task, but with the help of artificial intelligence (AI) and custom scripts, much more advanced and creative analyses can be conducted.
Here are some practical ideas:
1. Creating Conditional Ratio Scripts
2. Comparing Relative Averages and Issuing Smart Signals
3. Calculating Composite Ratios of Multiple Assets
4. Smart Alerts Based on Price Pattern Breakouts
For more information, search Google for "How to Use Ratio Charts in TradingView: A Hidden Gem for Traders."

BTC - NEW ATH on the HorizonBitcoin has surprised us with a sudden turnaround over the past two weeks.
✅ Technical indicators are bullish
✅ Candle stick patterns are bullish
✅ Trendlines are bullish
I can't help but come to any other conclusion - BTC is now BULLISH, likely making it's way to a new ATH.
This will bring about my much anticipated ALTSEASON:
_________________
BINANCE:BTCUSDT

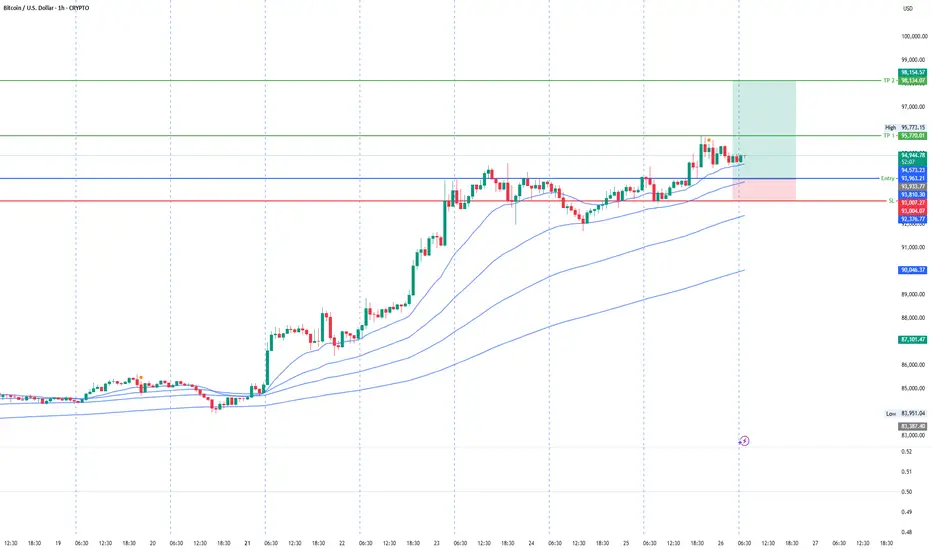
Bullish Trend Continues upto 98KUnder current market conditions, the area near 93929 has been identified as a critical support zone, where the AI model detects a high-probability trade setup.
Suppose the market demonstrates increased volume and price stability above key moving averages in the 93929 area. In that case, traders are advised to monitor for trend-continuation entry opportunities in alignment with the prevailing momentum.
Profit targets are defined at 95764 and 98143, corresponding to logical technical resistance zones. These levels are designed for staged profit-taking across different trade management styles. Stop-loss should be strictly enforced at the designated level; once breached, the strategy is considered invalidated to limit potential downside.
BTC is trading within the equilibrium zone and..Bitcoin is now trading within my equilibrium zone. This will be one to watch for clues about the broader market, as it's currently leading the way.
Good luck, and always use a stop-loss!

Bitcoin short-term buyBitcoin's recent bear movement has raised some buying opportunity in the short-term. There is a potential buy opportunity you can consider.

XauUsd (Gold)Good day traders, I haven’t been feeling well but I thought let me give you Gold will I recover.
Gold on the 4h we had a shift in structure lower and for our daily that’s just confirms a reversal I’ve been anticipating for a while now.
But here we focusing on what price is currently doing on the 1 hour and 15 minutes, there in that rectangle box that represents my inverse FVG which we saw price close above. Now we wanna see price falling the close below that inverse to enter long.

BTC - 4H Bearish Bias Remains Active📉 BINANCE:BTCUSDT – Bearish Bias Remains Active 📉
COINBASE:BTCUSD continues to show strong bearish momentum, and the current structure suggests a likely drop from the $85K– GETTEX:87K zone.
🔍 Key Setup:
There's a resistance zone around $86,000, backed by favorable liquidity just above it.
This setup increases the probability of a liquidity grab and sharp rejection, which aligns with our bearish scenario.
Target zones are mapped near $79K and $76K, depending on how price reacts to the first support.
✅ We’re watching closely for price action confirmation before entering a short.
Also, check our previous Bitcoin idea, where we predicted the fall from FWB:83K to below $77K—it played out perfectly!
💡 Follow for real-time updates and don’t miss the next precision trade! 🚀

Choose your Side- i often compare TheKing with Nasdaq right now.
- Have a main reason :
- NAS100 (Nasdaq) have mostly "Top Tech Companies" acting as Thermometers in this index.
- SPX (SP500) have Tech Companies + traditional ones. Nasdaq Companies are also included in SPX, but 500 Companies start to be a lot.
- DJIA (Dow Jones Industrial Average) is a Mastodons, i don't use it much because this top 30 is too mixed ( coca cola, boeing, techs, big banks, nike.. etc).
- i mostly use very high TFs, i prefer look from far, less noise, more easy and less headaches.
- i use sometimes to trade with 1D, H12, H4 TFs but when we are bullish. In bearmarket, it's hard to find entries points in bearish mode.
- i don't short markets and accumulate more coins/tokens, so i just DCA, Dollar Cost Averaging is investing a fixed amount of money into a particular investment at regular intervals.
- so this chart is basically only about MACD :
- it's really interesting to see Nasdaq making another red columns in 3W TF, while the markets should recover slowly.
- if you take a look at BTC, columns stayed in Light Red Color and reducing size.
What could it means ?
- Keep in mind that BTC is not a STOCK.
- One of the most pivotal events on Bitcoin's blockchain is the halving, when the supply of new bitcoins is cut in half (2024).
- BTC have 21M Supplies and that's all. no more will be created.
- At any time BTC could stop to follow Nasdaq and do his way, TheKing used to do that before already.
- A small bounce in Nasdaq could be also a huge move for BTC.
- " Choose your side " and DCA the money you don't need for living.
Happy Tr4Ding !

The Perfect Bounce- Quick update
- IYKYK.
- Everything is in graph, no need a long speech.
Happy Tr4Ding !

Bitcoin Monitoring- This is not a trade setup.
--------------------------------------------
- Zones to keep close surveillance :
--------------------------------------------
- 25,200$
- 27,300$
--------------------------------------------
Happy Tr4Ding!

BTC Diamond Ser ?- While bears see bearish pennants, I see diamonds in the rough.
- I remain bullish, not due to the price, but for the sake of humanity.
- This isn’t an analysis, just a light-hearted joke, so please don’t roast me too hard! 🙏.
- Remember, diamonds are forever.
- Hodl!
Happy Tr4Ding!
