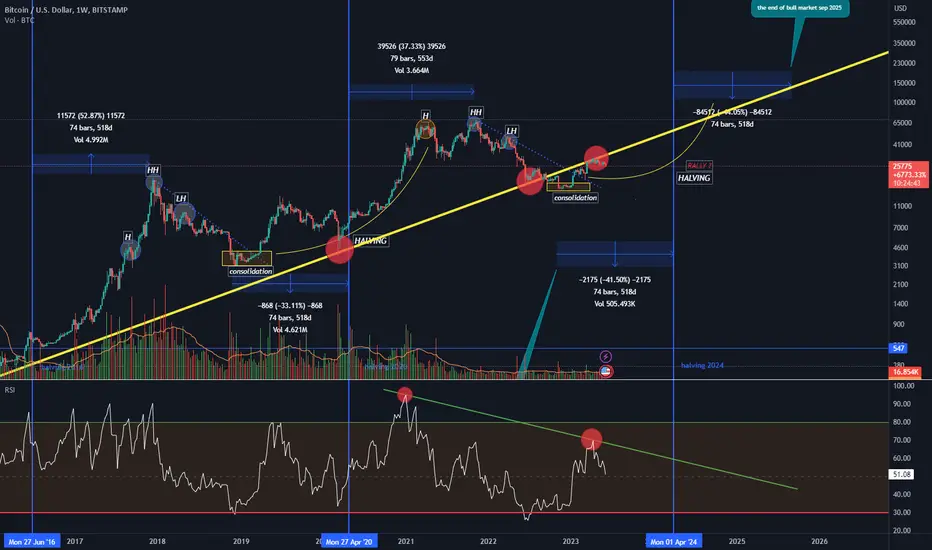
Profit Taking after 5% Jump 🍞Profit taking for a trader is crucial because you must pay yourself for the time spent in front of the chart. So long as you follow the adage "Let your profits run and cut your losses short." It is a job and not a hobby/passion at the end of the day. We are playing with real money here! The market has ascended 5% and that is about the extent of the Average True Range when Bitcoin pumps or dumps. So you could roll the dice and hold to see if we run another 2-3% but why not stay disciplined. Price has reached a Weekly resistance level anyways. Pay yourself and go enjoy your life. Anyways there are some players who have been lying on the sidelines for a chance to jump in at a Weekly Level.
Nonetheless I am just another talking head on Tradingview. Follow your Plan because if you believe in it, then it is the true way.
Bitcoinusd

Bitcoin Potential DownsidesHey Traders, During today's trading session, our focus is on monitoring BTCUSD for a potential selling opportunity around the 27400 zone. Bitcoin is currently engaged in a downtrend and is in a correction phase, gradually approaching the significant support and resistance zone at 27400.
In the upcoming week, it is advisable to closely monitor the DXY (US Dollar Index) in order to confirm the overall market sentiment. A strong dollar tends to exert downward pressure on Bitcoin. Therefore, keeping an eye on the DXY can provide valuable insights into the potential impact on Bitcoin's performance. By assessing the strength of the dollar, we can better understand the broader market dynamics and make informed decisions regarding Bitcoin trading.
Trade safe, Joe.

Bitcoin will go down by Ending Diagonal Pattern❗️❗️❗️Bitcoin seems to have completed its 4th wave with the common Expanding Flat(ABC/3-3-5) structure, so that the microwave C structure is Ending Diagonal .
I expect Bitcoin to move towards a 🟢 heavy support zone($ 26,400-$ 25,800) 🟢 after breaking the lower Ending Diagonal line.
Bitcoin Analyze ( BTCUSDT ), 1-hour time frame ⏰.
Do not forget to put Stop loss for your positions (For every position you want to open).
Please follow your strategy, this is just my Idea, and I will be glad to see your ideas in this post.
Please do not forget the ✅' like' ✅ button 🙏😊 & Share it with your friends; thanks, and Trade safe.

BITCOIN MAKES CLASSIC DEAD CAT BOUNCEAs you can see in the chart, this is a very simple setup:
When we look at the big picture, we have a dead cat bounce breakout retest pattern.
As confirmation, we have a clear RSI bearish divergence and a descending triangle, which can be a good entry point.
As targets we have the clear support levels and we set an stop loss at the last swing high, so in case the price goes against the position, we protect our capital.
Sticking to ideas when proved wrong can be a very expensive mistake. Always be ready to change your mind.


Bitocoin daily chartBitocoin daily liqs from 2june22
.
.
.
.
.
.
.
.
.
.
.
.
.
.
.
.
.
.
.
.
.
.
.
.
.
.
.
.
.
.
.
.
.
.
.
.
.
.
.
.
.
.
.
.
.
.
.
.
.
.
.
.
.
BINANCE:BTCUSDT.P BITSTAMP:BTCUSD BYBIT:BTCUSD.P BITSTAMP:BTCUSD BINANCE:BTCUSDT.P BITSTAMP:BTCUSD BINANCE:BTCUSDT


[ BTC ₿ ] Set for a Pullback? ↘️- BTC Monthly candle is set to close in 6 Days and it appears to be closing as an engulfing candle
- This current weekly candle has 4 days left to close. We have confirmed momentum already as the 3 previous weekly candles are bearish
- The weekly timeframe is rejecting the June 6th,2022 Weekly Resistance Level at ( 30,000$ )
- Our Last Daily Level 26,749$ has just seen a large Daily engulfing candle close strongly below it
-We may observe here on the line chart that the price is dribbling downwards and the bears appear to be in charge at least in the short term here
- The first target for shorts being ( 24,309 $ ) Daily Zone & Weekly S/R Zone
- Shorts target for June is ( 22,009 $ ) Weekly Zzone

BTC Short and then Long respectively So this analysis takes into consideration technical touch points, the Fibonacci retracement to 0.5 and 0.618 is my personal favorite to load up and go Long.
For now it seems that support is exactly at 0.5 (22K) and 0.618 (20K) respectively. If we take the bottom of BTC and not 16.3K when the rally started.
3rd touch point on the channel support, waiting to see whether it rejects/goes through.
A Rate hike of .25 basis pts appears to not be on the table for tomorrow but next month it is. Who know what will happen.
This rally needs to cool off, grab liquidity at Demand zones and retrace before Longing and also fill CME gaps at 30 K ish etc...

Capitulation before more Longs ♟️Price action is looking quite dreary for Bitcoin bulls at least in the short term. The June 6th 5-6 % increase in price was retraced in 3 days & 10 Hours. The 5% increase prior to that, on May 28th, was duly corrected in the same amount of time (3 days). Additionally, the market is likely to see lower prices with fears surrounding recent SEC developments against major Crypto exchanges. ( Binance & Coinbase ) The Market is creating Lower Lows and Lower Highs on the Daily timeframe. With the current weekly candle closing bearish in 20 Hours, I can't help myself but observe some fresh bearish pressure to begin the new week. This is something I have observed quite frequently when the Forex Market trends. All markets come down to supply and demand and Crypto is likely more of the same. A Weekly candle will likely create top and bottom wicks but if it doesn't, that's why we exit the market to cut losses short.

BTC/USD Bullish FlagBitcoin is forming a possible bullish flag on the daily chart.
MACD and RSI are neutral(a little bit in the negative area). Which means we have more room to the upside if a break of resistance comes. Look out for support and resistance levels. Currently 1.618 fibonacci support is keeping the price from coming down.
Weekly MACD is negative and RSI is neutral. Keep that in mind. Greater trend looks a little bit more bearish than bullish.
FED Meeting is in 44 hours. I wouldn't do anything too risky just before a FED meeting.
What do you think? Comments will be appreciated.

Bitcoin trendBitcoin is still in the uptrend channel, the next expected safe target is 29500 and still the expected targets based on the volume indicator are 33000 and 36000

The possibility of falling to a lower levelBitcoin has no choice but to correct to reach a safe support level
I have identified two levels that it is likely to react to

bitcoin update bitcoin rejecting its long cycle trendline
Hello Traders, here is the full analysis for this pair, let me know in the comment section below if you have any questions, the entry will be taken only if all rules of the strategies will be satisfied. I suggest you keep this pair on your watchlist and see if the rules of your strategy are satisfied. Please also refer to the Important Risk Notice linked below.
Don't Eat the Forbidden Fruit and Buy the High ❎The Market can do whatever it wants.
The market may do as it wishes whenever it pleases. Like the wrath of a god.
We are not gods. We are humans and not one of us is invincible.
Therefore we must only take good Risk/Reward ideas. Buying up here is not a good RR Idea.
Buying the High and chasing the market is Forbidden to professional traders. Just as Selling the low is.
These are principles that the trader learns along the long and painful journey to profitability.
This is how the Average man , through patience and diligence , may become the greatest of warriors.
And line his pocket in ever-increasing quantities. Don't chase but allow the market to arrive at your level's.
The latter has probabilities in favor.

Bitcoin Road Map (Daily Time Frame)🗺️!!!Hi everyone👋( Reading time less than 2 minutes ⏰).
First, I must say that Bitcoin reacts well to 🍴 Pitchfork lines 🍴, so one of our criteria for support and resistance lines for Bitcoin can be Pitchfork lines in the daily time frame⏰.
In theory, Bitcoin Elliott Waves completed its five impulse waves at a 🔴 heavy resistance zone($ 31,750-$ 28,140) 🔴.
📚 Teaching Tip 📚: Mostly, heavy support and resistance areas are not broken with a single attack.
Bitcoin has been moving in a descending channel for about 2 months. The structure of the waves in this descending channel is Double Three Correction(WXY) .
Bitcoin is currently completing microwave B of the main wave Y. I expect this wave to finish above the descending channel and in the 🟡 Time Reversal Zone(TRZ) 🟡.
The end of the Double Three Correction structure can end in the 🟢 support zone($ 25,280-$ 24,410) 🟢.
Bitcoin Analyze ( BTCUSDT ), Daily time frame ⏰.
Do not forget to put Stop loss for your positions (For every position you want to open).
Please follow your strategy, this is just my Idea, and I will be glad to see your ideas in this post.
Please do not forget the ✅' like '✅ button 🙏😊 & Share it with your friends; thanks, and Trade safe.

My bitcoin's analysis preferred alternative count On this bitcoin's daily chart, is showed an alternative to the first analysis, which suppose 5 waves are complete, and are followed by a combination three. there is a cluster arround the green zone, it represents a zone of confluence between the whole impulse retracement of 38.2% and the third wave's retracement of 50%, but there's more.. this zone is approximatly where W equals Y at one condition of course, and that is the top of intermediate wave (1) isnt overlapped, that puts the odds for another downmove arround the green zone, but as always confirmation is needed to validate this count in some form of reversal candlestick pattern or depending on each one's tool to validate the move , lets wait and see ...
down below is my first count of the move, and as in every tecnical aspect of financial markets, the analysis is general , but the risk and the interpretation are unique to each investor

fundamentals doing bad, while tecnicals have other ideasThis is bitcoin with a clear five waves up with a potential three unfolding, while there is a lot going on with crypto fundamentals and red numbers, the market has its correction as normally. From another side, bitcoin is showing the strongest pattern over all altcoins which is nonetheless new. I wanted to share this analysis to absorb some of the news falling from everywhere, which isnt related to bitcoin's major trend.

BtcSomeone asked me a question, I want to open a trade on Bit with three orders, the first is 20%, the second is 30%, and the third is 50% of the money that I am going to leave for Bit.
The only point is, set the damage limit based on your pain level

Keep an eye on $HIGH/USDTKeep an eye on $HIGH/USDT
Forming a Bullish Harmonic Chart Pattern and Target Mentioned
Did you find this crypto market analysis helpful? Stay updated about the latest crypto market update.
Please continue to follow my analysis and feel free to ask any queries, you may have. I am here to assist you.
TradingView: @FarmanBangashh

BTCUSD - Down Channel to Strong Trend LineBTCUSD has formed a down channel on this hourly chart
I expect a recovery to emerge at the strong trend line in white
This trend line coincides with prior bottoms and should be a strong recovery point.
Roughly at 25K

BITCOIN IN A DESCENDING CHANNELthe only way bitcoin can go up is to break the channel upwards while crossing the averages up.
the 50 and 100 period moving averages act as a resistance while 200 period moving average can potentially act as a support in case the price goes down to the lower band of the channel.

BtcAccording to the high-pressure selling behavior that we observed and according to the previous analysis that we did, in the first step, the first resistance ranges of Bitcoin are the numbers with red lines, which if it cannot be crossed, in the first step, it Two green lines and in the next step, a green box has been marked
