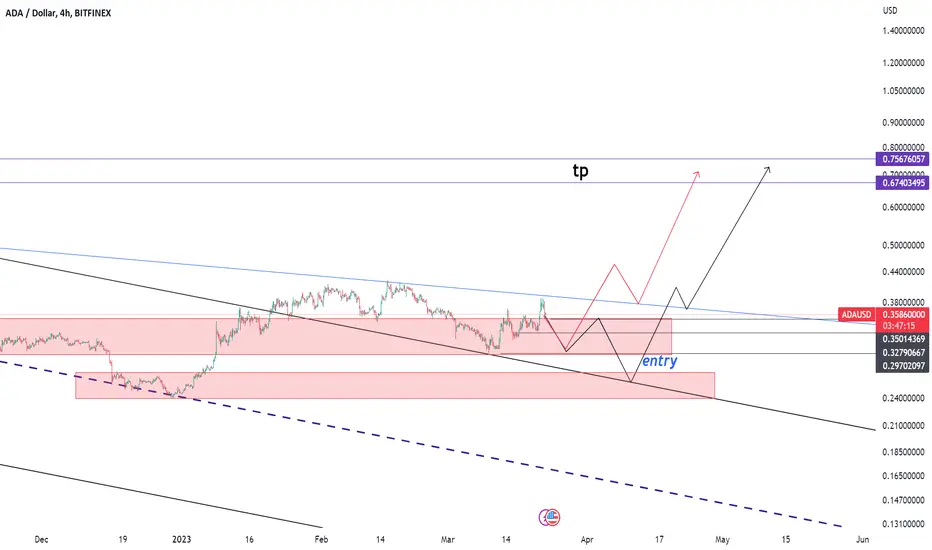
ADA/USD ANALYSISEntry points in the transaction are specified
Enter with the right volume and stick to the goal
Bitcoinusd
Bitcoin BTC price analysis. 🔥 FOMC meeting - New FED rateIt looks like the BTCUSDT price may start a correction today.
For many, it was a shock that risky assets, such as cryptocurrencies, were growing very actively amid the "banking crisis."
Over the past week, the BTCUSD price gained +30%, and over the previous two weeks, +45%. Such rapid growth was last seen in 2020, when the financial markets were well pumped up with money that was poured in for Covid-19 support.
And now, pay attention: there are rumors that the Fed has printed fresh $2 trillion, which will be injected into the financial system to stabilize situations and processes. Of course, the money will flow into various sectors of the economy.
The last time such "help" was in the "covid 2020", look at the charts, how everything grew then)
If we assume that the Inverted Head and Shoulders pattern has completed its formation on the BTC chart, then the final beautiful picture lacks a "finishing touch."
Retest the "base-neck" of the Head and Shoulders pattern
The first buy zone is $24660-25010 , if buyers do not allow the price to fall below, we will see a strong continuation of growth
The second buying zone is $22580-23600 . It is worth leaving capital for purchases in this zone as well. If the price drops here, the growth structure will not be disturbed and will be relevant, and a better average price will be a nice bonus.
The final growth target, according to this Inverted Head and Shoulders pattern, is in the region of $40,000 per Bitcoin
Tomorrow, 22.03.2023 is a very important day, as many financial market participants are waiting for the announcement of the new Fed Funds rate. As of the time of writing this idea, votes are 65% "yes" a +0.25% hike / 35% for the rate to remain unchanged at 4.75%.
Over the past 1.5 months, the mood of the participants has changed so much and many times that it would be accurate to say that 99% expect some kind of "surprise" tomorrow.
So, keep your finger on the pulse, put stops on your trading positions, subscribe to us, and write a comment. And we, in turn, will update our ideas and share our thoughts as quickly as possible.
Together we are strong!
_____________________
Did you like our analysis? Leave a comment, like, and follow to get more

BTCUSDT INSIDE DAY, FOMC NEWS UPDATE!BTCUSDT 1D,
The price of bitcoin has formed a specific direction on the daily timeframe, the thing is that you don't see a reversal immediately, before reversal we either go sideways and form balance OR we form inside day pattern like we currently witness.
What is inside day?: As you can see, a whole daily candle without breaking lowest low/highest high of the day before it, the candle is inside of that resistance and support. Knowing that there is FOMC news today there could be 2 possibilities 50% / 50%, if we go for a higher high and close we will continue to the upside, if we close below there could be a possibility of continuing to the downside. MOSTLY if in the next day we go for another lower low candle.

BTCUSDT WEEKLY IMPORTANT CHARTBTCUSDT 1W,
Do you see these two weekly resistances from above? They are very strong, mostly the $30,000 one. The thing is that the 30K one is very predictable by the majority of people, and if there's one thing that I have learned from trading is that you don't go with the majority, because they lose. We could see a pullback from the 30K but we might also see manipulation and a fake-out that will take us above the predicted level, which will make people greed and long more, once we reach the 31K weekly we go for a correction, let's see how it goes. We will keep you updated.

BTC TargetCOINBASE:BTCUSD
Check it out, all resists / supports in my Opinion (+from last Year).
Please help me out with Rep Points, i would like to use the Chat.
We will be on 30k, faster as you think we could :)

The price of Bitcoin has soared driven by market optimismLast Friday, Bitcoin fell to US 19,569. How desperate the market was at that time, and how enthusiastic it is now. In just one week, the Bitcoin market has undergone a shocking reversal, breaking through the previous high in one fell swoop and reaching above US 27,000.
In terms of daily structure, Bitcoin has broken the previous horizontal pressure level. At this stage, it is in a vacuum zone. Bitcoin price analysis has been slowly rising since the beginning of this week, and more buying pressure has been observed in the market. Pressure.As tokens are supported by strong buying pressure and good technical prospects, market sentiment remains optimistic, and the bullish momentum is expected to continue, with the next level of pressure around 30,000.
From the four-hour level, it can be seen that the last downward pullback was at the position of 0.382. Next, I think the possibility of constructing an equidistant ABCD is very large. As shown in the figure, Point D is far from being reached. The rise in the past two days has formed a complete breakthrough in the previous chip-intensive area. If there is a pullback in a short period of time, I think the pullback may as well be an opportunity to participate in long-term.
In order to facilitate everyone to continue to follow up on my analysis and sharing, you can like and follow me; in addition, I will share the daily real-time strategy in the channel. If you can't follow up in real time, you may make operational errors.You can use the following methods to enter my channel for free to follow the latest news and follow up on market trends in real time.

youre still earlyjust a more drawn out version of my other charts, wrote most of what you need to know on the chart. theres a slight possibility a recovery bounce occurs off the .236, but i highly doubt it.

BTC Long - 200 WMA#BTC
Every macro bull cycle on $BTC the past 10 years has been confirmed by a re-test of the 200 Weekly Moving Average (WMA) as support, confirming the beginning of the #BitcoinBull.
The 200 WMA is located at $25.5k.
#Bitcoin
-@CryptoCurb

Long Bitcoin for the cultureLong BTC here, pretty tight stop. Bearish patterns may start playing again and if so will calibrate, but for now looking for short squeeze here, under 200MA, deviation out of fallng wedge, falling out of larger diagonal trend line, head and shoulders pattern overshot target a little. Not advise, stops incase of flush.

BTCUSDT Buy Setup!BTCUSDT (1D Chart) Technical analysis
BTCUSDT (1D Chart) Currently trading at $18878
Buy level: Above $18800
Stop loss: Below $16100
TP1: $20500
TP2: $22800
TP3: $25000
TP4: $35000
Max Leverage 2x
Always keep Stop loss
Follow Our Tradingview Account for More Technical Analysis Updates, | Like, Share and Comment Your thoughts

Bitcoin BTC price analysis. Why you should be careful ?!The situation in the cryptocurrency market is interesting, as the whole world is watching with fear how American banks are "cracking" - the BTCUSDT price is growing rapidly, and these altcoins are trying to keep up.
We described our main scenario of BTCUSDT price movement and the calendar of "important events" until April 2023 here:
Today we want to share with you our "wave analysis" estimations.
The market is currently at a stage where there is a certain dissonance between the news background and price movements. Therefore, it should be clearly understood that now, and in principle always, we are trading "probabilities", the risks of which are controlled by stop orders!
The golden rule of trading: "The sooner you recognize your mistake, the less you will pay for it from your deposit."
Well:
We assume that the rapid growth of the BTCUSDT price requires correction. We assume that it is still possible for the BTC price to rise to $26790 today/tomorrow.
Then we can expect an equally rapid drop in the BTCUSD price, at least to $21000-21500. Accordingly, we will place the first pending orders to buy BTC and altcoins according to this assumption.
In our opinion, it is in the range of $21000-23000 that the trend of the crypto market price movement for April 2023 will be decided, but we will talk about this in our next ideas.
We are ready for a constructive discussion on wave analysis and the prospects of the crypto market in the comments below the idea. After all, it is in the discussion that the truth is born.
_____________________
Did you like our analysis? Leave a comment, like, and follow to get more

Choose your Freedom- Just for Sharing
- Not a Trade setup.
- Need more confirmations to accept this trend.
-- Bitcoin is more than the speculative numbers that most of peoples see in it.
-- "For the people.By the people".
-- Choose your Freedom and your path.
Non nobis solum, sed omnibus.
Happy Tr4Ding!

BITCOIN is back in its original uptrend state. Watch price grow!
BTCUSD is in its natural up trending spirit again. This was confirmed by noticing a relatively strong bullish reversal pattern within a stronger reversal pattern, the Inverted Head & Shoulders patters. this can be made clear buy utilizing the different variations of candles. The Candlesticks chart, the Line chart, as well as the area chart. Simple structure shows that a higher high was created and price retraced to the mighty 38.2% Fibonacci level, however it also re-tested that level with a second bullish engulfing pattern. After price confirms a break of the neckline then pulls back to re-test, this pair will provide excellent Long opportunities for immediate profits.

BTC RALLY DUMPBitcoin has formed RALLY DUMP scenario, expecting to see reversal soon which is already happening, I believe that the entries for shorts hasn't been picked fully yet, we need to go up in-order to grab more liquidity for shorts in-order to be able to have a chance to destroy the people who are trying to catch up in the market, for that we need to fill the entries of RALLY DUMP scenario around the price of 25384 - 26K, where we also have got a 0.618 Fibonacci. I believe that the first target would be around 24455, the second Target would be around 22500 - 22189 where we will be placing longs from there.

Hasbullas Fomoing on Bitcoin!Pump it then dump itBitcoin on 15minutes doing a symmetrical triangle which indicates a continuation to downside
Liquidation to the upside is more than 24 Million so its possible we test 27.4 (Close to bottom of the 27 to 28 gap )
SPX consolidated and the banking failure is yet to unfold

BTCUSDTBITCOIN UPDATE ACCORDING TO OUR ANALYSE BITCOIN IS GOING WHERE WE ANALYSE
Friends, the advantage of waves is that you can use them on any time frame 🙆
⠀
Patterns form in any market and any TF. You just need to decide where you feel most comfortable working. My thoughts below 👇
⠀
🔴 15min - 1H takes a lot of time and engagement, it's tiring and leads to mistakes. Traders use high margin and often lose money + leverage.
⠀
🟡 1W - 1M is a very long time, it is more suitable for investors, and it requires a lot of capital. The patterns are clear and strong.
⠀
🟢 From experience I realized that my choice is 4H - 1D. No need to spend all day on charts, good work/life balance, good market movements, patterns are well distinguishable. It requires patience, which most traders do not have. It takes you to the next level if you have the discipline.
⠀
🚥 If 4H - 1D is for you, let's trade together!

Bitcoin BTC price analysis. The situation around SVB and USDCAt the end of last week, we published an idea for a calendar of events that could affect price movements on the crypto market in one way or another. Check it out, there is still a lot to come:
But besides that, the weekend was very active because of the bankruptcy of Silicon Valley Bank, one of the top 20 banks in the United States, and was closely connected to startups and the crypto world.
The most interesting thing about the situation around Silicon Valley Bank and USDC:
The top manager of Silicon Valley Bank turned out to be a former employee of Lehman Brothers (the bank whose bankruptcy started the 2008-2009 crisis, let it be a coincidence)
Joe Biden personally promised to bring those responsible for the bankruptcy of Silicon Valley Bank and Signature Bank to justice.
The Fed and the US Treasury Department launched an emergency deposit support program for Signature Bank and Silicon Valley Bank, using the Fed's emergency lending authorization.
According to the government's program, all deposits will be fully available.
Liquidity Group, an asset manager and technical lender, plans to provide emergency loans of about $3 billion to companies affected by the collapse of Silicon Valley Bank.
Circle has launched automatic USDC printing and redemption for customers through Cross River Bank, USDC reserve exposure of $3.3 billion has been removed, and the dollar peg is being restored. Circle issued 408 million USDC today, the largest "mint" in the last 7 days.
Circle's CEO said that the company will transfer the remaining money to BNY Mellon.
The peg of USDC, DAI, and other stablecoins to the dollar has almost recovered, but everyone is waiting to see if they will include a full conversion of USDC to dollars - if not, the panic will continue and will definitely affect the entire industry.
It is also "lucky" that such a mishap with a major bank occurred at a time when the Fed is "firmly in control" of the financial world and steering it in the "right" direction, in their opinion.
To summarize, it is now clear that nothing is clear)
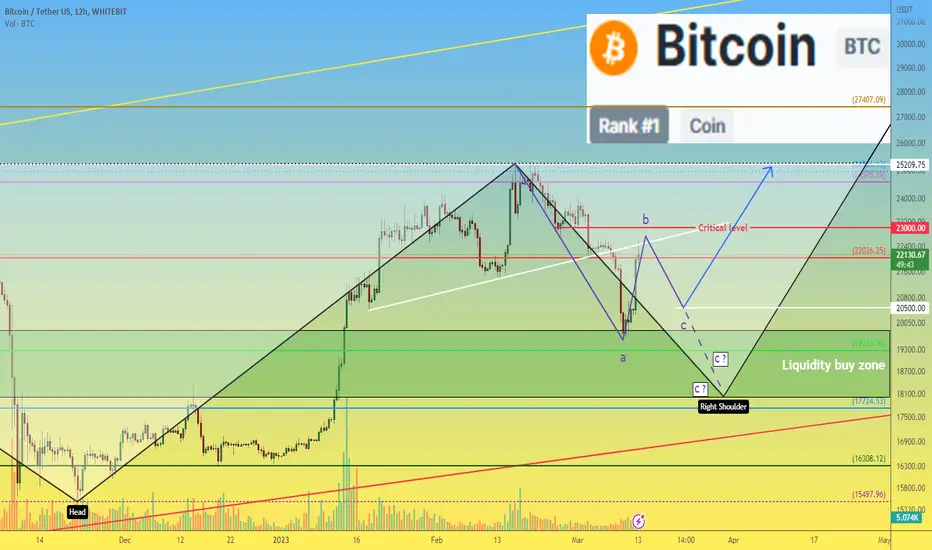
If we analyze the BTCUSDT price, we see that it has only slightly entered the liquidity buying zone. The current corrective bounce upward seems to be strong, but on the other hand, it fits the concept of a "correctional wave B"
As long as the BTC price is below the critical level of $23,000 , the main vector of our thoughts is aimed at the fact that the fall will continue in wave C.
What will wave C be like ?: either a short one around $20500 or an extended one around $19250, or even closer to $18000, time will tell.
Personally, we are not in a hurry to get longs "right away" with our entire deposit. As we wrote in our previous ideas, we have set a wide range of $18000-19800 for ourselves, where we place buy orders "with a grid". Our goal is to slowly build a balanced medium- and long-term investment portfolio with a tasty average purchase price for crypto assets.
_____________________
Did you like our analysis? Leave a comment, like, and follow to get more
BITCOIN IS BEARISH, BEWARE OF THAT!BTCUSDT 1D,
Bitcoin is currently forming a rounding bottom pattern on the 12HR Timeframe, I still believe that we might be heading to retest the 0.618 Fibonacci retracement that we have formed since the January Febuary pump.

Does BTC engulf its rise?hey guys, there's a short-term resistance (not that powerful but noticeable) you should care about.
so from now on, before breaking it, its not safe to open long positions.

➕Positive➕ and ➖Negative➖ signs of Bitcoin🤓Hi everyone.👋
Today I want to share with you a complete analysis of Bitcoin.
When we talk about the complete analysis, then we have to deal with the fundamental analysis of Bitcoin in addition to the technical analysis.
----------------------------------------------------------------------------------------------------------------------------------------------------------------------------------------------
Fundamental ;
So let's start by reviewing the news that has affected Bitcoin and the cryptocurrency market in the last 24 hours.
I must say from the beginning that all the news in the last 24 hours has been ➖negative➖.
Don't judge too soon and stay with me until the end of this post. Thank you.🙏🌹
The ➖negative➖ news of the last 24 hours are:
Bitcoin fell below $20,000 after 2 months, and after 56 days the Fear and Greed index re-entered the Fear zone.
In the 2024 US budget, Joe Biden's government has proposed a 30% tax on the electricity used to mine Bitcoin and other cryptocurrencies.
New York's attorney general General Letitia James on Friday sued crypto exchange KuCoin for failing to register with the state before letting investors buy and sell cryptocurrencies on its platform, as part of her effort to rein in what she calls "shadowy" cryptocurrency companies
The Hedera platform suspended all its activities after confirming the hacker attack.
Blockchain.com suspends its asset management subsidiary launched in April.
Huobi’s HT Token Suddenly Falls 93%, Then Rebounds Just as Quickly.
It seems that the results of all these negative news in the last 24 hours have been applied to the Bitcoin chart, and I expect Bitcoin to rebound from its current price and complete its pullback to the support zone.
Now that we talk about the support zone, it is better to go to the technical analysis and see what results we get.
Stay with me in this section.👍
----------------------------------------------------------------------------------------------------------------------------------------------------------------------------------------------
Technical :
Regarding technical analysis, let's take a look at the ➖negative➖ and ➕positive➕ signs in the chart.
➖ Negative signs ➖:
Sell signal by 50-SMA and 50-EMA.
Loss of 🟢support zone($21,600-$20,940)🟢.
Completion of 5 impulse bitcoin waves at $25,250.
➕ Positive signs ➕:
Bitcoin is moving in price Reversal Zone(PRZ).
Bitcoin has reacted positively to the 200_SMA.
The fall of Bitcoin to the import support line can act as a pullback to this line.
----------------------------------------------------------------------------------------------------------------------------------------------------------------------------------------------
Conclusion :
According to the explanations I gave in the fundamental and technical sections, I expect Bitcoin to grow to at least the lost support area and complete a pullback to this area before starting to fall again.
The best area to finish the decline can be the intersection of the important support line and the uptrend line, which is the intersection of the 🟢heavy support zone($18,700-$17,810)🟢.
----------------------------------------------------------------------------------------------------------------------------------------------------------------------------------------------
Do not forget to put Stop loss for your positions (For every position you want to open).
Please follow your strategy, this is just my idea, and I will gladly see your ideas in this post.
Please do not forget the ✅' like '✅ button 🙏😊 & Share it with your friends; thanks, and Trade safe

BTC Weekly SellIf you are using a price efficiency trading model and are seeing weekly sell-offs entering the market, it may be a good time to consider selling some of your Bitcoin holdings to take advantage of the current market conditions and potentially maximize your profits.
Also ooking at the weekly RSI for confluence.

MY IDEAMY IDEA
ORANGE IS TREND,SUPPORT,LONGTERM LINE
halving would impact the price
but not as it did before
the next bull run wont go over 100k

BTC consolidation confirmed !every detail is on the chart. the only viable behavior is the one depicted on the chart. any other pump or dump is out of prediction.
note that in many altcoins, we are in a Fibonacci support area, so be careful with short positions before breaking those spots. however totally the market is bearish and you should give more credit to your short positions.
the first spot for great support is 19K to 20K. use less short positions as you get closer to this area.
please feel free to leave comments and questions below.
