#BTCUSD - Drop back to 18.5k seems likelyWith a fresh Sell signal from Crypto Tipster v2 on #BITCOIN and a strong descending trend line to push the price downwards, we can see 18.5k coming very soon.
The real question is How Much Lower Will it Go? If at all..
_________
What Do You Think?
If you enjoyed or agree with this idea - drop us a comment, like & follow! 😀
Ideas by theCrypster meet the guidance notes and disclaimer as mentioned below and within our website. See Signature for more info! ✌️
🔥🔥🔥
Crypto Tipster v2
theCrypster
🔥🔥🔥
Bitcoinusd

Sell BTCTriggle Price: 22510-22530
SL: 22650-22700, About 150-200$
TP: 21250-21100, About 1300-1500$
Short term Trading, Great Profit/Loss ratio !!!

#BTCUSD - Is this the Start of the $30k Move?So, after a massive move upward at the start of the year, bagging us a very healthy 30%, we've had a little wobble with a losing Short trade and now we're looking at a potential Long up to the 30k mark.
If you enjoyed or agree with this idea - drop us a comment, like & follow! 😀
Ideas by theCrypster meet the guidance notes and disclaimer as mentioned below and within our website. See Signature for more info! ✌️
theCrypster

Bitcoin short-term update - BTC at $24,888 see ideas from Aug 22Bitcoin short-term update
(a) BTC overbought with perfect bounce at $24,888 - see my tweets from August last year👀
(b) correction to bearish target at around $23,455 would be healthy at all🐻
(c) next bullish target at $25,363🐂
Have a great day dear Crypto Nation😎
Let me know your thoughts in the comments🤗
⬇️⬇️⬇️
Likes and Follow for updates appreciated🤗
Disclaimer:
Not financial advice
Do your own research before investing
The content shared is for educational purposes only and is my personal opinion

BTC analyzeBINANCE:BTCUSDT
hi all
As you can see, it will be a downward trend until the 23200 range, and if it is supported in the 23200 range, we will have an upward trend.

KINGUSDT ChartCurrently forming Cup and Handle pattern, this coin has got low marketcap, good chance of pumping soon.

BTC/USDT Is comeback possible?BTC just bounced on bottom trend line for 3rd time and apparently it is retreating quite strong. Of course, breaking trendline and dip even further is possible, but is bullish triangle comeback is possible? If bulls pull this off, it could be really huge for crypto market. Wish you the best!

Why Fetch.ai Token is the Future of Decentralized AI NetworksFetch.ai is a decentralized blockchain network that is designed to enable autonomous economic agents and smart contracts powered by artificial intelligence. The platform offers numerous benefits, including scalability, energy efficiency, interoperability, and a customizable programming language. Fetch.ai's AI-powered smart contracts can automate complex tasks and processes, making it a useful platform for a wide range of applications, from supply chain management to transportation and finance. The network's native FET token is used to incentivize participants and reward them for contributing to the platform. Overall, Fetch.ai offers a unique and innovative solution for those looking to leverage the benefits of blockchain and AI technologies.

AGIX Token: The Future of AI-Powered BlockchainAGIX Token is a promising cryptocurrency with a unique value proposition at the intersection of AI and blockchain.

FETCH.AI/USDTFetch.ai is a decentralized blockchain network that uses artificial intelligence to power its smart contracts and enable autonomous economic agents to operate on its platform. Here are 10 key characteristics of Fetch.ai:
Decentralized: Fetch.ai is a decentralized network, meaning that there is no central authority controlling it.
AI-powered: Fetch.ai uses artificial intelligence (AI) to enable smart contracts and autonomous economic agents to operate on its platform.
Scalable: Fetch.ai is designed to be highly scalable, able to handle a large number of transactions per second.
Secure: The network uses advanced cryptography to secure transactions and prevent unauthorized access.
Energy-efficient: Fetch.ai uses a proof-of-stake consensus algorithm, which is more energy-efficient than traditional proof-of-work algorithms.
Interoperable: The network is designed to be interoperable with other blockchains, allowing for seamless integration with other decentralized applications (dApps).
Programmable: Fetch.ai allows developers to create custom smart contracts using its programming language, making it highly flexible and customizable.
Token economy: The Fetch.ai network uses its native FET token to incentivize network participants and reward them for contributing to the network.
Use cases: Fetch.ai is designed for a wide range of use cases, including supply chain management, finance, transportation, and healthcare.
Community-driven: The Fetch.ai project is driven by a passionate and active community of developers, researchers, and enthusiasts who are committed to building a better, more decentralized future.

#BTCUSDT Very Important Update.Welcome to this extensive analysis everyone.
We have been nailing every single Bitcoin Update this year.
Hope you are following me on all our social platforms.
Now, let's get to the chart!
Bitcoin is currently trading right below the 200 WMA.
This weekly closed right below it.
Probably you have seen this chart before but I just want you to understand that this is very important for BTC to break and close above this MA.
It has always been the Bear Market bottom indicator and currently, it's the resistance we need to break through.
If BTC wants to start the rally, It should break in in Q1 of 2023.
We just have a month left for that.
Meaning 4 more candles.
Unless that happens I won't be doing too much leverage trading and stay mostly in BTC and Stables.
Lower Support lies between $19.8k and $20.3k.
MY NEXT UPDATE WILL BE ABOUT TEH ALTCOINS.
Make sure you follow me to avoid missing the same!
What's your plan?
Have you decided yet?
Let me know in the comment section.
Also, Do hit the like button if you like it.
Thank you.
#PEACE

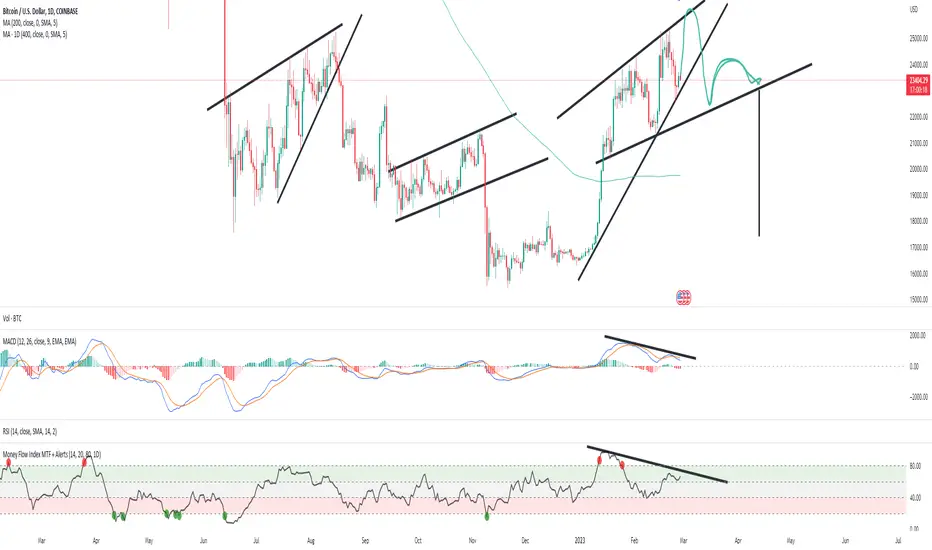
Bitcoin Free Fall Starting Mid MarchMultiple negative divergences are seen here on daily.
-Ascending Wedge
-Broadening ascending wedge
-MACD Negative Divergence
-Money Flow Negative Divergence
I have a downside initial target at 17.5K -- I have to see from there where the market goes. If inflation is not under control by May / June, and the terminal rate nears 6-7 percent, Bitcoin will go into full-blown capitulation. Be careful if you are a long-term investor. I would sell everything at 25-26 on the next rally.
Massive Bitcoin Dump IncomingPotentially one last rally to 26K to stop out all the shorts at 25K, and then a dump back to 17K is highly likely here.

BTC Eliott Wave Corrective Pattern🚨⚠️BTC ALERT, IMPORTANT CHART 12HR,
Currently forming an Eliott Wave Corrective Pattern! (A) = 21,000 / (B) 23,600 / (C) 18000.

Bitcoin - the market maker planHello, everyone!
Today I have the very interesting idea how I understand the market maker plan to maximize liquidity collection on BTC.
Let's take a look at the BINANCE:BTCUSDT chart 12h time frame. We have already seen the strong bearish divergence on almost all time frames and as you know I have been sitting in short trade from the top. But today I closed short because there are too many bears occured. Therefore I understood that market can prepare the trap for us.
First of all let's notice trendline support. It's a good place to open long, isn't it? Many traders is going to do it, but I consider market maker will not allow them😁.
I think the price can show just the local lower low before the new pump. The trend on local time frame has been already broken (see my previous post). I opened long trade if price hit my SL will re-enter. I expect the pump to the trendline resistance and even a little bit higher. Look at the equal highs at $25200. This is magnet zone now to collect this liquidity.
I want you to notice that in this case price is gonna form the double bearish divergnece with Awesome oscillator. It is the super strong reversal sign. When the Bitcoin price will reach the support again, a lot of retailers are going to enter long, but market maker liquidate them all with huge crash.
Well these are my thoughts, like👍 this article if it deserves .

Bitcoin Small Upside Retrace Then DownBitcoin\1H After a V shape recovery (Performing a stop/loss hunt) we could retrace up around 24190 with a wick up to 24.4 and then continues down to around 20K where is a CME GAP
Please Follow,Boost,Comment if you find it informative.
Thanks for watching

BTCUSDDue to the growth in the inflation indices of the United States and the European Union. We expect the continuation of the risk aversion sentiment in the coming week
Therefore, the possibility of a downward scenario is more likely

Bitcoin Consolidating to go Lower AGAINBitcoin/1H Doing another Pennant
We are also in a down trend channel that I draw which everytime it reaches the end of the channel it makes a move.
Worth noticing when SPX was consolidating btc went to 25K now that spx started to move down btc coming down with it.
We could perform a fake pump and grab some liquidity before further downside.bearish momentun is just starting and we yet have to see bigger red candles ~13%
Please Follow,Comment,Boost if you find it informative.
Thanks for watching

Bitcoin Dump IncomingMultiple negative divergences on RSI and MACD. Ascending and broadening ascending wedges seen on daily...not looking good...keep an eye on the 19200 area.

$BTC - New ATH in 2024 - PARABOLIC MOVE$47k in June then retest $35k in Nov and then New ATH in 2024!
This is another possibility but not convinced due to oversold indicators!
The one which is convincing linked in Related Ideas
However, New ATH in 2024 is confirmed. Load up our favorite bags & BANG the BULL RUN

The Magic of Fibonacci- Remember this older chart ( December 18 - 2022 ):
- Please feel free to check it to understand the new one 👇👇
- BTC Finalized his movement at exactly 161.8% Fibo.
- BTC did what it had to do at the perfection of the Fibonacci Law.
- when the FUDs and Bad News not influence the trend.
- No need any Magic Ball, we just have to follow the beauty of Fibonacci.
- Everything is in Graph, this is a bit advanced trading.
- This is one of the core's method of big hands Trade ( with Volumes ).
- Feel free to DYOR about Fibonacci extensions and Retracements and learn about it.
-- The more that you read, the more things you will know!
Happy Tr4Ding !

Bitcoin Analyze (30-minute Time Frame,02/23/2023)!!!Bitcoin seems to be forming a descending channel, and to complete this channel; it needs to complete its zigzag(ABC/5-3-5) correction.
As a result, I expect microwave B of this zigzag correction to end on the middle line of the descending channel and Fibonacci levels, and then Bitcoin will start to rise to the PRZ(Price Reversal Zone).
❗️ Note ❗️: if Bitcoin goes over $25340, the scenario will change.
Bitcoin Analyze ( BTCUSDT ), 30-minute time frame ⏰.
Do not forget to put Stop loss for your positions (For every position that you want to open).
Please follow your strategy, this is just my Idea, and I will be glad to see your ideas in this post.
Please do not forget the ✅' like '✅ button 🙏😊 & Share it with your friends; thanks, and Trade safe.

Bitcoin to stall at current highs?Bitcoin - 24h expiry - We look to Sell at 25149 (stop at 25674)
Although the bulls are in control, the stalling positive momentum indicates a turnaround is possible.
Bespoke resistance is located at 25200.
25200 has been pivotal.
Resistance could prove difficult to breakdown.
We look for a temporary move higher.
Preferred trade is to sell into rallies.
Our profit targets will be 23849 and 23649
Resistance: 24200 / 24500 / 25000
Support: 23800 / 23500 / 23000
Please be advised that the information presented on TradingView is provided to Vantage (‘Vantage Global Limited’, ‘we’) by a third-party provider (‘Signal Centre’). Please be reminded that you are solely responsible for the trading decisions on your account. There is a very high degree of risk involved in trading. Any information and/or content is intended entirely for research, educational and informational purposes only and does not constitute investment or consultation advice or investment strategy. The information is not tailored to the investment needs of any specific person and therefore does not involve a consideration of any of the investment objectives, financial situation or needs of any viewer that may receive it. Kindly also note that past performance is not a reliable indicator of future results. Actual results may differ materially from those anticipated in forward-looking or past performance statements. We assume no liability as to the accuracy or completeness of any of the information and/or content provided herein and the Company cannot be held responsible for any omission, mistake nor for any loss or damage including without limitation to any loss of profit which may arise from reliance on any information supplied by Signal Centre.

Bitcoin is facing Heavy ResistanceBitcoin is facing heavy resistance which is coming from two sources:
One is the horizontal resistance of 24 to 25k, and the other is the 200 weekly moving average. This means that there is confluence on the resistance side. Not only are we facing resistance, but this uptrend is already lasting for 53 days, making it likely its time for a correction.
Why is this 200 moving average also included? Normally I woudn't pay much attention to moving averages in general, but this one can be special.
In the bull run of 2015 to end 2017, this line was the support line for the whole bull market. This line was also support at the bottom of december 2018 and during the covid crash, making it strong resistance.
