BTC/USD CAUTIONHello fellow traders,
just wanted to share while the momentum has shifted prices higher for some time now.
The RSI however is showing that the positive price action is running out of steam. In my opinion, I suspect a pullback to 20K (roughly) to confirm as support.
Weekly charts more or less convince us the Bull cycle has started (weekly macd cross, monthly stochostic cross) This is just stating nothing parabolic will likely happen anytime soon, but if anything a healthy stage for the market to prepare for the next bull cycle.
Bitcoinusd

Too early to say that Bitcoin has entered a bullish trend?Is it too early to say that Bitcoin has entered a bullish trend? The weekly timeframe suggests that the overall trend might no longer be bearish considering the current price of Bitcoin has broken the upper line of the downward trend line.
A factor that could prevent Bitcoin from moving higher is that it is approaching the 200 EMA period, which could be a strong resistance. Furthermore, there is a supply zone at around $24,300 that could pose a problem for the cryptocurrency's short-term upward trend.
The narrative on the daily chart is almost the same, with the only significant change for a bullish signal being the closure above the 200 EMA period. On the other hand, the RSI indicator is giving an overbought signal. Currently, Bitcoin is in a consolidation phase in the daily timeframe within the range of the Darvas box.

Bitcoin is about to destroy the longs!Hello, everyone!
Yesterday we had the long trade which brought us the very small profit. I closed the trade manually because price has broken down the low of the bearish reversal bar. You can find this moment in the previous idea’s update. Today we have the potential short trade setup with the very tight stop loss.
1h time frame of the BINANCE:BTCUSDT chart is showing us that the yestrday’s pump is likely has been ended. First of all, the Awesome Oscillator shows the decreasing momentum which means that bears took control in their paws. Also we have the fractal level at $22919 , if Bitcoin price will break this level I am going to execute the short trade with the stop loss at $23173 becuase the second up fractal is placed there. The profit target I chose randomly.
Using the classical technical analysis we can see the triangle pattern which has been broken to the downside. This is not reliable sign for me, but it’s also the bearish sign.
Best regards, Ivan
________________________________________________________________________________________________
If you like my trade ideas, please smash the boost button to stimulate me make more quality analytics!

BTCUSD - Broken Long-Term and Short-Term Trends on the Upside?BTCUSD has recently received a buy signal from Crypto Tipster v2 Indicator after breaking through two descending trend line levels. This could be seen as a bullish signal and suggests that the cryptocurrency may be entering an uptrend. With the recent break through of these levels, we're cautiously optimistic about BTCUSD's potential for further gains.
However, it is important to note that BTCUSD is currently facing a final consolidation level before reaching potential gains of 20%. This means that the cryptocurrency is experiencing a period of stability or a pause in the current trend. It's important to keep an eye on this final level and monitor market conditions to determine whether BTCUSD will be able to break through and reach gains of 20%.

Will Bitcoin give us this long trade opportunity?Hello, everyone!
Let’s continue our trading journey. Yesterday we had the successful short trade on Bitcoin, but tonight it gave us the early reversal signal, that’s why I decided to close the trade in solid profit and wait what the market will give us.
Let’s take a look at the 1h time frame BINANCE:BTCUSDT chart. We can see the bullish reversal bar at the very bottom. This is the simply the bullish hammer with the large angle with the Williams Alligator red line. This was the first valid signal that the downtrend is weakening right now. Moreover the BTC has already created the first fractal above the red line. If it will be able to overcome this level at $22998 we can use the long trade setup pointed out on the chart. In case of losing support at $22738 we can open the new short trade because the potential trend reversal is not valid anymore. Anyway we should not try to predict the future, just trade the current market situation.
Best regards, Ivan
________________________________________________________________________________________________
If you like my trade ideas, please smash the boost button to stimulate me make more quality analytics!

Bitcoin is forming the bull trap right now!Hello, everyone!
I hope you enjoyed my last two trades, it were extremely risky, but we took very nice profit. I have completely changed my mind about trading. As you know I have lost significant amount of money, shorting the market during current bull rally. It was the moment where I fully understood that market is unpredictable. That’s why I also revealed that Elliott waves are needed not for entering position and predicting the future, but for the verification if the market is in impulsive or corrective wave right now. I was too self-confident using waves and forgot about other Trading Chaos tools. Now I started to use them all.
We have 1h time frame of the BINANCE:BTCUSDT chart. The price hit exactly my target for the long trade and started local retracement. Now we can see that it has already formed two up fractals and one downfractals. It means that we have the fractal signals for both sides, long and short. Looking at the higher time frames we can notice the multiple bearish divergeneces. That’s why in my opinion the long trades now are risky. I will remind you, divergence is the greatest predictor that the wave 5 has been ended. It is not the signal, just caution.
What about potential trades? We have the key fractal level $23564 . If the price will break this level I am going to open short with the stop-loss above the second up fractal $23893 . take profit I am going to place at $22575 . But we have to watch out carefully the moment when price approaches the crossover of the trendline support and resistance, we can see the reaction from there.
If the signal will be activated it is going to be under the red line of the Williams Alligator indicator. It confirms the signal’s validity. Awesome Oscillator has also shown us the short signal, which enhanced our thoughts.
Best regards, Ivan
________________________________________________________________________________________________
If you like my trade ideas, please smash the boost button to stimulate me make more quality analytics!

Trading is Repeating- Not sure that we already finished Wave 1.
- What we know is : " BTC went straight up for 4 weeks ".
- the safest way for now if you missed the last bottom is to watch and wait.
- At one point TheKing have to retrace, so be patient.
- if BTC Retrace now :
- Set your Fibo to -61.8% Retracement, around 18,500$
- Charge bag at the good time.
- if BTC push more :
- Wait for a retrace and recalculate your -61.8%.
- Keep it easy and Stay Safe!
Happy Tr4Ding!

Bitcoin (BTC) forming bullish BAT for another price reversalHi dear friends, hope you are well and welcome to the new trade setup of Bitcoin (BTC)
In the previous trade setup, after a lot of sideways move, finally Bitcoin rallied more than 43%.
Now on a 2-hr time frame, BTC is about to complete the final leg of a bullish BAT move.
Note: Above idea is for educational purpose only. It is advised to diversify and strictly follow the stop loss, and don't get stuck with trade

#BTC Game of Bullish and Bearish Deviations..#BTC has been trading inside this channel for the last week.
Only a breakout will decide the trend.
All the marked deviations are merely a filtration process before the next leg.
But it's crucial for BTC to break the $23k level by this week.
Else the trend will weaken if it gets rejected again and again.
Keep an eye, better not be emotional.
IMHO, Wait for the breakout in HTF, You can't be bullish or bearish in a sideways trend.
You will only lose money trying to trade the sideways market.
DYOR, Not financial advice.
Do show your support with your likes and share your ideas in the comments.?
Thank you
#PEACE


The Bull market for Bitcoin has been confirmedI am so overwhelmingly optimistic that I incessantly evaluate my emotions to ensure that my viewpoint is not erroneous. But how unrealistic is this when #Bitcoin is on the verge of closing its weekly candle at this current price level? We have breached the triangle and the 0.382 Fibonacci level. In recent days, Bitcoin has also established support at the 0.382 Fib level. Bollinger Bands are contracting, indicating an imminent explosive breakout. In my opinion, we can begin preparing to revisit the $35,000 price level in the upcoming weeks. That is the next resistance point, specifically the 0.236 Fib retracement.
Furthermore, the outlook on the monthly timeframe is highly favorable, which is in the process of closing within the next few days.
Wishing you all a thriving bull market, my fellow Bitcoiners.
Bull confirmed.

Bitcoin – my intraday trade revealed!Hello, everyone!
The mid-term analysis for the Bitcoin remains the same, I expect the correction to $20500, but it does not mean that we can’t use the intraday trading opportunities. I expect the last leg up and am going to explain you why.
On the 4h time frame BINANCE:BTCUSDT chart we can notice that the price is still above the Williams Alligator indicator, it means that the overall bias is still the bullish. Moreover we have the clear signal – the green dot under the candle. This is my hand made indicator which make it easy to reveal the Awesome Oscillator long signal. If the price will break the high of this candle it confirms the bullishness.
We have to buy only at the breakout, therefore I placed the conditional buy order at $23103 . This is not only one argument, this signal is located above the red line of Alligator. Moreover on the 1h time frame there is a up fractal, which is also the key level, which breakout could bring the price at least to $24k , but after that the anticipated dump is about to happen.
Best regards, Ivan
________________________________________________________________________________________________
If you like my trade ideas, please smash the boost button to stimulate me make more quality analytics!

Bitcoin is about to explode!Hello, everyone!
I hope you like my new analysis format with my intraday trades. Yesterday’s trade is still actual, but if you missed, you can use this one because it has much better risk to reward.
On the 1h time frame BINANCE:BTCUSDT chart we can notice that the price is fluctuating around the teeth of the Williams Alligator indicator. It means that the market is about to explode an show us the impulse. Now we have the clear fractal signal if the price will break $23053 it can reach much higher levels. This breakout is going to be the trigger for bulls.
Moreover we have the trendline resistance above and I suppose the Bitcoin should break this level to show us the higher high before the dump. Awesome Oscillator now is aslo gaining the strength, crossed above the Moving Average. It means that the momentum is rising. Very important we have to wait for the $23053 breakout to jump into long trade. The stop-loss should be placed just under the second down fractal at $22838 .
Best regards, Ivan
________________________________________________________________________________________________
If you like my trade ideas, please smash the boost button to stimulate me make more quality analytics!

Final buy zone is comingDon't get greedy and just buy.
you can start buying for 50 percent altcoins and 50 percent ETH and BTC
warning:
this time, the uptrend is going to start too slowly, but it will be very sustainable. buckle up :))

Next Bitcoin movesBitcoin broke out of the low 20K resistances and is approaching 25K. 20.5K is now acting as possible support.
If Bitcoin comes down, it will have support at 20.5K and 16.5K. Both these areas are good enough to enter a long position. Lower time frames - minutes and hour - will confirm when it is nearing.
Long position 1:
I will gladly enter a long position at 20.5K with StopLoss at 20.3K. Take Profits at 21-22K, letting some run while upping SL area. A loss of 20K could see BTC going to 18 or even support levels below that.
Long position 2:
I will enter a long position at 15.5K and 16,5K. Both should be huge support. I will take some profits along the way and letting some run for the long run. Any BTC at 16K ish is worth it for the long run imo.
Short Position 1:
BTC reaching 25K warrants a short. Looking for lower time frames action to see how BTC reacts.
Short position 2:
If BTC goes through 25K and maybe even retests and bounces, it could rocket quickly to 30K. A short at 30K seems good, again check lower time frames. If BTC is hot, taking profits quickly. Even though BTC could go through both 25K and 30K, it should drop at both prices first time it hits, so a short at both places would be logical.
Short position 3:
BTC could go fast from 30K-40K as most people will buy at low 30K and not sell until at least 40K. Shorting at 30 for same reasons as the other shorts.
Drawings show some suggested moves where it will react at these aforementioned price-points. Though dems and other sick elites are trying to wreck our economy, I am bullish on Bitcoin in general/the long run.
Would love likes or comments, with ideas and other scenarios etc.

2019 bull run VS 2023BTC / USDT
hello all
This is a new fractal between 2019 bull run and 2023
lets talk about the similarities between both years:
1- Both are after bloody bear market years 2018 and 2022
2- major downtrend line breakout
3- 200 1D moving average breakout
4- strong reactions from bulls after period of capitulation
well I don't think it will be an identical movement
but If BTC followed 2019 fractal then our target should be something near 50K (0.786 Fb resistance)
Appreciate your support by likes and follow
any questions or ideas please post it in comment section below

💥 BTCUSD 4H-TIMEFRAME ANALYSIS💥 BTCUSD 4H-TIMEFRAME ANALYSIS
💗Hello ladies and gentlemen
This is my new idea for 💥BTCUSDT BTCBUSD
I hope my idea is clear
Support me by like and share thank you
Stay Safe💯💲💲💲
Good luck💰😍
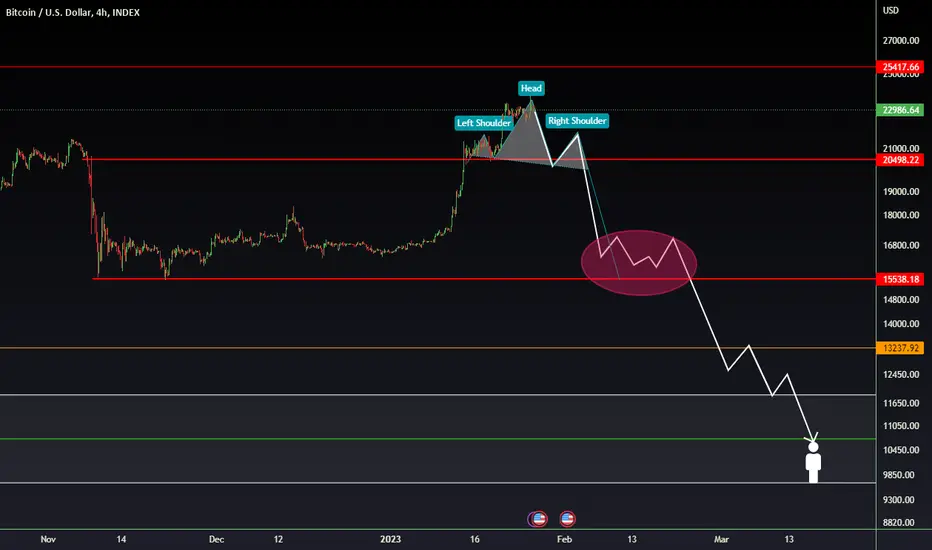
Bitcoin is on the edge of collapse!Hello, everyone!
Yes, this is just the bright heading, of course collapse on the Bitcoin will not be in February 2023. Now I anticipate just a correction to allow us to enter the long trade.
On the 4h BTCUSDT chart we can see a lot of bearish signals and if it will continue climbing it would be really weird. The most bearish factor is the double bearish divergence on the Relative Strength Index RSI. We could choose any oscillator and all of them are showing the same. Divergence is the sign of the completion of the wave 5 and BTC should show us the correction soon.
Another one important thing is the trendline support breakdown. I am not keen on trendlines, but this time it looks valid. Moreover the price was unable to reach the trendline resistance and bears took control before. The combination of these factors is enough for me to make the bearish forecast for the next week.
In general, I suppose bullish rally is not over and we have to see another one leg up above $25k before the true collapse. The potential buy zone is still $20500 , there we have to watch out carefully on long trade setups.
Best regards, Ivan
________________________________________________________________________________________________
If you like my trade ideas, please smash the boost button to stimulate me make more quality analytics!

BTC - Wait to buy when Bitcoin goes to its last zoneThis has been my analysis for the past year and it's going just as planned.
The yellow line is the 1.618 extension of the overall bear move from the ATH. If you buy here, you are SET!

BTC Wave B has begun!We are just waiting on confirmation of a break and close over the previous LH ($25,200) to confirm a sign of strength/Quasimodo. This will also further validate the near term protected bottom of 15.5k and present a once a year opportunity to buy the bottom/open short term longs at the retest of $17,600. Keep in mind, this short term bull run is only a 3-3-3 corrective Wave B and will face a major level of resistance around $35,900. We can only speculate for now.

Bitcoin - Suspiciously Inviting With price divergences in the daily and hourly charts suggesting a correction of the rally is due, we see an interesting situation playing out with BTC in the weekly chart.
A critical support level exists at around $18.4k that, if broken below, eviscerates the bullish case for a continuation of the rally to a higher-high and instead, opens the doors to a new bear market low.
This is because we have an 5-3-5 Elliott Wave count so far from the $15.5k low, that could either be the conclusion of an ABC correction, or waves 1, 2 & 3 of a 5 wave impulse higher. The outcome is not resolved.
This gives rise to the potential for two very different scenarios as indicated in the chart at the top by the Bullish and Bearish Case labels.
What do you think? Is it all-in bullish or time for a pause to watch for a resolution?

BTCUSD WEEKLY HOLALYSISAs of the moment WHALES does its job to induce and liquidate most of retail trader. Everything is engineered. I don't think Bitcoin will break 25k-26k zone at the moment so my over all bias still BEARISH, if so happen to break that zone it a clear change of character from downtrend to an uptrend, definitely change my bias too into BULLISH.

Bitcoin – my next insane trade!Hello, everyone!
It’s time to forget about my failures which I made last couple of weeks and think about new trade ideas. Of course it’s extremely dangerous to buy Bitcoin right now becuase it shows us some sign of weakness.
We will use 4h time frame of BINANCE:BTCUSDT chart to count the waves inside the current cycle. The Awesome Oscillator is our main tool to understand the waves order. It’s maximum value corresponds to the wave 3 top. After that we saw the zero line crossover which is the sign that wave 4 has been finished. Now the BTCUSDT is printing the wave 5. I suppose it’s almost done. I expect the only one fake breakout to $23600 – $23800 price levels. Moreover the wave’s 5 target is located also next to this price value.
The overall uptrend is not finished, but I expect the correction where we can enter the BTC long trade. The target area for the potential dip is $20500 because the wave’s 4 end of lower degree is located here.
Best regards, Ivan
________________________________________________________________________________________________
If you like my trade ideas, please smash the boost button to stimulate me make more quality analytics!
