Drawing Bitcoin- Not a price speculation.
- Not a bottom Confirmation.
- No need to speak too much because everything is on chart.
- Understand this analysis.
- Zoom in / Zoom out.
- Follow the Lines and Circles.
- Look for potentials breakout zones.
- Aberrations are frequent in a turbulent market.
- Supports always turn to be Resistances and vice versa.
Happy Tr4Ding !
Bitcoinusd

Elliot showing good signsAnother update on $BTC/$USDT coming into this you can expect either a rise to mid $23k or jiggle and go upward of $24.5k and or in those times drop down and potentially hit lows of $19k~ in most likely March April. Not advice finacial or otherwise! Feel free to discuss!

Bitcoin – last pump before correction!Hello, everyone!
Making many mistakes last couple of weeks I am not going to give up in learning how to trade using Trading Chaos by Bill Williams. I don’t know why, but I believe in this approach. I decided to switch to the 1h time frame to have more practice. Today I am going to show you my next trade.
Let’s take a look at the WHITEBIT:BTCUSDT chart. Looking at Awesome Oscillator we can conclude that the wave 3 has been finished and minimal requirement for the wave 4 end also has been met. I am going to catch the wave 5. Here we have the fractal signal at $22974 . If the Bitcoin price will cross this level it means that this trade become active. Here we have the clear stop-loss below the down fractal at $22637 . I am going to use this trade. Let’s see what happens.
Best regards, Ivan
________________________________________________________________________________________________
If you like my trade ideas, please smash the boost button to stimulate me make more quality analytics!

🟡 The Most Popular Myths About Bitcoin Debunked 🔑During the existence of bitcoin and other cryptocurrencies, a large number of erroneous judgments have appeared about them, which continue to spread among people even now. This leads to cryptocurrency being treated negatively, as the vast majority of myths about digital currencies are aimed at discrediting them.
In this article, we will look at the most popular of them and debunk them for good.
Bitcoin Can Be Hacked
Cryptocurrencies are created based on blockchain technology, which organizes a database consisting of a chain of blocks. Each successive block has information about previous blocks. Such a database is stored simultaneously on all computers of the system participants.
This technology is based on the principle of decentralization, that is, the database is not in one place, and all the computers participating in the system, form a network. To affect the network in any way, it is necessary to get 51% of its hash rate. Only then will it be possible to make changes to the transactions and impose their acceptance on a minority.
Bitcoin's computing power is distributed all over the world, and to try to take over the network, a large amount of hardware has to be combined. Still, mining companies will not destroy their source of income. And even if someone decides to attack the system, it will at most lead to failures, which will be eliminated with emergency updates.
However, cryptocurrency exchanges and other digital money services are vulnerable to hacking.
Bitcoin Is Not Backed By Anything
Back in 1971, the U.S. authorities abandoned the Bretton Woods system (the gold standard), and the U.S. dollar lost its peg to gold. Since then, the U.S. currency has not been specifically backed but is directly dependent on the country's financial stability.
To understand what bitcoin is secured with and how its price is formed, it is necessary to consider the value and functionality that the cryptocurrency presents to its owner:
Anonymity. No one monitors bitcoin transfers and has no right to influence (cancel or suspend) the transaction in any way;
Low commissions. In the network of the main cryptocurrency, there is a fixed commission for transfers, which is set based on the load on the network. It means that the commission will be the same if you transfer $100 and $100k, as well as any other amount;
Speed. Bitcoin transactions are usually instantaneous. Allowable delays range from a few minutes to one hour, depending on network load;
Limitlessness. You can transfer bitcoins anywhere in the world. The main thing is that the recipient has a cryptocurrency wallet.
Thus, bitcoin allows making anonymous payments and money transfers of any amount, regardless of the location of the sender and the recipient of the cryptocurrency. This factor, combined with bitcoin's limited issuance (21 million coins), determines the demand that subsequently forms the cryptocurrency's price.
Bitcoin Is Used Only By Criminals
The anonymity that cryptocurrencies give does allow the use of digital coins in illegal schemes. But, in this case, it is no different from cash, which is also used in illegal activities.
Last year, bitcoin began to be actively bought by large companies to protect against inflation and other risks of the traditional financial market. For example, the main cryptocurrency of $1.5 billion was purchased by Tesla. According to CEO Elon Musk, Tesla sold 10% of bitcoins at the end of March and recorded a profit.
The oldest U.S. banks, such as Morgan Stanley, Goldman Sachs, and JP Morgan, are also showing interest in cryptocurrencies. The latter is already preparing to launch its first actively managed bitcoin fund. Goldman Sachs will also make cryptocurrency investments available to clients.
Bitcoin Is A Bubble
Back in 2010, the price of bitcoin was less than $1, but now it is worth more than $23,000. Other cryptocurrencies have also seen their prices go up by hundreds or thousands of times. This gave reason to compare the cryptocurrency market with a bubble that will surely burst, and investors will be left with nothing.
First of all, let's understand what a bubble is. It is an economic cycle of trading an asset characterized by an unsustainable growth of its market value. One of the first examples of such a bubble was the rise in the price of tulips in the Netherlands in the 17th century. At that time, their value soared tenfold, and never recovered after the collapse. There was also the famous dot-com bubble at the beginning of the century. Back then, the value of Internet companies soared and collapsed dramatically in a short period of time.
Bitcoin and other cryptocurrencies have been around for more than a decade. During that time, they have gone through several cycles in which their value rose and fell. However, after all, previous falls, bitcoin has renewed its price records. Along with it, the entire cryptocurrency market grew.
As analysts explain, cryptocurrency fluctuations form a pattern typical of young markets. They expect assets to rise and fall with smaller fluctuations over time, and the time between these cycles will increase. That is, the cryptocurrency market will become more stable and predictable.
Buying Cryptocurrency Is Difficult
Many potential investors are deterred from buying crypto assets by their lack of experience. Since it is a new and technological tool, it may seem complicated. In fact, it is possible to invest through special exchanges, mobile applications, or other trading platforms. The registration procedure on them is usually no more complicated than, for example, creating an account on a social network or in an online store.
As a rule, the major exchangers ask to confirm the identity. To do this, it is necessary to upload a photo of the documents. This is a requirement of the world's regulators, which helps make exchanges more secure. However, those who value anonymity can also find exchanges where there are no such requirements.
The process of buying cryptocurrency itself is also simple. To do this, you can top up your account and use it to make purchases or pay with your card directly for each cryptocurrency purchase. In terms of complexity, this procedure can be compared to recharging a cell phone or buying goods.
One Needs A Lot Of Money To Buy Cryptocurrency
Most people learned about the existence of cryptocurrency when the price of bitcoin reached tens of thousands of dollars, which would seem to immediately cut off investors with a budget of a few hundred.
In fact, all services allow you to buy a share of bitcoin or another cryptocurrency. The minimum amount for which you can buy a cryptocurrency may vary from site to site, but usually, it's only a few hundred dollars.
If you buy a bitcoin or other cryptocurrency, you will earn on its growth, as well as those who operate with tens of thousands of dollars. If an asset doubles in value, for example, then the investments of everyone who holds it will also double. The same will happen if the crypto-asset becomes cheaper.
Only Pros Can Make Money With Cryptocurrency
There is a widespread belief that buying cryptocurrency is similar to trading on the forex market. They say you have to buy it when it goes down in price, sell it when it goes up in price, and so on in a circle. And in order to do that one has to understand its trends, news, and reasons for daily price changes.
Of course, that's how traders make money. However, most crypto investors are not actively trading. They only buy bitcoin or other tokens and wait for them to rise in price. This strategy is used by those who see the potential of cryptocurrencies in the long term. The superiority of this strategy is ease. You don't need to check the exchange rate every day and monitor the news.
Cryptocurrency Guarantees Anonymity
This myth arose because cryptocurrency allows for transactions outside of the banking system. There are also anonymous wallets, for the creation of which it is not necessary to enter any personal data.
At the same time, it should be taken into account that any transaction is recorded in the blockchain and saved forever. This means that if bitcoin has been in a wallet that is associated with criminal activity, no matter how much it is sent to other wallets, it cannot be "laundered". Law enforcement can access the blockchain data and track down the person who made the transactions. However, because this procedure is complicated, it is used only in special cases.
Everyone Who Buys Cryptocurrency Will Get Rich
There are a lot of stories about people who bought bitcoin when it was worth a few hundred and woke up rich a few years later. Similar cases occur with other coins that have increased in price tens or hundreds of times. However, this does not mean that everyone who buys cryptocurrency will certainly get rich.
Keep in mind that these are risky assets that can both rise and fall in value. In addition, their volatility is higher than that of stocks, real estate, or fiat currencies. Therefore, experts advise keeping 5% to 10% of their savings in crypto-assets.
Cryptocurrency Is A Vogue, And It Will Go Away Soon
A few decades ago, computers and e-mail were of interest only to a very limited number of technology enthusiasts. When Steve Jobs said that soon computers would be in every home, he was surprised to be asked, "what are they there for?".
The same thing is happening now with cryptocurrencies. So far, they have been used by a relatively limited number of people. But today's cryptocurrencies create ecosystems that, according to analysts, will continue to evolve, and there will be more and more practical applications for them.
There is growing interest in decentralized financial programs, which are safer, more reliable, and cheaper than the current systems. Tech giants are exploring ways to merge the real and digital worlds, using blockchain technology as a building block for this. States are thinking about creating their cryptocurrencies. So virtual assets, of course, will evolve and change but will remain with the technology on which they are based.
Conclusion
New tokens appear all the time and, quite possibly, some of them will increase in value hundreds of times. At the same time, some of them will depreciate or disappear altogether. Therefore, professionals advise diversifying your cryptocurrency portfolio: keep most of the funds in popular cryptocurrencies, such as bitcoin or Ethereum, and only part of the funds should be spent on new projects that seem promising. This will allow you to keep a balance between risk and reward.

BTC until next uptrendeverything is on the chart,
note that this is just an early speculation and is just for depicting what might be the behaviour of market in the next consolidation.
so it might not happen exactly the same, and prices can not be used as exact buy/sell points.
leave any comment to discuss further
take a look at previous idea on MATIC

Bitcoin - 1H rangeBreak out above and I see targets above being met, otherwise back down to sweep green if we break below current range.
Easy peasy lemon squeezy.


Bitcoin – you don’t believe in this scenario!Hello, everyone!
Last time I told you that the bear market on Bitcoin has been finished, but I am not so positive and don’t buy the significant amount of crypto. Today I found that probably I hurried up making this conclusion. I believe that this pump is not over, but market is preparing the huge trap for “tothemooners”.
Let’s take a look at the 1D time frame of the WHITEBIT:BTCUSDT chart. I finally reconsidered my Elliott wave formation. Global 4 still has not been finished. It is represented as a complex correction – almost untradable one, but one thing we shold take into account that the price will finally break down $15600 . This scenario now is in my favour.
Now the BTC is finishing wave C of this so called complex correction. What actions on the market I am going to take? I found that the price reached the 1.61 Fibonacci extension, which is the natural target for the wave 3. Now I am waiting for the local correction to 0.38-0.5 Fibonacci retracement at $19500 to open long trades with the target at the huge order block at $22400 . Also at $22400 I am going to double my losing short trade with the at least potential pullback from there.
Therefore, at $22400 I plan to have 12% of deposit in short trade to catch the final bearish impulse. Sorry, guys, that I have changed my mind again. I was so confused with this pump that cannot carefully analyze the price action. Now I have the plan how to eliminate the loss and receive the profit. Let’s see!
Best regards, Ivan
________________________________________________________________________________________________
If you like my trade ideas, please smash the boost button to stimulate me make more quality analytics!

Same old songNothing has been change, the bull trend is intact, just people taking profits and buying again

bitcoin update possible wave 4 or B Get stop Sell
Follow my updates daily by following my profile to help my portfolio grow, I'm starting and I'm working hard every day to put scenarios here :)
invite your friends to follow along

BTC Bitcoin BTCUSD Breakout Today 18-01-2023 18-jan BTC will breakout soon and may start running.
By : Forex Pharmacy

$BTCUSD Bitcoin $21k --> $9.5k --> $69k --> $111k --> $318k BTC Price Live Data
The live Bitcoin price today is $21,121.37 USD with a 24-hour trading volume of $22,306,086,579 USD. We update our BTC to USD price in real-time. Bitcoin is up 1.28% in the last 24 hours. The current CoinMarketCap ranking is #1, with a live market cap of $406,898,443,180 USD. It has a circulating supply of 19,264,775 BTC coins and a max. supply of 21,000,000 BTC coins.
What Is Bitcoin (BTC)?
Bitcoin is a decentralized cryptocurrency originally described in a 2008 whitepaper by a person, or group of people, using the alias Satoshi Nakamoto. It was launched soon after, in January 2009.
Bitcoin is a peer-to-peer online currency, meaning that all transactions happen directly between equal, independent network participants, without the need for any intermediary to permit or facilitate them. Bitcoin was created, according to Nakamoto’s own words, to allow “online payments to be sent directly from one party to another without going through a financial institution.”
Some concepts for a similar type of a decentralized electronic currency precede BTC, but Bitcoin holds the distinction of being the first-ever cryptocurrency to come into actual use.
Who Are the Founders of Bitcoin?
Bitcoin’s original inventor is known under a pseudonym, Satoshi Nakamoto. As of 2021, the true identity of the person — or organization — that is behind the alias remains unknown.
On October 31, 2008, Nakamoto published Bitcoin’s whitepaper, which described in detail how a peer-to-peer, online currency could be implemented. They proposed to use a decentralized ledger of transactions packaged in batches (called “blocks”) and secured by cryptographic algorithms — the whole system would later be dubbed “blockchain.”
Just two months later, on January 3, 2009, Nakamoto mined the first block on the Bitcoin network, known as the genesis block, thus launching the world’s first cryptocurrency. Bitcoin price was $0 when first introduced, and most Bitcoins were obtained via mining, which only required moderately powerful devices (e.g. PCs) and mining software. The first known Bitcoin commercial transaction occurred on May 22, 2010, when programmer Laszlo Hanyecz traded 10,000 Bitcoins for two pizzas. At Bitcoin price today in mid-September 2021, those pizzas would be worth an astonishing $478 million. This event is now known as “Bitcoin Pizza Day.” In July 2010, Bitcoin first started trading, with the Bitcoin price ranging from $0.0008 to $0.08 at that time.
However, while Nakamoto was the original inventor of Bitcoin, as well as the author of its very first implementation, he handed the network alert key and control of the code repository to Gavin Andresen, who later became lead developer at the Bitcoin Foundation. Over the years a large number of people have contributed to improving the cryptocurrency’s software by patching vulnerabilities and adding new features.
Bitcoin’s source code repository on GitHub lists more than 750 contributors, with some of the key ones being Wladimir J. van der Laan, Marco Falke, Pieter Wuille, Gavin Andresen, Jonas Schnelli and others.
What Makes Bitcoin Unique?
Bitcoin’s most unique advantage comes from the fact that it was the very first cryptocurrency to appear on the market.
It has managed to create a global community and give birth to an entirely new industry of millions of enthusiasts who create, invest in, trade and use Bitcoin and other cryptocurrencies in their everyday lives. The emergence of the first cryptocurrency has created a conceptual and technological basis that subsequently inspired the development of thousands of competing projects.
The entire cryptocurrency market — now worth more than $2 trillion — is based on the idea realized by Bitcoin: money that can be sent and received by anyone, anywhere in the world without reliance on trusted intermediaries, such as banks and financial services companies.
Thanks to its pioneering nature, BTC remains at the top of this energetic market after over a decade of existence. Even after Bitcoin has lost its undisputed dominance, it remains the largest cryptocurrency, with a market capitalization that surpassed the $1 trillion mark in 2021, after Bitcoin price hit an all-time high of $64,863.10 on April 14, 2021. This is owing in large part to growing institutional interest in Bitcoin, and the ubiquitousness of platforms that provide use-cases for BTC: wallets, exchanges, payment services, online games and more.

Bitcoin bull rally will continue!Hello, traders!
Bitcoin is showing us the strength, therefore I suppose the significant correction as I mentioned in my previous article will be later. Today I will show you the potential local trade to catch the potential trend continuation.
We will use the 1h time frame of the BTCUSDT chart. Here we can see the local consolidation, which has the higher highs and higher lows. Moreover BTC has created the upper liquidity trendline. It would be too easy if the market will continue pumping without any trick. I suppose that the deviation could be this trap for both sides on the market – bulls and bears.
On the trendline breakout market can create the fake out, we can see the hint on the RSI indicator which has the potential bearish divergence. I expect the pump to $21700 and the long squeeze after that. The potential short here is not a good idea becuase we have super strong bull market. The potential local correction could be ended at the Fibonacci golden pocket at $19900 . Here I am planning to open long with the stop loss below the local impulse beginning. Only this trade has the appropriate risk to reward.
Best regards, Ivan
________________________________________________________________________________________________
If you like my trade ideas, please smash the boost button to stimulate me make more quality analytics!

BITCOIN - A BEARISH/BULLISH SCENARIO ALL IN ONE -CryptoManiac101BITCOIN / USD TA
This is one of those scenarios which is extremely likely to occur at these levels, even if not to the same extent as on the chart, it is very likely to happen.
This is the point where we see a lot of crypto activity happening all over twitter and other social platforms. We see an increase in bullish and bearish charts all over, which means that there are a lot more people watching Bitcoin and the crypto sphere as a whole.
I would say that a time frame for this scenario to play out is around 2-3 month, with a bullish invalidation price points over $26,000 - otherwise we are still subject to seeing something like this, which by no means is a bad thing but it would extend the current 'accumulation' cycle by at least 4 month.

Bitcoin Big FAKE!I think it's a fake bullish scenario for bitcoin. After climbing up to $25500, I expect it to drop to $11854. I will wait for the level I marked for reception. It is not investment advice. Good luck

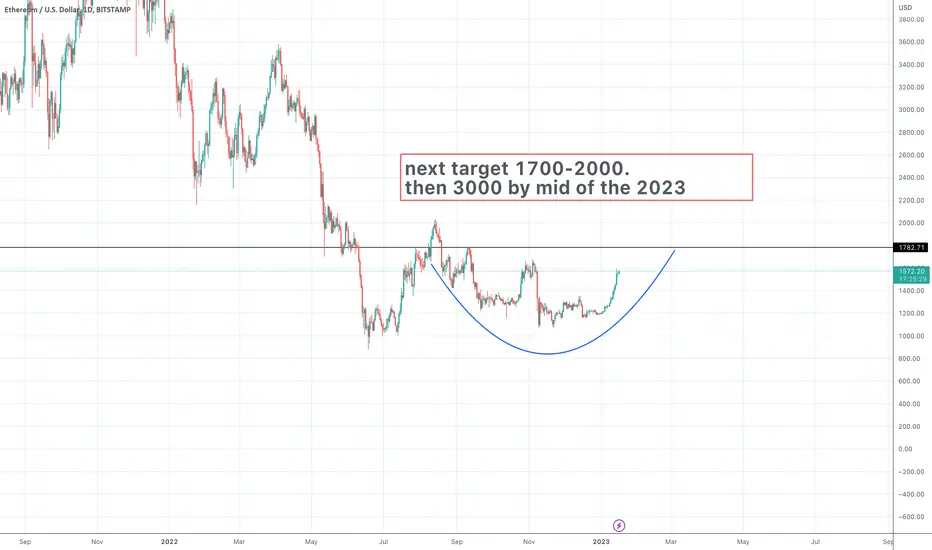
Ehtusd next target 3000Ethusd turning up.
slowly it wll hit 2000 then 3000 after some consolidation by mid of 2023