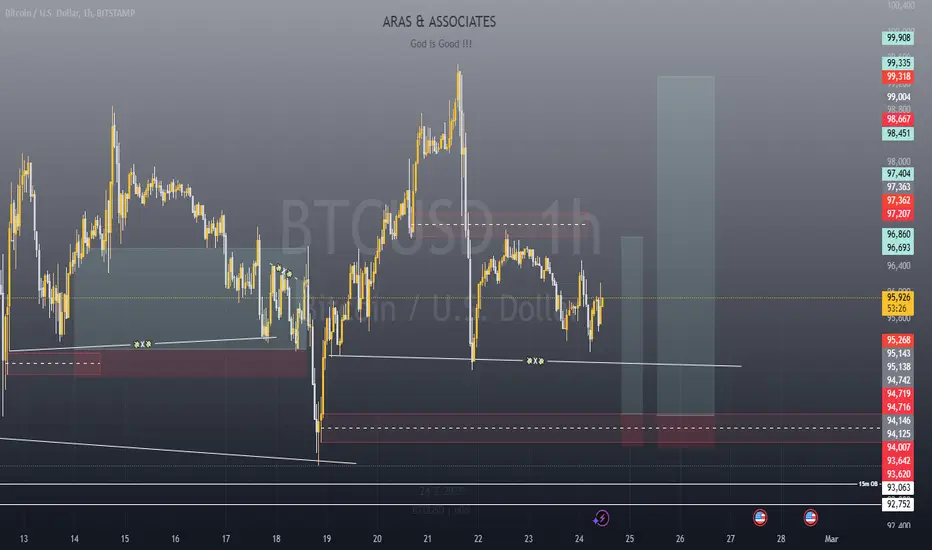
100K The Countdown Begins- We are so close.
- To every Bitcoin holder who has weathered the highs and lows, celebrated the peaks, and endured the troughs—remember, you are not just an investor.
- You are a believer in a decentralized future, a pioneer of financial sovereignty, and a guardian of the idea that true value transcends borders, governments, and time itself.
- Holding Bitcoin is not merely holding an asset; it’s holding a piece of the revolution that will shape generations to come.
Keep the faith, for the future belongs to those bold enough to believe in it.
Thank you to all my followers for constantly inspiring me to share more analyses. Your support means the world—love you all!
PS : This isn’t an analysis. it's a heartfelt congratulations!
Happy Tr4Ding !
Bitcoinusd
Bitcoin as Water. Will Bitcoin move towards less resistance?Hello,
The volume profile of this chart with 4-hour candles indicates two levels where high trading interest can be found. One of these levels is the orange level, $91.5k, around which Bitcoin built a strong support zone. The other level is the red line, $98.5k, where BTC has a strong sell zone. I expect the price action to unfold between these two zones. You may ask which would come next. The current price, $97.1k, is closer to the sell zone than the buy zone. Hitting the sell zone requires less effort than falling into the buy zone. A few people observed that the market often moves towards less resistance. This lesser resistance is now moving into the sell zone. Furthermore, MACD goes up like a bullish trend, which means technicals contribute to BTC hitting the sell zone next time. The white trendline on the chart can act as additional support, which means for BTC to fall into the buy zone, it has to cut down the white trendline. Again, the less resistance for the price would be not to cut down the support trendline, but to pump into the sell zone, which is open from the bottom up without additional resistance standing in the way.
Regards,
Ely
$BTC - Steeper correction if below $93500Hi guys! 👋🏻
🔔 Lacking momentum and liquidity and it's time for correction
🔔 I believe it's too early for $100K and time to get rest before the next run.
🔔 CRYPTOCAP:BTC couldn't get the $100K and with each try the daily close is lower than the previous one, which states that market might not be ready yet for a strong impulse.
🔔 The best scenario for #bitcoin would be to close below $93500 and go for a correction down to $80K, regain momentum and take over the $100K barrier.
🔔 Triangles could be tricky, so watch for a breakout before making any decisions.
✊🏻 Good luck with your trades! ✊🏻
If you like the idea hit the 👍🏻 button, follow me for more ideas.
BTC Rising Wedge with Possible Bullish BreakoutIm posting this idea because the formation the price action is making is a rising wedge. This shape has a bias toward breaking down and forming new lows. In this case, the 50 simple moving average has managed to stay above the 100 simple moving average and the price has managed to hold above the 50 simple moving average. RSI is only 48 at time of publishing on the H4 Chart.
I think BTC will break to the upside here and manage to print a price above 100k. Minimum target is 101,900 the 1.236 extension from previous High swing Low.
Not financial Advice, do your own DD.
Thanks for viewing the idea.
BTCUSD Bullrun: Is the Momentum Reaching Its Limit?BTCUSD's bullish rally has driven significant price appreciation, positively influencing the broader altcoin market. However, a closer look at the daily timeframe reveals critical resistance levels that may define the trend's next phase.
Since 2020, BTCUSD has traded within a well-defined ascending channel. At present, the price is testing the upper boundary of this channel, a key resistance level. A decisive breakout and sustained move above this resistance could signal the continuation of the bullrun, potentially unlocking further upside.
Conversely, if the resistance holds firm, the likelihood of a corrective move increases, with the next significant support level projected around $49.87K, aligning with key Fibonacci retracement levels. Traders should closely monitor price action, volume dynamics, and candlestick confirmations for further clarity.
Maintaining disciplined risk management is essential as BTCUSD navigates this critical inflection point in its broader bullish structure.
Bitcoin Analysis: Two Key Demand Zones for Potential Bounce
Bitcoin's price action currently hovers near critical areas of demand, suggesting two zones where buyers might step in to push prices higher. These zones represent areas of significant historical interest where demand has previously outweighed supply, potentially leading to a bounce:
Demand Zone 1 - Immediate Support:
This zone lies between $93,420 - $95,000 where Bitcoin recently found support during its last pullback. It aligns with a high-demand area on the chart, characterized by a cluster of previous rejections and consolidations. Buyers may look to defend this level as it coincides with key technical confluences, such as previous swing lows and trendline support.
Demand Zone 2 - Deeper Support Level:
The second demand zone is located between $91,850 - $90,800 marking a region where significant buying pressure previously triggered strong upward momentum. This zone is reinforced by a high-volume accumulation area and aligns with a critical Fibonacci retracement level. If the price dips to this region, it may attract long-term buyers aiming to capitalize on lower prices.
Key Considerations:
Price Reaction: Monitor how Bitcoin reacts as it approaches these zones; wicks and sharp rejections could signal strong demand.
Volume Confirmation: Increasing buy-side volume near these zones will validate the strength of the demand areas.
Risk Management: A sustained break below these zones may invalidate the bullish thesis, so stop-loss placement is crucial.
These demand zones serve as key levels to watch for potential reversals, offering strategic entry points for traders looking to capitalize on a possible Bitcoin bounce
If you're looking for the most accurate and reliable insights into Bitcoin's price action, my analysis is second to none. Follow my updates for consistent, actionable strategies that outperform the market.
Bitcoin Dominance Down and Alts PUMP!Bitcoin dominance or BTC.D has been on a rip for a while now but as we start to see more altcoins pump its fair to see the correlation of bitcoin dominance dropping. Sideways is also good, but if this looses the major support and starts to drop I expect to see further liquidity moving into altcoins at speed.
Now it could bounce back up and continue higher, which would indicate the move for bitcoins not nearly over. I am keeping lots of alt-positions, taking profit in part on pumps but leaving some moon bags for when BTC.D eventually drops and alts go wild.
NOT FINANCIAL ADVICE
Happy trading
Bitcoin's $92K Correction: A Deep Dive into the Real CulpritBitcoin, the world's largest cryptocurrency, has recently undergone a significant price correction, dipping below the crucial $92,000 level. While many analysts initially pointed fingers at the influx of Bitcoin Exchange-Traded Funds (ETFs) as the primary catalyst for this downturn, on-chain data paints a different picture.
The Myth of ETF-Induced Selling Pressure
The narrative that ETF inflows have been the primary driver of Bitcoin's recent price decline has gained traction in certain circles. However, a closer examination of on-chain data reveals a different story.
• Long-Term Hodlers Remain Resilient: Despite the market downturn, long-term Bitcoin holders, often referred to as "whales," have shown remarkable resilience. These individuals, who have held their Bitcoin for extended periods, have not been significant sellers during the recent correction.
• Short-Term Holders Under Pressure: In contrast to long-term holders, short-term holders have been more inclined to sell their Bitcoin, particularly during periods of market volatility. This suggests that the recent price decline may be more attributable to profit-taking by short-term investors rather than a broader market sell-off.
A Normal Correction, Not a Bear Market
It's important to recognize that the current price correction is a natural part of the cryptocurrency market cycle. Bitcoin has experienced similar corrections in the past, often followed by periods of consolidation and subsequent upward momentum.
• Technical Analysis Suggests a Healthy Correction: A closer look at Bitcoin's technical indicators reveals a healthy correction. The Relative Strength Index (RSI) has dipped below the overbought level, indicating that the recent price surge may have been overextended. Additionally, the Moving Average Convergence Divergence (MACD) has crossed below the signal line, suggesting a potential bearish trend in the short term.
• Support Levels to Watch: Traders and investors should keep an eye on key support levels, such as the 100-day moving average on the 4-hour chart. If Bitcoin can hold above this level, it could signal a potential reversal of the current downtrend.
The Future of Bitcoin: A Long-Term Bullish Outlook
Despite the recent price correction, the long-term outlook for Bitcoin remains bullish. Several factors continue to drive the adoption and value of Bitcoin:
• Institutional Adoption: Major financial institutions and corporations are increasingly recognizing the potential of Bitcoin as a valuable asset class. This institutional adoption is likely to fuel further price appreciation in the long run.
• Deflationary Supply: Bitcoin's fixed supply of 21 million coins ensures that its value will appreciate over time as demand increases.
• Global Economic Uncertainty: As global economies grapple with inflation and geopolitical tensions, Bitcoin's appeal as a hedge against inflation and a store of value is likely to grow.
In conclusion, while the recent price correction may have caused some short-term volatility, it is important to maintain a long-term perspective. Bitcoin's underlying fundamentals remain strong, and the cryptocurrency is well-positioned to continue its upward trajectory in the years to come.
Disclaimer: This article is for informational purposes only and should not be construed as financial1 advice. It is important to conduct thorough research and consider consulting with a financial advisor before making any investment decisions.2
IBIT | This is Where Real Trader's are LookingThere's no need to complicate things. You are watching where real traders watch.
I see the green box and the red box as the selling place.
When the price reaches those areas, I recommend you to follow the volume side. If these regions are to be broken and passed, the volume side will give signals of this.
-
My Record Speaks for Itself
DOGEUSDT.P | 4 Reward for 1 Risk much more if you hold it.
RENDERUSDT.P | HTF Accuracy
ETHUSDT.P | Accurate Buyer Zone Identification | High Risk Reward if you hold it.
BNBUSDT.P | Accurate Buyer Zone Identification | High Risk Reward if you hold it.
Bitcoin Dominance | Great Characteristic Detection and Accurate Analysis
BITCOIN | MACRO OUTLOOK | Top is IN | ALTCOINS SHINEI've been risking my opinion for the better part of a year, saying that the ATH is stilllll coming. Now, it's time for me to choose my trades again; and I'm choosing to take my profits here.
Here's a replay of an entire year's worth of BTC updates, incase you want to verify😉:
The next thing I'm looking at is the continuation of Altseason , because the TOTAL3 chart peaks AFTER the BTC high. I touched a little bit on this mechanic here; but I think I'll do another update on that in coming days.
After alts top-out, for BTC bounce zones I'll consider the moving averages, Elliot wave corrective theory, and previous resistance zones as new bounce zones. But this is near term, not short term.
Stay tuned!! Cheers to the believers 🥂
________________
COINBASE:BTCUSD
Bitcoin (BTC/USD) Analysis: Correction on the Horizon?Bitcoin has been on a parabolic rally, recently crossing the critical 1.618 Fibonacci extension level at $96,232. As BTC edges closer to the psychological $100,000 mark, questions arise about whether this momentum can be sustained or if a correction is imminent. Here's a detailed analysis:
Key Observations:
1.Fibonacci Extension Levels
The price has decisively broken above the 1.618 Fibonacci level at $96,232, a critical milestone often associated with overextension in trends.
Historically, price corrections tend to occur after such steep rallies, especially near extended
Fibonacci levels.
2.Overbought RSI
The daily RSI is in overbought territory (>70), signaling that the asset may be due for a cooling-off period.
A potential bearish divergence could emerge if the price forms higher highs while RSI fails to do so, which is a classic precursor to corrections.
3.Volume Dynamics
While volume supported the initial breakout, it has been relatively muted as Bitcoin approaches $100,000.
Declining volume in an uptrend often signals waning momentum and increases the likelihood of a pullback.
4.Psychological Resistance
The $100,000 level is a key psychological barrier, likely to trigger profit-booking by traders and long-term holders alike.
5.Potential Support Zones
In case of a correction, watch for support at the previous Fibonacci levels:
$90,000 (minor support)
$74,296 (1.0 retracement)
$66,700 (0.786 retracement)
Scenarios to Watch:
1.Short-Term Correction Likely
If BTC fails to hold above the 1.618 level ($96,232), we could see a pullback toward $90,000 or even deeper to $74,296.
Bearish RSI divergence or a decline in volume on higher prices would confirm this scenario.
2.Continued Rally
Consolidation above $96,000, supported by strong volume and neutralizing RSI, could indicate sufficient strength for a breakout beyond $100,000.
A confirmed breakout with volume could pave the way toward $110,000 and beyond.
Conclusion:
A correction appears increasingly likely in the short term as BTC approaches the psychological $100,000 resistance with overbought conditions. However, the broader trend remains bullish, and any pullback to key Fibonacci support levels could present a buying opportunity for long-term traders.
Key levels to watch: $96,000 (immediate support), $100,000 (resistance), and $74,296 (major support).
Stay cautious and monitor the RSI, volume, and price action around $100,000 to gauge the next move.
Let me know your thoughts! Is BTC primed for a pullback or ready to shatter $100,000? Comment below!
Bitcoin Nears $100,000 as China Clarifies Personal Crypto RightsBitcoin, the world's largest cryptocurrency, has been on a tear, recently surpassing the $99,000 mark. This surge has been fueled by a combination of factors, including increased institutional adoption, favorable regulatory developments, and growing global economic uncertainty.
China's Crypto Clarity
One of the most significant developments for the cryptocurrency market has been China's clarification of its stance on personal crypto ownership. While the country has imposed strict regulations on cryptocurrency trading and mining, it has clarified that individuals are allowed to hold cryptocurrencies for personal use. This regulatory clarity has boosted investor confidence and could potentially lead to increased adoption of cryptocurrencies in China, the world's second-largest economy.
Institutional Adoption Continues to Grow
Institutional investors, such as hedge funds, pension funds, and corporations, have been increasingly investing in Bitcoin and other cryptocurrencies. This growing institutional interest has provided significant support to the market and has helped to drive the price of Bitcoin higher.
Global Economic Uncertainty
The ongoing global economic uncertainty, including rising inflation, geopolitical tensions, and the potential for a recession, has led investors to seek alternative assets. Bitcoin, as a decentralized and inflation-resistant asset, has become an attractive investment option for many.
Technical Analysis: A Bullish Outlook
Technical analysis of Bitcoin's price chart suggests that the cryptocurrency is in a strong uptrend. The recent breakout above the $99,000 level has further strengthened the bullish sentiment. Key technical indicators, such as the Relative Strength Index (RSI) and Moving Average Convergence Divergence (MACD), are signaling1 bullish momentum.
On-Chain Data Points to Further Upside
On-chain data, which analyzes the behavior of Bitcoin on the blockchain, provides further insights into the potential for future price appreciation. Metrics like the MVRV Z-Score, NUPL, and Puell Multiple suggest that Bitcoin is not overbought and has significant room to grow.
Challenges and Risks
While the outlook for Bitcoin remains bullish, it is important to acknowledge the risks and challenges associated with investing in cryptocurrencies. These include:
• Market Volatility: The cryptocurrency market is highly volatile, and Bitcoin's price can fluctuate significantly in a short period.
• Regulatory Uncertainty: Changes in regulations can impact the price of Bitcoin and other cryptocurrencies.
• Security Risks: Cryptocurrencies are vulnerable to hacking attacks and other security threats.
• Technical Issues: Technical issues with the Bitcoin network could negatively impact its performance and price.
Conclusion
Bitcoin's recent surge to near $100,000 has been fueled by a combination of factors, including increased institutional adoption, favorable regulatory developments, and growing global economic uncertainty. While the future of Bitcoin remains uncertain, the current bullish sentiment and strong technical indicators suggest that the cryptocurrency could continue its upward trajectory. However, investors should approach Bitcoin with caution and be aware of the risks involved.
BTC The State NowHere’s a quick market update with a timeline and trend analysis :
- As always, it’s as simple as checking the colors and trends in the graphic.
- We’re currently in a phase of solid consolidation.
- The bull run hasn’t started yet, but in time, BTC is expected to go parabolic, as it usually does.
- The current cycle is taking longer to play out.
- The differences between 2020 and 2024 corrections are clear. Back in 2020, BTC was still maturing, not widely accepted, and impacted by the Covid crisis.
- In 2023, BTC has gained more recognition with ETFs, attracted wealthy investors, and is evolving into a true store of value.
- For these reasons, TheKing may be retracing, but it’s doing so with power and resilience.
- Everyone wants a piece of the cake, which is why Bitcoin's price remains elevated.
Just HODL and you'll be rewarded in the long run.
Happy Tr4Ding
How Do They Contribute to the Surge Above $100K on Deribit?A New Era of Crypto Adoption Dawns
The cryptocurrency market has been ablaze with bullish sentiment, and Bitcoin (BTC) has taken center stage. A particularly striking development has emerged from the derivatives market, with Bitcoin futures on Deribit trading above the $100,000 mark for contracts expiring in March, June, and September 2025. This unprecedented surge in futures prices signals a profound shift in market sentiment and underscores the growing anticipation for Bitcoin's long-term potential.
The Deribit Phenomenon
Deribit, a prominent cryptocurrency derivatives exchange, has become a focal point for institutional investors and traders seeking exposure to Bitcoin's volatility. The exchange's robust trading platform and deep liquidity pools have attracted diverse market participants, from hedge funds to retail traders.
The recent surge in Bitcoin futures prices on Deribit can be attributed to several factors:
1. Institutional Adoption: A growing number of institutional investors, such as hedge funds and pension funds, are allocating a portion of their portfolios to cryptocurrencies. These institutions often prefer derivatives markets for their flexibility and risk management capabilities.
2. Regulatory Clarity: Increasing regulatory clarity in major jurisdictions, including the United States, has boosted investor confidence. As governments worldwide grapple with the implications of cryptocurrencies, a more favorable regulatory environment could further accelerate adoption.
3. Network Upgrades: Bitcoin's ongoing network upgrades, such as the Lightning Network and Taproot, are enhancing the efficiency and scalability of the blockchain. These improvements could lead to increased adoption and transaction volume.
4. Deflationary Nature: Bitcoin's limited supply and deflationary nature make it an attractive asset for long-term investors. As the demand for Bitcoin grows, its price is expected to appreciate over time.
A Glimpse into the Future
The $100,000 price level for Bitcoin futures represents a significant psychological barrier. Breaking through this level could further ignite bullish sentiment and attract new investors to the market. However, it is important to note that the cryptocurrency market is highly volatile, and prices can fluctuate rapidly.
While the long-term outlook for Bitcoin remains optimistic, short-term price fluctuations are inevitable. Investors should approach the market with a long-term perspective and be prepared for potential volatility.
The Road Ahead
As Bitcoin continues to evolve and mature, its role in the global financial system is likely to expand. The recent surge in futures prices on Deribit is a testament to the growing recognition of Bitcoin's value proposition. However, it is crucial to remain cautious and conduct thorough research before investing in cryptocurrencies.
Potential Challenges and Risks
Despite the bullish sentiment, several challenges and risks could impact Bitcoin's price trajectory:
1. Regulatory Uncertainty: While regulatory clarity is increasing, inconsistent regulations across different jurisdictions could create uncertainty for investors.
2. Market Manipulation: The cryptocurrency market is susceptible to market manipulation, especially by large players with significant financial resources.
3. Security Risks: Hackers and cybercriminals pose a constant threat to cryptocurrency exchanges and wallets.
4. Economic Downturns: Economic downturns and geopolitical tensions could negatively impact the cryptocurrency market.
Conclusion
The recent surge in Bitcoin futures prices on Deribit marks a significant milestone in the cryptocurrency market. However, investors should approach the market with caution and be aware of the inherent risks. As the cryptocurrency industry continues to evolve, it is essential to stay informed and adapt to the changing landscape.
Disclaimer: This article is for informational purposes only and should not be construed as financial advice.1 Please conduct your own research2 or consult with a financial advisor before making any investment decisions.
How Bitcoin BTC Will Break $100k And What Is Going Next?Hello, Skyrexians!
BINANCE:BTCUSDT is approaching the $100k, which is the key psychological level for many traders. Some traders are wondering how Bitcoin can pump so high, other became believe in $200k, $500k of even one million dollars per coin! For those who follow us it's not surprise that BTC has almost reached $100k from our previous analysis . There we mentioned that crypto asset is finishing the bull run with the wave 5. This wave had the target at $107k and we can define with higher accuracy the wave's end using subways count inside it.
On the daily time frame we can see the potential Elliott Waves counting. Looking at the maximum Awesome Oscillator value we can see that currently price is printing wave 3. This wave has the target with the 1.61, 2.61 or 3.61 Fibonacci extension levels. The first one has been broken, now price is at 2.61 level. Therefore, it can start local correction anytime now. The maximum target is $113k, which has the low probability of reaching in this wave 3.
We want you also to pay attention that Bullish/Bearish Reversal Bar Indicator flashed the green dot just before the growth and at the bottom on August 5 as well. As always, alerts from this indicator can be automatically replicated on exchange account orders. You can find the information in our article on TradingView . We can expect the red dot as a potential reversal sign.
The next dump in our opinion is not going to be the end of this game, Bitcoin shall print wave 4. It has targets between 0.38 and 0.5 level. BTC usually tends to show the short correction, so $79k can be the correction target. After that we expect the final subway of the final wave, which will likely reach our target from previous article at $107k, but the decisive factors are going to be the bearish divergence of the AO and the red dot on our indicator.
Best regards,
Skyrexio Team
___________________________________________________________
Please, boost this article and subscribe our page if you like analysis!
Bitcoin Approaching Upper Channel Resistancehello guys.
Ascending Channel: Bitcoin is trading within a well-defined ascending channel, with support and resistance levels marked by parallel lines.
Upper Resistance Zone: The price is nearing the upper boundary of the channel around $95,784, which may act as strong resistance.
Bullish Momentum: The trend is bullish as Bitcoin has consistently followed the channel upwards, respecting both support and resistance levels.
Potential Pullback: If Bitcoin faces resistance at the upper channel, a pullback towards the midline or lower boundary is possible.
Target: If the price breaks above the upper boundary, Bitcoin could see a further bullish extension around $95,784. However, rejection at this level could signal a temporary correction.
Bitcoin Elliott Wave Analysis: Wave 5 in Action! Bitcoin is technically riding Wave 5 on both higher and lower timeframes – a strong indication of potential momentum toward its maximum potential! 🎯
📊 Key Levels
Target: $102,000 (Fib 1.618 extension level)
Stop Loss: $91,800 (below Wave 4)
Entry: Market Price
📈 Risk-to-Reward: 2.5:1 RRR
This setup aligns perfectly with Elliott Wave theory, signaling an excellent risk-reward opportunity. Ride the momentum and stay sharp – Bitcoin might be heading toward new highs! 🌟
💡 Pro Tip: Always manage your risk and stick to your plan!
⚠️ Risk Disclaimer: Trading cryptocurrencies involves a high level of risk and may not be suitable for all investors. Prices can be highly volatile, and you could lose your entire investment. Always conduct your own research and consider your financial situation before trading. Never risk more than you can afford to lose.
#Bitcoin #ElliottWave #CryptoTrading #BTC #RiskManagement
Is Bitcoin's Bullish Breakout a Catalyst for a 90% Rally?
Bitcoin, the world's largest cryptocurrency, has been making significant strides in recent months, with several key metrics signaling a potential for a substantial price surge. Analysts and traders are closely watching these developments, which could propel BTC to new all-time highs.
Key Metrics Pointing to a Bullish Future
A confluence of technical indicators and market sentiment suggests that Bitcoin is poised for a significant upward move. Here are some of the key factors driving the optimism:
1. Classic BTC Price Chart Metrics:
o Golden Cross: A bullish crossover of the 50-day and 200-day moving averages, often seen as a strong buy signal.
o Relative Strength Index (RSI): A momentum oscillator that indicates whether an asset is overbought or oversold. A reading above 70 suggests overbought conditions, while a reading below 30 indicates oversold conditions.1
o Moving Average Convergence Divergence (MACD): A trend-following momentum indicator that shows the relationship between two moving averages.2 A bullish crossover of the MACD line above the signal line is often interpreted as a buy signal.
2. Bitcoin ETF Options Launch: The launch of Bitcoin ETF options has generated significant interest and liquidity in the market. This development could attract institutional investors, who may view Bitcoin as a viable asset class for diversification and portfolio growth.
3. Strong Market Sentiment: Traders and analysts are increasingly bullish on Bitcoin's long-term prospects. Many believe that the cryptocurrency has the potential to reach $100,000 or even higher in the coming years.
Potential for a 90% Rally
Given the strong fundamental and technical factors, some analysts are predicting a 90% rally in Bitcoin's price. Such a move would take the cryptocurrency to unprecedented heights, surpassing its previous all-time high. However, it's important to note that the cryptocurrency market is highly volatile, and price predictions should be taken with a grain of salt.
The Road Ahead
While the future of Bitcoin is uncertain, the recent bullish signals suggest that the cryptocurrency could be on the cusp of a major bull run. However, it's essential to approach investing in cryptocurrencies with caution and to conduct thorough research before making any investment decisions.3
Disclaimer: This article is for informational purposes only and4 should not be construed as financial advice. It's crucial to consult with a qualified financial advisor before making any investment decisions.
Additional Considerations
As the cryptocurrency market continues to evolve, it's important to consider the following factors:
• Regulatory Landscape: Government regulations can significantly impact the price and adoption of cryptocurrencies.
• Market Manipulation: The cryptocurrency market is susceptible to manipulation by large investors and whales.
• Technological Advancements: Technological advancements, such as layer-2 solutions and improved scalability, can positively impact Bitcoin's performance.
• Economic Factors: Global economic conditions, such as inflation and interest rates, can influence the demand for Bitcoin.
By staying informed and understanding the risks involved, investors can navigate the volatile cryptocurrency market and potentially reap significant rewards.