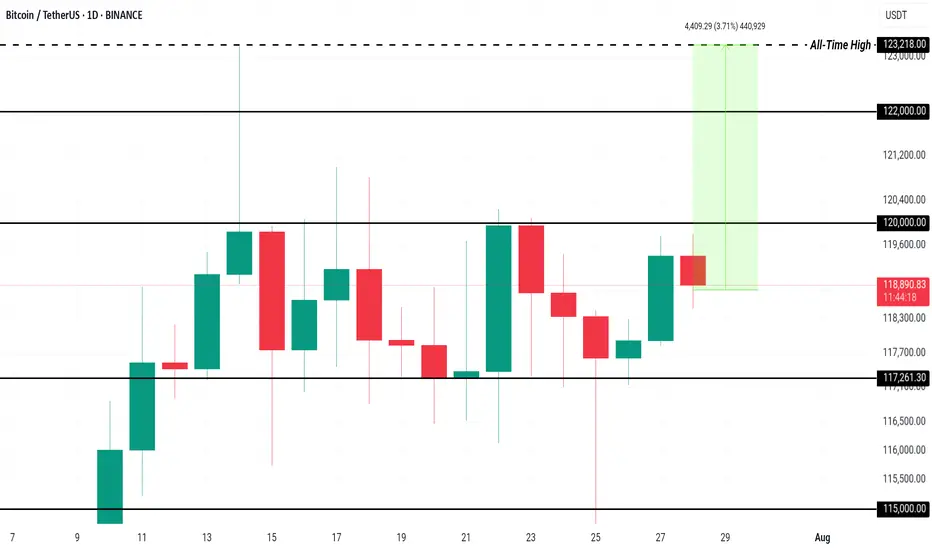
Here’s Why Bitcoin Price Could Rewrite History in AugustBINANCE:BTCUSDT price is currently hovering at $118,938, within a consolidation range between $117,261 and $120,000 . While this range has held steady, the possibility of breaking through $120,000 is high if investor sentiment remains strong.
The current sell-side risk ratio for BINANCE:BTCUSDT is at 0.24, well below the neutral threshold of 0.4 and closer to the low-value realization threshold of 0.1. This suggests that the market is experiencing consolidation, with investor behavior indicating a pause in large sell-offs.
Historically, August has been a bearish month for BINANCE:BTCUSDT , with the median monthly return sitting at -8.3%. However, given the current accumulation trend and the low sell-side risk, Bitcoin may defy its historical trend this year. If Bitcoin can secure $120,000 as support, it would likely push past $122,000 and move toward the ATH .
However, there remains a risk that the market could turn bearish if investors shift their stance due to unforeseen market factors. In this case, BINANCE:BTCUSDT could lose support at $117,261 and slide to $115,000, reversing the bullish thesis.
Bitcoinusdt
ERAUSDT Forming Bullish FlagERAUSDT has caught the attention of traders after a strong impulsive move that has laid the foundation for a possible continuation of its bullish trend. The current structure appears to be forming a classic bullish flag/pennant formation, a pattern often observed in strong uptrends, where price consolidates in a narrow range before breaking out higher. With volume supporting the recent breakout and price action showing resilience near consolidation support, this setup presents an exciting upside potential.
The projected gain of 90% to 100%+ aligns well with the technical structure seen on the chart, especially considering the momentum-driven environment ERAUSDT is trading in. As price continues to coil within a tight range, it builds the energy necessary for a decisive breakout. The bullish sentiment surrounding the ERA ecosystem, coupled with increasing interest from speculative and long-term investors, could be the fuel needed to push this pair into a significant rally.
Fundamentally, ERA is beginning to draw more eyes from across the crypto community, possibly due to developments or partnerships that are elevating its profile. This blend of technical readiness and rising investor interest makes it a coin to watch in the short to mid-term. If bullish confirmation holds, the next leg could be sharp and aggressive, potentially achieving or even exceeding the projected 100% target.
This is a moment where traders who rely on high-reward momentum setups could benefit by monitoring this pair closely. With risk well-defined below recent lows and the structure signaling strength, ERAUSDT deserves a spot on every active trader's radar.
✅ Show your support by hitting the like button and
✅ Leaving a comment below! (What is You opinion about this Coin)
Your feedback and engagement keep me inspired to share more insightful market analysis with you!

BTC market update Bitcoin Market Update:
Bitcoin is currently consolidating, and the market is indecisive. It's better to watch closely for a breakout or breakdown before making any trades.
Bullish Scenario:
Breakout above resistance could lead to a strong bullish rally. Target: Next resistance level.
Pro Tip: Confirm with high volume for a valid breakout.
Bearish Scenario:
Breakdown below support could trigger strong selling. Target: Next support level.
Pro Tip: Watch for confirmation with increased selling volume to avoid fakeouts
Conclusion:
Wait for clear breakout or breakdown to trade. Avoid entering blindly.
Bitcoin Early, Not LateA simple graphic with all annotations included :
- Trend.
- Fibonnacci.
- Middle Line.
- Support and Bounces.
- Resistances and dips.
- Everyone gets Bitcoin at the price they deserve.
- Not a price Prediction, keep things simple.
Happy Tr4Ding !
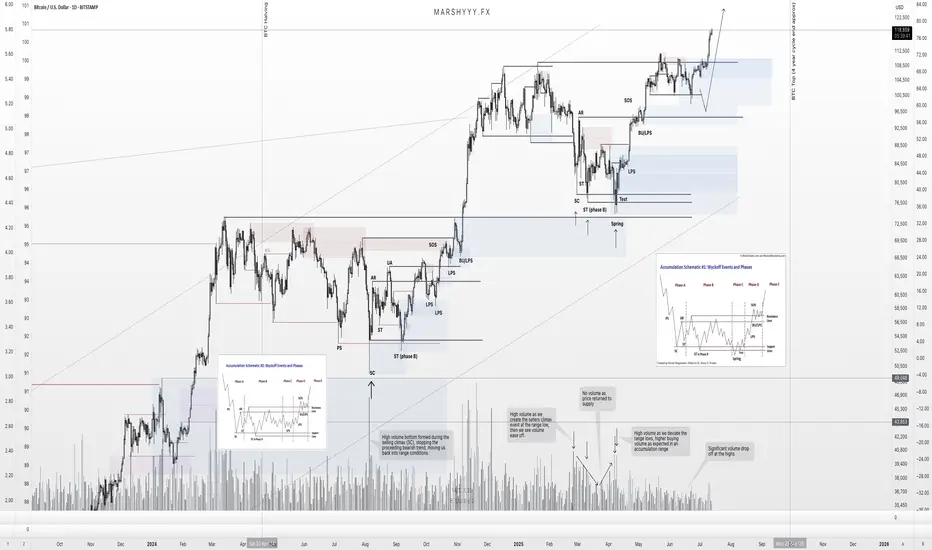
BTC – Textbook Pullback. New ATHs. What’s Next?Back in mid-June, I published a BTC update calling for a local correction into HTF demand while most were screaming bear market and waiting for deeper breakdowns.
Price action played out exactly as forecasted.
BTC swept the $100k swing low, front-ran my first demand zone by $400, and launched into a powerful reversal — just like it did back in April, where it also front-ran the key HTF demand before rallying.
That move took us straight into new all-time highs (ATHs) — now trading comfortably around $118k.
🧠 What Happened?
✅ Liquidity sweep of the prior low
✅ Front-run demand zone (perfect HTF structure)
✅ Strong bullish reaction and higher high
✅ Confluence from USDT.D rejection at 5.25%
✅ Alts showing signs of strength as BTC rallies
The entire setup aligned perfectly across BTC, USDT.D, TOTAL, and OTHERS.D — all of which I’ve been tracking in tandem.
🔮 What Now?
With BTC now in price discovery, I expect continuation higher — but not without the possibility of a short-term pullback.
📉 A potential retest of the $108k zone isn’t off the table. This level aligns with:
- Prior breakout structure
- Range high retest
- Local demand before continuation
But even if we go straight up — I remain HTF bullish into the final phase of this cycle, supported by:
- USDT.D structure still bearish
- BTC.D showing signs of distribution
- ETH.D and OTHERS.D gaining momentum
- Altseason rotation already starting to pick up
🧭 The Macro Outlook
The 4-year cycle projection still points to a Q3 2025 top — likely between August late and September based on historical cycle timing, but this could deviate.
That gives us a window of 2–3 months for this final leg to unfold — and it’s already in motion.
Stay focused. Stick to your plan. Ride the trend, don’t chase it.
Let me know what levels you're watching next, and whether you think we get that $108k retest — or we go vertical from here.
1D:
3D:
4D:
1W:
1M:
— Marshy 🔥
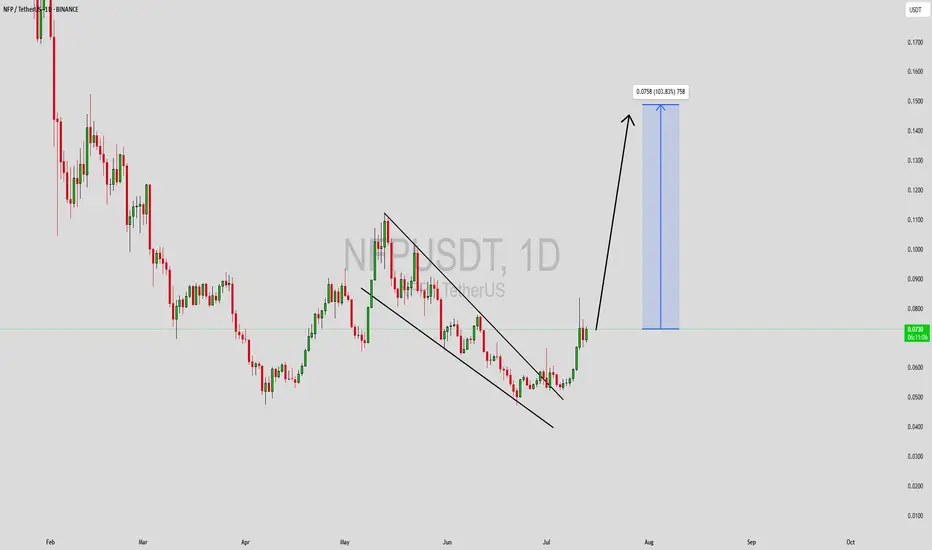
NFPUSDT Forming Descending ChannelNFPUSDT is starting to attract significant attention as it shows signs of reversing its downward trend with a promising technical setup. This crypto pair has recently broken out of a descending channel, indicating that selling pressure might be subsiding while buyers are stepping in. The price structure suggests a clear path for a potential bullish continuation, and the projected target hints at a strong gain of around 90% to 100%+. Technical traders are closely watching this level for a confirmed breakout and a sustained rally.
The volume on NFPUSDT remains good, showing that liquidity is healthy and there’s active participation from traders and investors. This is a critical factor in validating the breakout — when volume aligns with price action, the odds of a strong move increase. Many crypto traders rely on these confirmation signals to enter early positions, capturing the momentum as it picks up. With the market sentiment slowly shifting, NFPUSDT could see an influx of new interest in the coming weeks.
Investors are increasingly taking interest in this project, not just from a technical perspective but also due to its fundamentals and community engagement. As the crypto market looks for solid setups in a sea of volatility, pairs like NFPUSDT stand out for their clear patterns and realistic upside potential. Keep an eye on support levels holding firm and whether the breakout candle closes above resistance with strength.
✅ Show your support by hitting the like button and
✅ Leaving a comment below! (What is You opinion about this Coin)
Your feedback and engagement keep me inspired to share more insightful market analysis with you!
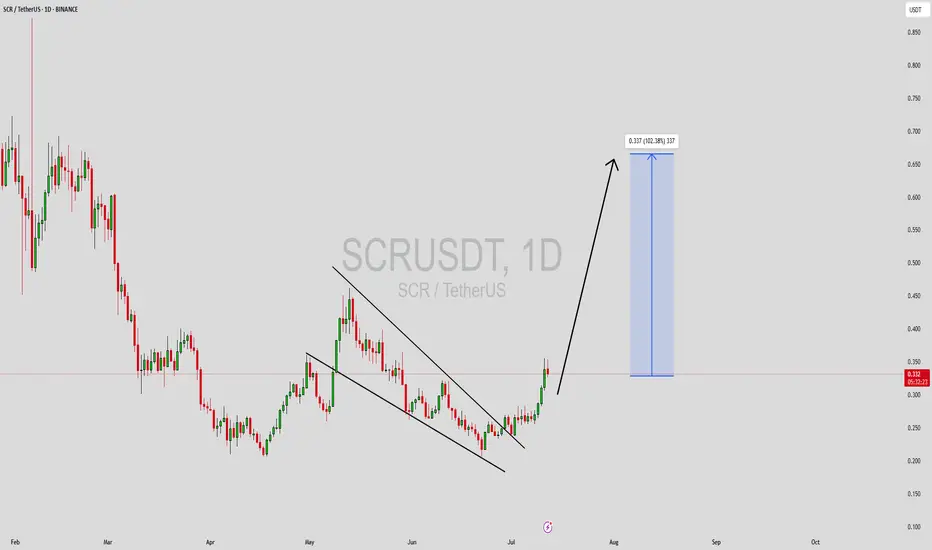
SCRUSDT Forming Descending TriangleSCRUSDT is catching the attention of smart traders as it shows signs of a strong bullish setup supported by increasing trading volume. This pair has recently seen consistent accumulation phases, which often precede significant price moves. With expectations for a potential 90% to 100%+ gain, SCRUSDT could deliver impressive returns for investors who position themselves early. Traders who are tracking fresh breakout opportunities should keep this crypto on their watchlist as buying interest grows across key support levels.
The underlying fundamentals of the SCR project are also becoming more appealing, helping fuel this recent investor interest. As the team behind SCR continues to develop its ecosystem, more market participants are gaining confidence in its long-term growth potential. The robust on-chain activity and positive community sentiment further add to the bullish outlook. It’s encouraging to see that the volume profile supports the price action, indicating that this isn’t just a speculative pump but rather a move backed by solid participation.
Technically, SCRUSDT is forming a reliable base that could launch the next leg up once a breakout above the recent resistance levels is confirmed. Traders should watch for strong bullish candles and increasing volume near breakout points to validate the move. Risk management remains key—placing stop-losses under nearby swing lows can help manage downside risk while targeting the anticipated upside potential.
✅ Show your support by hitting the like button and
✅ Leaving a comment below! (What is You opinion about this Coin)
Your feedback and engagement keep me inspired to share mo
AWEUSDT Forming Bullish TrendAWEUSDT is gaining momentum among traders as it shows signs of a promising breakout from its recent consolidation zone. The chart highlights how the price has tested a key support zone multiple times and has now begun to push upward with increasing volume, suggesting that accumulation is taking place. This healthy volume is often the first sign that smart money is entering the market, laying the groundwork for a sustained rally.
Currently, technical indicators point towards a short-term bullish trend with a potential gain of 30% to 35%+. Such a move could be fueled by the break above the highlighted accumulation area, which has acted as a solid base for this possible upside. Traders looking for opportunities in altcoins with clear risk-to-reward setups will find AWEUSDT’s structure attractive as it shows a balance of stability and momentum.
Adding to the optimism is the fact that more investors are showing interest in this project, hinting at improving sentiment and stronger fundamentals. As the market sentiment improves, coins like AWEUSDT with good liquidity and technical patterns often lead the way for short but impactful moves. It’s a setup worth monitoring closely for swing traders who thrive on these breakout opportunities.
✅ Show your support by hitting the like button and
✅ Leaving a comment below! (What is You opinion about this Coin)
Your feedback and engagement keep me inspired to share more insightful market analysis with you!

HFTUSDT Forming Falling WedgeHFTUSDT is currently displaying a textbook Falling Wedge Pattern, a classic signal that often points to an upcoming bullish reversal. This pattern is one of the most reliable in technical analysis, as it indicates that sellers are gradually losing momentum and buyers could soon step in to push prices higher. With good volume backing up this setup, traders are growing more confident that a breakout is on the horizon, which could fuel a strong upward rally.
The potential gain for HFTUSDT based on this pattern is estimated between 90% to 100%+, making it an attractive opportunity for swing traders and investors looking for high-risk, high-reward plays. The steady uptick in volume suggests that smart money is already accumulating positions before the anticipated breakout. When combined with the bullish pattern, this sets the stage for a price surge once the resistance line of the wedge is convincingly broken.
This setup comes at a time when the crypto market sentiment is gradually improving, with traders seeking altcoins that can outperform in the next bullish wave. HFTUSDT’s clear technical structure and growing investor interest place it among the top coins to watch closely. A confirmed breakout with strong daily closes above the wedge resistance could open the door to quick gains, rewarding early entrants who position themselves strategically.
It’s always wise to monitor volume and price action carefully when trading a Falling Wedge Pattern like this. Waiting for a confirmed breakout with increased volume can help reduce the risk of false signals and maximize profit potential. Keep HFTUSDT on your radar if you’re aiming to catch a move with solid technical backing and high potential upside.
✅ Show your support by hitting the like button and
✅ Leaving a comment below! (What is You opinion about this Coin)
Your feedback and engagement keep me inspired to share more insightful market analysis with you!

BSWUSDT Forming Falling WedgeBSWUSDT is currently showcasing a classic falling wedge pattern, a bullish reversal signal often associated with a sharp move to the upside once the pattern resolves. This technical structure forms when price action consolidates with lower highs and lower lows, while volume typically decreases — setting the stage for a breakout. In BSWUSDT’s case, the falling wedge has matured, and bullish interest is beginning to surface with improving volume levels, suggesting that accumulation is underway.
The technical breakout from this pattern could unlock strong upside potential, and current projections indicate a possible 90% to 100% gain in the coming sessions. This aligns well with historical performance of similar wedge formations in the crypto market, where the price often surges after breaking the upper resistance trendline. Traders are closely monitoring key resistance zones for confirmation and volume spikes that can validate the trend shift.
Investor sentiment toward the (BSW) ecosystem is growing steadily due to its utility in DeFi services and low trading fees. The increase in volume also indicates that smart money could be positioning ahead of a major move. Coupled with market-wide bullishness, BSWUSDT may soon experience a strong rally, driven by both technical and fundamental catalysts.
This setup offers a high-reward opportunity for swing traders and technical analysts who are focused on breakout trades and pattern-based strategies. The falling wedge combined with rising investor engagement makes BSWUSDT a potential breakout star to watch closely.
✅ Show your support by hitting the like button and
✅ Leaving a comment below! (What is You opinion about this Coin)
Your feedback and engagement keep me inspired to share more insightful market analysis with you!

FORMUSDT Forming Bullish WaveFORMUSDT is currently shaping a bullish wave pattern, signaling a potential upward continuation in price. This technical structure is typically characterized by impulsive moves followed by brief consolidations, suggesting growing investor confidence. The pair has recently shown strength with higher lows and steady volume increases, confirming that accumulation may be underway. Traders watching this pattern should note the supportive technical foundation forming at current price levels.
The projected gain for FORMUSDT ranges from 40% to 50%, supported by positive volume dynamics and increased market interest. The breakout potential from this bullish wave setup is significant, especially as the market begins to rotate capital back into promising low-cap altcoins. With momentum indicators trending upward and no immediate resistance overhead, this setup offers a strong opportunity for medium-term growth.
Investor sentiment around FORM is improving as the project gains visibility within the DeFi and Web3 sectors. The team behind FORM has been steadily building infrastructure that supports yield generation, DAO participation, and cross-chain functionality—all of which align with broader crypto market trends. These factors are drawing attention from both retail and strategic investors looking for next-wave DeFi plays.
As FORMUSDT builds this bullish structure, market participants should keep a close eye on price action and volume for continuation signals. A clean breakout backed by rising volume could validate the projected gains and initiate the next leg higher in this bullish cycle.
✅ Show your support by hitting the like button and
✅ Leaving a comment below! (What is You opinion about this Coin)
Your feedback and engagement keep me inspired to share more insightful market analysis with you!

XECUSDT Forming Bullish WaveXECUSDT is displaying a strong bullish wave pattern, suggesting a potential continuation of its current uptrend. The structure reflects a healthy impulse wave formation, often indicative of early stages in a major bullish cycle. Price action has consistently respected key support zones while printing higher highs and higher lows—a classic sign of market strength. With volume backing this movement, investor sentiment appears increasingly positive as XEC begins gaining traction among altcoin watchers.
Technically, the asset has broken out from its consolidation phase and now targets the next resistance zones that could unlock a 50% to 60% price increase. This wave pattern is particularly compelling for swing traders and position traders, as the setup offers clear entry points and a strong risk-to-reward ratio. Volume surges during bullish candles confirm the accumulation phase is over, and momentum is building for a sustained leg up.
Fundamentally, XEC (eCash) continues to strengthen its ecosystem, focusing on fast, low-fee payments that appeal to real-world adoption. Its consistent development updates and community support are bringing more visibility to the project. As blockchain adoption grows globally, eCash's utility as a digital currency is becoming more relevant—attracting both retail and institutional interest.
This is a critical moment for XECUSDT, and traders watching this bullish wave structure could be early in capturing significant upside potential. If momentum continues and broader crypto sentiment remains favorable, the 50% to 60% target range appears well within reach in the near term.
✅ Show your support by hitting the like button and
✅ Leaving a comment below! (What is You opinion about this Coin)
Your feedback and engagement keep me inspired to share more insightful market analysis with you!

BITCOIN BULL TRAP!!!? IS THIS YOUR SHORT ENTRY TO $44k?I am explaining a potential Bitcoin’s leading diagonal formation, that is forming an UHTF wave 1, that if successfully formed can be a start of the crash towards 44k!

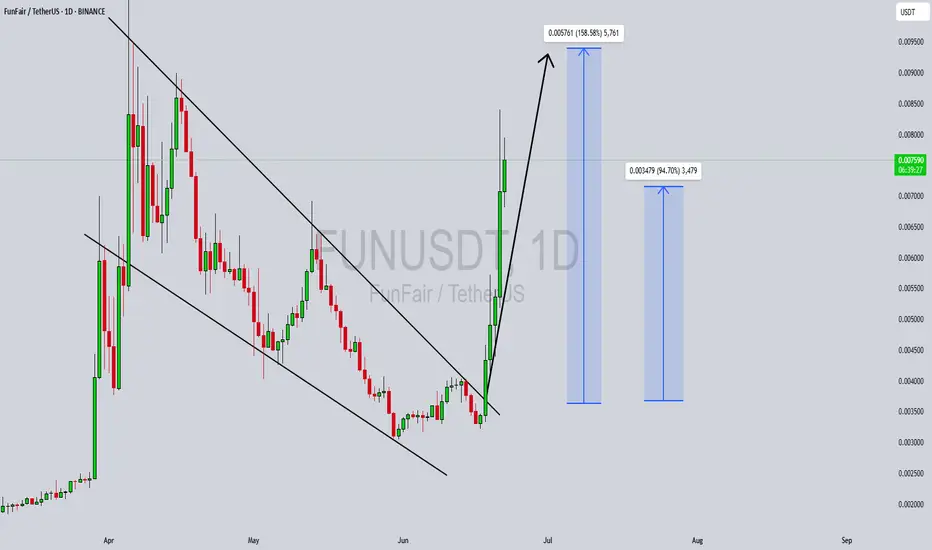
FUNUSDT Forming Classic Descending ChannelFUNUSDT has recently completed a significant breakout from a classic descending channel formation, which is a strong bullish reversal pattern. This breakout, fueled by a surge in volume and bullish sentiment, signals a shift in trend after an extended downtrend phase. The price action shows a clear escape from the consolidation zone, followed by strong green candles indicating aggressive buying pressure. Traders are now closely watching this pair for further continuation as momentum builds across the altcoin market.
With a projected gain of 70% to 80%, FUNUSDT stands out as a high-potential opportunity in the current crypto cycle. The breakout aligns with broader market recovery patterns and investor appetite for undervalued tokens. As technicals support this upward trajectory, many analysts believe this rally could extend beyond initial resistance levels, especially if volume remains consistent or grows further. The measured move targets align well with the height of the channel, giving confidence to those entering post-breakout.
Investors are clearly taking an interest in FUNUSDT, as reflected in the sharp upward movement and increased market activity. This shift suggests both short-term traders and longer-term holders are accumulating positions in anticipation of a larger market move. With momentum and structure now favoring bulls, FUNUSDT may continue to outperform similar-cap tokens in the weeks ahead.
For those following chart patterns and volume-based trading strategies, FUNUSDT is demonstrating a strong technical setup. The descending channel breakout, paired with fundamental optimism and liquidity inflow, could be the trigger for sustained upward movement.
✅ Show your support by hitting the like button and
✅ Leaving a comment below! (What is You opinion about this Coin)
Your feedback and engagement keep me inspired to share more insightful market analysis with you!
TUSDT Forming Descending Channel TUSDT is currently trading within a clearly defined descending channel pattern, which is a classic bullish reversal signal when identified in the right market context. After a prolonged period of correction, the price is now consolidating within the lower boundary of the channel, signaling that a potential breakout could be near. Historically, descending channels often precede strong bullish reversals, especially when accompanied by rising volume and increased investor interest—which we’re now starting to see in TUSDT.
The volume profile has remained consistently good during the consolidation phase, indicating that buyers are gradually absorbing supply at lower prices. This accumulation zone within the channel adds strength to the probability of a breakout. Once the upper resistance of the channel is breached with conviction, technical targets point toward a 60% to 70% move to the upside, making this a highly attractive setup for short-to-mid term traders.
Market sentiment is shifting, and as investor focus returns to quality altcoins, TUSDT’s setup becomes even more compelling. With more traders scanning for high-reward plays in the altcoin space, TUSDT's technical pattern places it in a strong position to capture breakout momentum. The alignment of price action, pattern structure, and investor participation creates a high-probability trading opportunity.
For those watching the altcoin market closely, TUSDT should be on the radar. A breakout from this descending channel could act as a catalyst for significant gains, aligning perfectly with the broader recovery trend forming in the crypto market.
✅ Show your support by hitting the like button and
✅ Leaving a comment below! (What is You opinion about this Coin)
Your feedback and engagement keep me inspired to share more insightful market analysis with you!

Bitcoin extended cycle, $120,000-$140,000 next july-augustBitcoin looks like its gonna be a good summer imo, too much people say it will a boring summer and we top in oktober-dec but what if we top in august and drop 50%, and sep-dec will be correction month, and we continue the bullrun end 2025 till q1 2026 and we print a top in q1 2026,

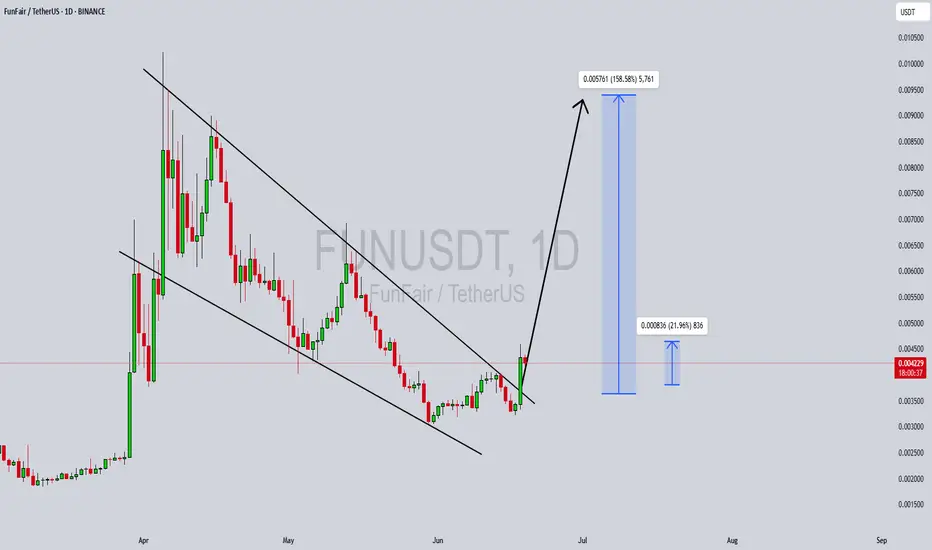
FUNUSDT Forming Bullish BreakoutFUNUSDT is currently showing a bullish breakout from a long-term descending channel, indicating a potential reversal and strong upside momentum building. After a prolonged downtrend within the falling structure, the price has now breached resistance with notable volume support, signaling that buyers are beginning to regain control. This technical breakout, combined with fresh investor interest, adds significant weight to a potential bullish continuation move in the coming days and weeks.
The pattern visible here is suggestive of a classic trend reversal. With volume expanding and momentum indicators turning bullish, the setup implies a strong recovery is underway. Historical data shows that when FUNUSDT breaks out of such structures, it often leads to parabolic price movements. The chart projects a target gain of around 140% to 150%, with intermediate resistance levels offering multiple potential entries and take-profit zones. The initial breakout is already attracting attention from both retail and institutional traders.
On the fundamental side, FunFair continues to be a recognized name in the blockchain gaming and decentralized gambling space. Its legacy presence, combined with renewed volume interest and community activity, is contributing to the renewed investor enthusiasm. Additionally, the project is increasingly being mentioned across various trading forums and crypto communities, further amplifying the probability of a continued upward trend.
Overall, FUNUSDT is one of the more exciting low-cap altcoins currently in a technical sweet spot. With the breakout confirmed and bullish targets ahead, this could be a great opportunity for traders looking to capitalize on early-stage momentum before wider market recognition kicks in.
✅ Show your support by hitting the like button and
✅ Leaving a comment below! (What is You opinion about this Coin)
Your feedback and engagement keep me inspired to share more insightful market analysis with you!
ALTUSDT Forming Falling WedgeALTUSDT has recently completed a breakout from a well-formed falling wedge pattern, a strong bullish technical signal that often precedes significant upward momentum. The wedge breakout is backed by a noticeable spike in trading volume, adding credibility to the move and indicating growing market participation. This classic reversal pattern suggests that a major trend shift could be underway, and price projections indicate a potential gain in the range of 70% to 80%, aligning with historical performance of such breakouts.
What makes this setup more compelling is the structure of the wedge itself—tight, consistent, and with clear lower highs and lower lows, followed by a strong bullish candle cutting through resistance. This is a textbook example of a bullish breakout where the price decisively exits the consolidation zone and starts trending upward. With volume confirming the breakout, many traders see this as an early-stage rally signal with room to grow.
Investor sentiment around ALTUSDT is gaining strength, particularly on social platforms and trading communities. This surge in attention could fuel further buying pressure, particularly as the breakout becomes more visible to retail and technical traders. ALTUSDT has shown the ability to move sharply during bullish phases, and this breakout could signal the beginning of a new leg higher, especially if it maintains momentum over the next few daily closes.
With strong technical structure, increasing investor interest, and supportive volume, ALTUSDT is shaping up to be one of the stronger bullish breakout candidates in the current market environment. Traders looking for high-reward setups may find this an ideal entry point with a well-defined technical framework and attractive upside potential.
✅ Show your support by hitting the like button and
✅ Leaving a comment below! (What is You opinion about this Coin)
Your feedback and engagement keep me inspired to share more insightful market analysis with you!

W pattern off the handle. #Bitcoin to 168K.From my most recent post of the Cup & Handle I see a W pattern. Price broke out of the handle to retest to confirm support creating a double bottom.
This is a very good sign to confirm the C&H for this bullish near future.
If we continue upwards and break the psychological resistance zone at 111K, I expect 168K within 3-6 months.
I attached the Cup and Handle analysis to the current.

Bitcoin potential short tradeThe world is unstable and the crypto market is consolidating, I don’t expect a break out to all time high or new lows soon. Just a ranging market for now.
Entry: $109,700
Stop-loss: $110,919
Take-profit: 102,500
Let’s see this probability 70% chance of playing out ✔️

SOLUSDT Forming Bullish FlagSOLUSDT is currently forming a classic bullish flag pattern on the chart, which is often seen as a continuation pattern indicating the potential for a strong breakout to the upside. The price has consolidated within a tight range following a significant upward move, creating a flag-shaped formation that typically precedes the next wave higher. This structure is being supported by solid volume behavior, which is an essential confirmation for bullish breakouts. Based on historical performance and technical projections, a 50% to 60% gain could be on the horizon if this pattern resolves upward.
Solana (SOL) has remained one of the strongest-performing layer-1 blockchain projects in the market, and current investor sentiment is highly favorable. With recent developments in its ecosystem and increased institutional interest, SOL continues to attract substantial inflows. The bullish flag pattern aligns perfectly with the broader market optimism and technical indicators such as RSI and MACD that are showing early signs of renewed momentum.
Traders should watch closely for a breakout above the flag's resistance line, as this could trigger a new wave of buying pressure. Key levels to monitor include the breakout point and potential price targets around the previous highs and Fibonacci extensions. The market structure remains bullish, and if confirmed by volume and market momentum, SOLUSDT may offer one of the most attractive risk-reward setups in the current crypto landscape.
In summary, SOLUSDT is technically poised for another rally, supported by a bullish flag and growing interest from both retail and institutional investors. With a favorable risk profile and strong fundamentals, this is a setup that many traders will be watching in the coming days.
✅ Show your support by hitting the like button and
✅ Leaving a comment below! (What is You opinion about this Coin)
Your feedback and engagement keep me inspired to share more insightful market analysis with you!

ARDRUSDT Forming Descending TriangleARDRUSDT is showing a powerful breakout from a descending triangle pattern, indicating a strong bullish reversal in progress. The breakout candle is backed by solid volume, reinforcing the strength of the move and hinting at a potential trend shift. Historically, this pattern signals the end of consolidation and the start of a significant upward rally, especially when confirmed by a volume surge as seen here.
With the price currently above key resistance levels, ARDR is now poised for a sharp move to the upside. The projected gain stands around 90% to 100%+, based on the height of the triangle formation and historical breakout behavior. This makes ARDRUSDT a high-reward setup for swing traders and mid-term holders who are looking for undervalued assets with upside potential in the altcoin space.
The Ardor blockchain project has continued to evolve in the background, with real-world use cases and innovative multi-chain architecture. As the market begins to price in utility-driven growth, coins like ARDR tend to outperform during bullish cycles. Moreover, increased investor interest in lower-cap, fundamentally strong altcoins is starting to reflect in the current price momentum.
Given the technical breakout and rising community engagement, ARDR could attract more attention in the coming days. Keep an eye on this pair as it potentially leads the next wave of altcoin rallies, especially if Bitcoin maintains stability or trends upward.
✅ Show your support by hitting the like button and
✅ Leaving a comment below! (What is You opinion about this Coin)
Your feedback and engagement keep me inspired to share more insightful market analysis with you!

UNIUSDT Forming Bullish ReversalUNIUSDT is showing a classic bullish reversal pattern, marked by a clear W-shaped recovery, which is often a strong signal for trend reversal in crypto markets. The recent breakout has come with good volume support, further validating the strength of this move. The price action suggests a clean structure of higher highs and higher lows, indicating the start of a potential upward leg. Based on the pattern and momentum, we can expect a price gain in the range of 50% to 60% in the coming sessions.
From a technical perspective, this bullish formation aligns with an inverse head-and-shoulders structure, often seen at the end of prolonged downtrends. The price has reclaimed key resistance levels and is now consolidating above them, a sign that buyers are stepping in with confidence. The clear breakout candle and measured move projection both support the potential target range of $12 to $13 in the near term.
Fundamentally, UNI continues to be one of the most recognized names in the DeFi space, and growing ecosystem updates have attracted renewed interest from both retail and institutional investors. The recent uptick in trading volume and social media chatter surrounding UNI indicates rising momentum and strong investor sentiment. As the market rotates back into high-utility tokens, UNI is likely to remain in the spotlight.
For traders, keeping an eye on short-term pullbacks or consolidation zones around $8.00–$8.50 could offer ideal entries before the next breakout leg begins. Overall, UNIUSDT stands poised for a major bullish continuation if current market conditions persist and broader crypto sentiment remains positive.
✅ Show your support by hitting the like button and
✅ Leaving a comment below! (What is You opinion about this Coin)
Your feedback and engagement keep me inspired to share more insightful market analysis with you!
