BTC: Pullback in UptrendBitcoin (BTC) technical analysis:
Trade setup : Price got rejected at $25K again and pulled back sharply to $20 support, which is also a 200-day moving average and a critical level to hold in order to maintain an Uptrend.
Trend : Downtrend on Short-Term basis, Neutral on Medium-Term basis and Uptrend on Long-Term basis.
Momentum is Bearish (MACD Line is below MACD Signal Line, and RSI is below 45).
Support and Resistance : Nearest Support Zone is $20.0K, then $17.5K. The nearest Resistance Zone is $22.0K (previous support), then $25.0K.
Bitcoinusdt

BTC Inverse head and shouldersBitcoin is currently following our inverse head and shoulders scenario, except that I think the right shoulder will be a little bit lower which is here 19159 - 18818

One more Trigger for BTC drop (Possible, not definite)This is a very accurate line in a logarithmic chart. this jump was just like a pullback to this line and a possible reaction is expected.
But if broken, there's no resistance until 29K.
Be precise and do risk management


BTC is struggling against a big dropEverything's on the chart. if you have questions please leave a comment.
please note that for high volume positions, you should wait for confirmations and then open your position. right now, it's still hard to manage the risk.

BTCUSDT 3HR REVERSAL TIME SOON.Currently forming a falling wedge which is a bullish sign, meanwhile if we check on the last 3 days we could notice that we have been forming a one time-framing low on the Volume Profile so we might need to retest down a little bit more. We believe that 21770 - 21555 Would be a good entry for bitcoin longs, it will be the area where we "Might" break above the falling wedge.

BTC: Short at high levels and long at low levels
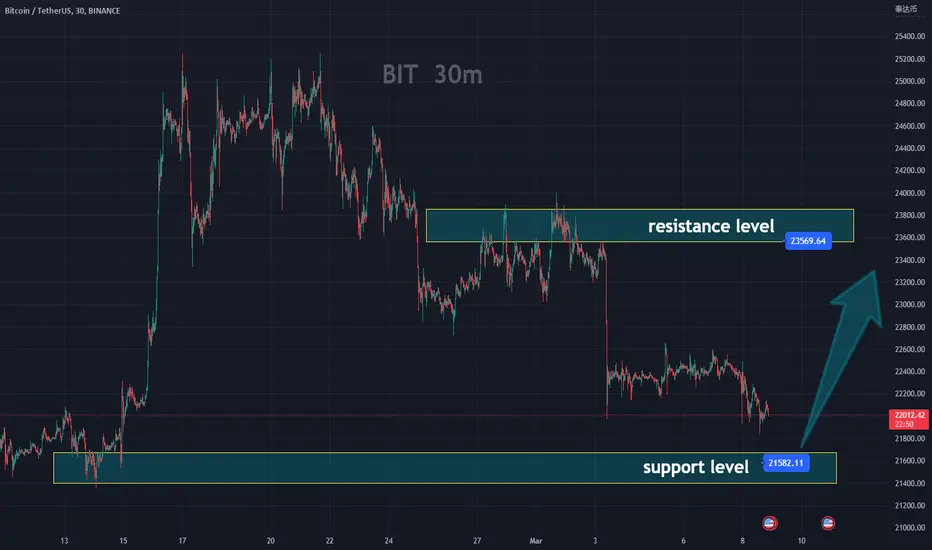
Yesterday, Bitcoin fell below the previous low during trading, hitting a new low. This indicates that the first phase of the decline is complete. However, there is a flaw in that it is still 500 points away from the critical support level of 21500. The probability of a rebound at this point is gradually increasing, but since the trend is still bearish, shorting at high levels is still the main strategy.
The trading strategy is to short at 23600, with a stop loss at 24200, and a target of 21500 to 21400. Alternatively, if it falls to 21400, go long with a stop loss at 20900 and a target of 23600.
Don't let past regrets interrupt your current plans, and don't let anxiety and worries disrupt your steps forward.
As winter fades into spring and the sun rises and sets, every moment is precious. By appreciating the present and living each moment to the fullest, we can reap the rewards of a rich and fulfilling life.
Bitcoin: Long at this position
Hello everyone, after a big drop, Bitcoin has been consolidating and today I'm sharing my view on Bitcoin using a 15-minute chart.
As you can see on the chart, there are clear and regular box ranges. Since there are such clear signals, we certainly can't ignore them. I have marked the specifics on the chart, and it will be clearer for you to compare it.
My trading strategy is to buy in the current range of 22300-21800, with a target near 22900-23800. This is relatively certain, and the probability of profit is relatively high .
The reason for this trading strategy is that I believe Bitcoin will rebound to fill the gap created by the recent big drop.
Thank you for your attention and support. I will continue to update my trading strategy. If you have any questions, please leave a comment and I will help you with the most reliable solution in a responsible manner.
Have a great day!

Bitcoin: Trend Forecasting
It is expected to find support around 23,000 and then begin to rebound!
I will continue to express my opinions on Bitcoin and update my trading strategies in real-time! Friends who are interested can follow me.
INDEX:BTCUSD

KINGUSDT ChartCurrently forming Cup and Handle pattern, this coin has got low marketcap, good chance of pumping soon.

Why Fetch.ai Token is the Future of Decentralized AI NetworksFetch.ai is a decentralized blockchain network that is designed to enable autonomous economic agents and smart contracts powered by artificial intelligence. The platform offers numerous benefits, including scalability, energy efficiency, interoperability, and a customizable programming language. Fetch.ai's AI-powered smart contracts can automate complex tasks and processes, making it a useful platform for a wide range of applications, from supply chain management to transportation and finance. The network's native FET token is used to incentivize participants and reward them for contributing to the platform. Overall, Fetch.ai offers a unique and innovative solution for those looking to leverage the benefits of blockchain and AI technologies.

Bitcoin Consolidating to go Lower AGAINBitcoin/1H Doing another Pennant
We are also in a down trend channel that I draw which everytime it reaches the end of the channel it makes a move.
Worth noticing when SPX was consolidating btc went to 25K now that spx started to move down btc coming down with it.
We could perform a fake pump and grab some liquidity before further downside.bearish momentun is just starting and we yet have to see bigger red candles ~13%
Please Follow,Comment,Boost if you find it informative.
Thanks for watching

BTC …ready for breakout ?BTC / USDT
Hello everyone
The chart tells everything
at the end of every bear markets i found this pattern is repeating:
First is Accumulation then spring or you can call it deviation or stoploss hunt or whatever you want …then massive pump … will history repeat itself ?
This is the third attempt at 25k and to be a valid breakout we should have a strong big green weekly candle to break all resistance … please be ready for volatility
Appreciate your support by likes and follow for more analysis

BTC Inverse Head& shoulder Pattern BTC is Creating a Inverse Head and Shoulder pattern on HTF.
if it creates and Break we can another Big Move

BTC Short term scenarioHi guys, this is not trading advice and the risk of this position depends on your previous trades, profits, and margins. It's just a scenario in completion of which, I can later explain some educational tips and instructions.
feel free to leave comments and ask your questions.

Bitcoin. The buyer keeps the priceHello guys, today we have a rather bloody day on the crypto market, the price of bitcoin fell below the support zone of $21500-21700. Now the price is testing the next support zone (indicated on the chart). I would advise you to stay away, because if any of the zones is broken, the resistance will be very close. I watch and wait for a better situation for myself, as a leopard waits for a good moment to attack his prey. All goodness

BTC possible turbulenceHi guys, in order to get the main idea, check out the last post (Its link is pinned below). It's an education post and all the details are explained.
feel free to leave a comment

Bulltrap idea for Bitcoin $25,000 then dump with CPIThis could very likely be a scenario for mm's to push price up when lots are bearish currently to generate enough liquidity to for mm's to sell at these levels before dumping the market.
I think its currently a beartrap and am longing one last time before the real dump.
NFA

Bitcoin BTC/USDTesting/tracking elliot wave theory. Please do not trade off idea without S/L. Not financial advice.
Chart timeframe is on the weekly. You can take a look at my previous weekly btc or daily chart. The info is pretty much the same, however on this chart I am zooming out even further for you. The chart on the daily for my previous chart is wrong though, I did not use the full data given to me with that chart. On this BLX chart I have the full data. On the daily I had the bottom marked around 20k and weekly I have it marked around 12k. Regardless of where I have the bottom marked, I will claim both of those charts to be off since I do not have the full data. On this chart I have data going back to 2010 giving me a more accurate wave count. Wave 1-5 on the smaller cycle took us about 11 years. I am expecting wave 3 to go a bit longer, about 12 years. Currently we've finished wave 2 or we're finishing it. Either the bottom is in at -77% or we have one last leg down to 12k, being -81%. Wave 3 price target is 180k (no moonshot).
A long position from today's price your R/R ratio: 12.52
Possible upside: 636%
Possible downside: -50%
A long position from 12k your R/R ratio: 120.33
Possible upside: 1241%
Possible downside: -10% I'd like to say none, we might wick a bit lower, but personally I would claim this to be the bottom and not use any stop losses.
I will dive a bit deeper into this chart below so I don't make this chart too sloppy.

24200USD Was The Top, Here's whyI've been bearish on Bitcoin since 22500USD. Now that the price is breaking through structure, I'm convinced that Bitcoin has reached its local high.
Why is the top in? The price went up for 34 days, which on average is half of a whole Bitcoin daily cycle. If we're lucky, the top will fall in the right half of the cycle, but this is too early to tell. We must wait until the end of February.
Secondly, we're seeing a daily bearish divergence on the rsi. This also happened at the first top at 65k.
Lastly, If you zoom into the hourly chart, youi'll notice that Bitcoin broke out of its rising channel, which is the structure i talked about in the first paragraph.

$ETC - finally breaking the ResistanceHello my Fellow TraderZ,
Look, $ETC finally breaking out of the ASCENDING TRIANGLE which has been forming on the DTF.
A daily close above the Resistance will take the price to the next levels - $27 - $30.
Mark it.
CHEERS!!!

$DOGE - will it follow $SHIB ?Hello my Fellow TraderZ,
Dog community tokens are barking superbly one by one, but the leader is lagging behind a lot. It will be interesting to see $DOGE rising up. $Shib has already shown us the previous night. Now its time to bark by the #DOGE.
Short term TP wpould be ~15%, if this high breaks, we can expect #DOGE to go $0.13.
CHEERS!!!

The Bull market for Bitcoin has been confirmedI am so overwhelmingly optimistic that I incessantly evaluate my emotions to ensure that my viewpoint is not erroneous. But how unrealistic is this when #Bitcoin is on the verge of closing its weekly candle at this current price level? We have breached the triangle and the 0.382 Fibonacci level. In recent days, Bitcoin has also established support at the 0.382 Fib level. Bollinger Bands are contracting, indicating an imminent explosive breakout. In my opinion, we can begin preparing to revisit the $35,000 price level in the upcoming weeks. That is the next resistance point, specifically the 0.236 Fib retracement.
Furthermore, the outlook on the monthly timeframe is highly favorable, which is in the process of closing within the next few days.
Wishing you all a thriving bull market, my fellow Bitcoiners.
Bull confirmed.
