Bitcoin: Tight range expected - Buying dipsBitcoin - Intraday - We look to Buy at 56866 (stop at 55988)
Daily signals are mildly bullish. Trend line resistance is located at 58000. Bespoke support is located at 57000. We look to buy dips. We look for gains to be extended today.
Our profit targets will be 59387 and 60287
Resistance: 58000 / 59500 / 60000
Support: 57000 / 56000 / 55600
Disclaimer – Saxo Bank Group. Please be reminded – you alone are responsible for your trading – both gains and losses. There is a very high degree of risk involved in trading. The technical analysis, like any and all indicators, strategies, columns, articles and other features accessible on/though this site (including those from Signal Centre) are for informational purposes only and should not be construed as investment advice by you. Such technical analysis are believed to be obtained from sources believed to be reliable, but not warrant their respective completeness or accuracy, or warrant any results from the use of the information. Your use of the technical analysis, as would also your use of any and all mentioned indicators, strategies, columns, articles and all other features, is entirely at your own risk and it is your sole responsibility to evaluate the accuracy, completeness and usefulness (including suitability) of the information. You should assess the risk of any trade with your financial adviser and make your own independent decision(s) regarding any tradable products which may be the subject matter of the technical analysis or any of the said indicators, strategies, columns, articles and all other features.
Please also be reminded that if despite the above, any of the said technical analysis (or any of the said indicators, strategies, columns, articles and other features accessible on/through this site) is found to be advisory or a recommendation; and not merely informational in nature, the same is in any event provided with the intention of being for general circulation and availability only. As such it is not intended to and does not form part of any offer or recommendation directed at you specifically, or have any regard to the investment objectives, financial situation or needs of yourself or any other specific person. Before committing toa trade or investment therefore, please seek advice from a financial or other professional adviser regarding the suitability of the product for you and (where available) read the relevant product offer/description documents, including the risk disclosures. If you do not wish to seek such financial advice, please still exercise your mind and consider carefully whether the product is suitable for you because you alone remain responsible for your trading – both gains and losses.
Bitcoinusdt

Bitcoin Target ?? where is the dump?Update Bitcoin
Just my personal calculation, please re-accumulate

Bitcoin: We look to Buy a break of 59019Bitcoin - Intraday - We look to Buy a break of 59019 (stop at 57996)
Trend line resistance is located at 58400. A break of resistance at 59000 should lead to a more aggressive move higher towards 60000. A break of yesterdays high would confirm bullish momentum. Daily signals are mildly bullish.
Our profit targets will be 61878 and 62778
Resistance: 59000 / 59500 / 60000
Support: 57500 / 56500 / 55500
Disclaimer – Saxo Bank Group. Please be reminded – you alone are responsible for your trading – both gains and losses. There is a very high degree of risk involved in trading. The technical analysis, like any and all indicators, strategies, columns, articles and other features accessible on/though this site (including those from Signal Centre) are for informational purposes only and should not be construed as investment advice by you. Such technical analysis are believed to be obtained from sources believed to be reliable, but not warrant their respective completeness or accuracy, or warrant any results from the use of the information. Your use of the technical analysis, as would also your use of any and all mentioned indicators, strategies, columns, articles and all other features, is entirely at your own risk and it is your sole responsibility to evaluate the accuracy, completeness and usefulness (including suitability) of the information. You should assess the risk of any trade with your financial adviser and make your own independent decision(s) regarding any tradable products which may be the subject matter of the technical analysis or any of the said indicators, strategies, columns, articles and all other features.
Please also be reminded that if despite the above, any of the said technical analysis (or any of the said indicators, strategies, columns, articles and other features accessible on/through this site) is found to be advisory or a recommendation; and not merely informational in nature, the same is in any event provided with the intention of being for general circulation and availability only. As such it is not intended to and does not form part of any offer or recommendation directed at you specifically, or have any regard to the investment objectives, financial situation or needs of yourself or any other specific person. Before committing toa trade or investment therefore, please seek advice from a financial or other professional adviser regarding the suitability of the product for you and (where available) read the relevant product offer/description documents, including the risk disclosures. If you do not wish to seek such financial advice, please still exercise your mind and consider carefully whether the product is suitable for you because you alone remain responsible for your trading – both gains and losses.

Bitcoin- Bulls need 55.500-56k zone intactYesterday I was wondering if Bitcoin has resumed its bull trend and so for, from my point of view, things are not clear.
The rally started at 53k stopped in 59k resistance zone and now Bitcoin is in a pullback.
If this is a correction for 53k-59k rally remains to be seen, but as long as the price is under the recent low we can't call for a resumption to the uptrend.
On the other hand, if bulls fail in holding 55.500-56k zone intact, we can have a continuation to the downside and I doubt the recent support will hold this time.
I'm out from any crypto trade at this moment and waiting for clarification

falling wedge on bitcoin!!!it's a bull trend?
what do you think?
Is this falling wedge going to happend?

Bitcoin USDT LONGfalling wedge formation is on the verge of work
The continuation of the rising trend may show us that the bull is not over at this point.
ALTCOINS VS BITCOIN ? The Altcoins vs Bitcoin have been growing since early this year.
As we saw recently, money leaving Bitcoin is now flowing to the Altcoins.
Just as money flows from Bitcoin to Altcoins,
When the time comes for the Altcoins correction, Bitcoin will rebound very strong.
Things will reverse:
After strong growth the Altcoins will have a strong correction as a group and this can serve as fuel for Bitcoin to shoot up.
The Altcoins going bearish is a bullish signal for Bitcoin .
I have some ideas where is the next move so let's in our chart :
-we have flag (bearish one) so what i'm trying to say that if we didn't manage to break the sup line we will break out and going very bearish ...
-what will happen now we gonna see if it will resist the 53200 ! in my predection we will visit 48300 and maybe break it too (~42000)...
Please Follow and Comment your favourite coin and i will do my research about it

TheKing still on his TrendSmall quick update without any indicators.
- TheKing stays for now on his recovering trend.
- Bounced multiple times on that trend to reach 161.8% Fibo around 50,000$.
- i separated Bearish and Bullish zones in 2 parts ( Green and Red ).
- if BTC breaks down under 47,000$ we could starts some bearish movements, but for now nothing confirmed as it bounced on that area.
Next TP Zones :
- TP1 : 54,500$
- TP2 : 58,500$
Be safe and play wisely.
Happy Tr4Ding !

Bitcoin uptrend ideaBitcoin has been forming a nice uptrend since mid-July and and is making higher highs and higher lows. Don’t be intimidated by that correction. This is healthy for further growth. In my opinion Bitcoin could go as low as 50k and then continues to grow. But let's see if this plays out.

Bitcoin on Black Friday (second part)Hello.
I'm doing another Bitcoin analysis, complementing the first one (or correcting if that's the case).
Now I'm trying to be more simplistic and objective, considering the most recent scenario, and discarding some indicators that say the same thing.
1. Graphical analysis
High Channel
The price is testing the support line.
Now might be a good time to buy.
Moving average of 9-week lows
The price has been above this average since July 9, 2021, and now it's enough to test it for the second time.
My prediction is that it touches the mean and pulls back up.
Volume
Strong volume can indicate a top or bottom.
Volume is low at the moment, which makes it clear that we have not reached the top as the market is making no effort to move the price.
So a new historic high is yet to be discovered.
Fib Time Zone
Plotting the Fib Time Zone, considering the last bottom in March/2020 and the penultimate top in April/2021, we are exactly in the 0.382 zone.
If you consider a new cycle, we have a milestone date on 10/January/2022 at 0.5, and then 0.618 on 21/February/2022.
Fibo 1 ends on 25/July/2022, but until then there's a lot to roll.
What I think is important now is the next 3 months until February.
I believe that after that we will have the crypto winter.
2. On-Chain Analysis
Price Drawdown from ATH
The percent drawdown of the asset's price from the previous all-time high.
When the value is equal to zero, we have no drawdown.
When it is less than zero we have a drawdown multiplied by 100 (percentage).
This is always considering the last historic high.
When the indicator hits the top several times at zero value, it indicates a lot of profit taking.
And when it reaches a value less than -0.50, it indicates a lot of loss taking (a huge drawdown).
Since nothing lasts forever, either for good or for bad, this indicator serves to demonstrate the exhaustion of both sides, bulls and bears alike.
If we look at the historic highs of December\2017 and March\2021, we can assume that we are looking for a new historic high and more profits.
Total Transaction Fees
The total amount of fees paid to miners. Issued (minted) coins are not included.
High fees mean paying to perform a transaction at any cost!
So far we don't have an indication that the world will end up looking around here, so for now the scenario is bullish.
Hope this helps in some way.
Greetings.

Neck to Neck #BTC #PriceAction 1,4 hrs chart we have a 24 hrs fight taking place
King wants to rest a bit for the next Moon Shot...
Happy Trading...
Rumor Has it, although Simple Price Action & Strength Index has some short term plans but Bulls are planning something big, no time to wait!!!

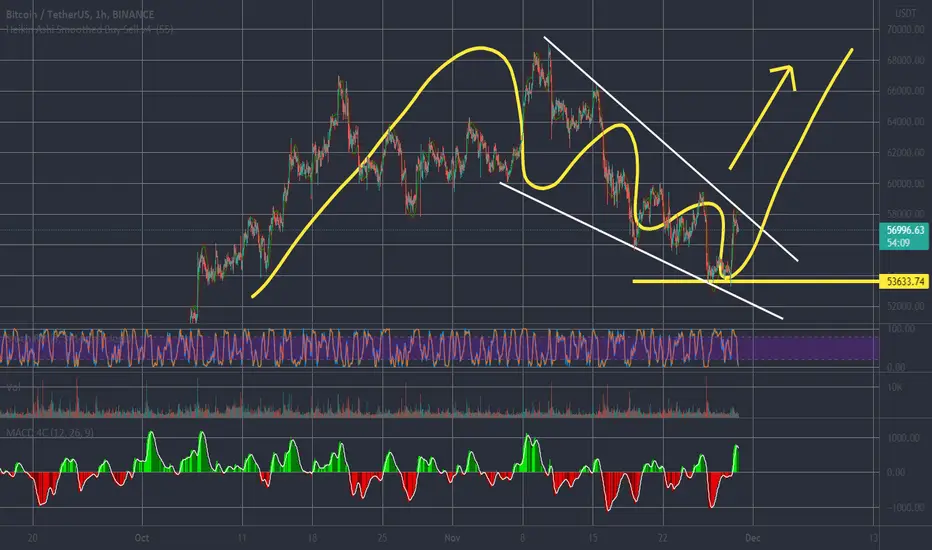
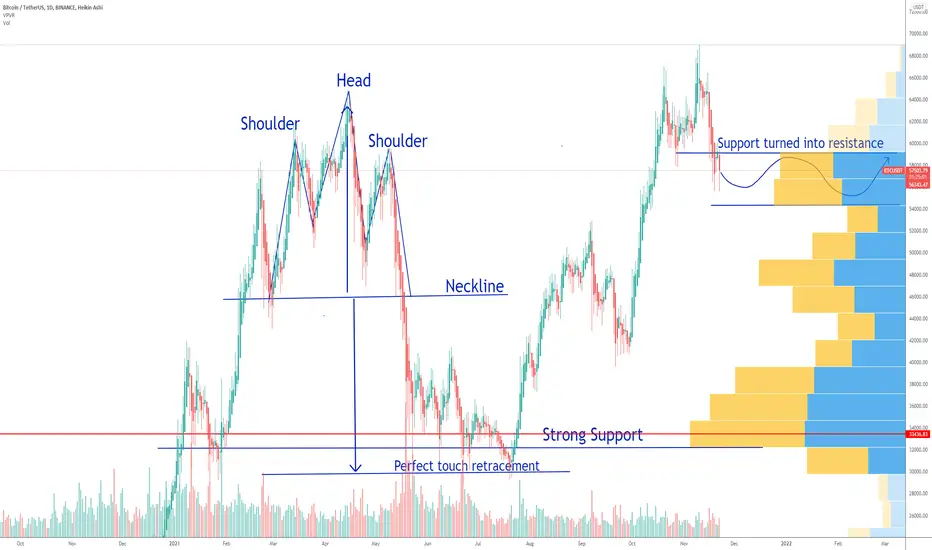
Bitcoin Support Turned ResistanceA key concept of technical analysis is that when a resistance or support level is broken, its role is reversed. If the price falls below a support level, that level will become resistance, which is the case for Bitcoin right now.
59100 is the new resistance and we also have a strong support now at 54300.
I think the price will bounce in this area for the next days, until we see a decisive move.
Looking forward to read your opinion about it.
BTC is not bullish yetFrom the daily chart, Bitcoin is not bullish yet. The upward movement has not broken through the upper bands of the weighted Bollinger Bands. Short term movement will indicated bearish trend. We can expect bullish trend when the price breaks above 63,130-ish.

BITCOIN Levels 2021-11-20BITCOIN important levels and very critical situation. Pay close attention to the break points!
Note : This is only a personal Idea and Not enough for trading!

bitcoin bearish or bullish ? 1H TIMEFRAME :
BINANCE:BTCUSDT
As you can see in the chart, we have a descending wedge.
Basically, the descending wedge breaks from the ceiling. If we succeed from the ceiling, we can expect the market to be a bit balanced. It is too early to take a bullish view.
we Can Pullback to Breakout Event . But we must also consider the sales pressure that may cause us to continue to decline

BTC Sellers Exhausted?A possible EIW and ABC correction move for BTC creating a double bottom at a strong zone of support

The Bullish Divergence Should Support Bitcoin.Bitcoin has formed a clear bullish divergence on the daily chart, which suggests a correction to the upside.
The 4h forecast seems to be forming a descending triangle with bias to break to the downside, however recently many bearish formations broke to the upside so I would rather stick with the divergence.
Break of pivotal level of $57820 will invalid this forecast.

Bitcoin – correction is almost over!Hello, everyone!
Last time I did the article about Bitcoin analysis, I told that the bearish movement was anticipated, when the price was $65000. If you executed short trade you are in profit now. Today I want to warn you that the bearish move is almost finished. now it’s time to find the entry point for long positions.
Please, read carefully the articles in the links under this article to make the chronology of the BTC analysis clear!
Approximately one month ago I did the analysis, where said that the impulse Wave 3 was finished an the Wave 4 is anticipated. I calculated the target price and even time when the Wave 4 ends before the new impulse wave to the upside. Now the price is approaching this area!
In another article I supposed that Wave 4 is going to be A-B-C-D-E triangle correction, but made a mistake. The Wave 4 is forming as incorrect A-B-C correction. Wave C is almost finished, the end of this wave is the best place for long trades. In 1-2 weeks we will see the last Wave 5 of this Elliott cycle. Be patient!
DISCLAMER: Information is provided only for educational purposes. Do your own study before taking any actions or decisions at the real market.

BITCOIN Levels 2021-11-17BITCOIN important levels and very critical situation..
Note : This is only a personal Idea.

AVAX doesn't care much about the dipAVAX is holding up quite well. Look at the comparison this month between Bitcoin and the former dip resistant SOL. Buy strength, means Avalanche

BTC usdt - Strong 60k SupportOn the 4h bitcoin to usdt chart we see that bitcoin has had previous strong support on the 60k mark.
Expect to see a rise in bitcoin over the next few days.
Buy the DIPS!

Bitcoin- Yesterday's price action provides a lot of cluesIn my previous 3 or 4 analyzes I said that in order to maintain its bullish trajectory, Bitcoin not only needs to stay above 63-63.5k zone but also needs to decisively break above 66k. Both of these have failed yesterday.
BtcUsd has started the week in a bullish tone, and after reversing from 63k, tried to reconquer 66k, and, as we all saw, failed and dropped to 63k support. This support is also broken now and the outlook for Btc is bearish at this moment.
From a technical point of view, 66k is now strong resistance and 69 ATH is a major top in my opinion.
I expect a drop of at least 15-20% for this crypto and a visit to 52k support in the medium term.
I will look to sell rallies against 66k

Bitcoin to Test Support at $64k with $62k Support Looking StrongPrevious ATH support lines shown at $64,300 with support corridor showing a low of $64k with tremendous support. Great buying opportunity if you ask me!
