Bitcoin 13/10/21: BTC Golden Cross Retest ATH, then $74k 🎯Bitcoin Update 13/10/21: BTC Golden Cross Road to $74k (18/09/21). BTC is showing strong support around 53k-55k, from here we expect a clear breakout above the 78.60% fibs and a retest of the ATH🎯@$64k! Currently BTC is only 12% away from the previous ATH. BTC is now back above 55k for the 2nd time now in 5 months. Please see previous analysis below. Happy Trading :)
Bitcoin Update 03/10/21: Since the 30th September, Bitcoin has grown 18%+ over the past 3 days. From the current price level Bitcoin is 33% away from the ATH . Scenario 1 didn't quite play out for BTC as we mentioned earlier during the start of the month (September). From here we can expect the Scenario 2 Push Phase to play out. A clear break from here with the 13 EMA crossing up above the 50 SMA will be further confirmation of this continued bullish momentum pushing above Key Resistance at $46k. September is historically a red month, and this year we saw this across the board from stocks to cryptocurrencies. The BTC Golden Cross experienced on the 16/09/21 signals very bullish momentum. From a technical perspective Bitcoin is in a Bullish market, further to this we have the Golden Cross for BTC which occurred on the 16th September on the Daily Chart (Historically every time we see this movement on the moving averages, we have experienced significant growth in BTC ). The Golden Cross signals very strong bullish momentum which could see Bitcoin back at the ATH price level after a clear breakout above the 61.80% Fibonacci which is a significant level for whale action as we see accumulation around this key price level range between $47k-$52k. From the current price level @ $48k, BTC is 54% away from the ATH price. We expect some explosive movement incoming in the next 2-3 months as we head towards eoy. Please see previous analysis below. Happy Trading :) 🎯
Bitcoin Update 05 /09/21: Bitcoin has been in a steady accumulation range between $46k-$51k for the past 23 days. From this key level we can expect continued bullish momentum towards the upside to the next key level of resistance at $57k. Currently Bitcoin is 25% from its ATH price @ $64k. If we can have a clear break of this resistance and hold above $51k flipping it into support we can expect a bullish run towards the $57k resistance, this move might be met with some heavy resistance above this key level as $58k-$60k is a key psychological barrier for Bitcoin . The next few months are critical for BTC as bullish momentum could see the 127.20 fib target at $74k. Please see previous analysis below :) Happy Trading!
$50K incoming again for the weekend 🚀, if we can break resistance and hold above $51k flipping it into support we can expect a bullish run towards $57k resistance. The next few months are critical for BTC as bullish momentum could see the 127.20 fib target at $74k. Please see previous analysis below :) Happy Trading!
Bitcoin Update 21/08/21: Road to $74k is clear, but first Bitcoin has to break above $51,068 and flip this into support for the next leg up to the 78.60% Fibonacci level at $57,125. If Bitcoin can flip the 61.80% fibonacci level into support we could see bitcoin approaching the $60K region looking to push for a new ATH . The 61.80% fibonacci level is a key resistance level and a level where we previously saw large amount of whale accumulation in the previous run before the May crash. In another possible scenario we could see Bitcoin retracing and consolidating in the short term but when we look on the lower time frame 4H, the swing call script has just triggered a strong buy signal showing continued bullish momentum for Bitcoin . It is official the Bitcoin Bulls are back!! Please see previous analysis below. Happy Trading :)
Bitcoin Update 14/08/21: Update: Currently 4% Gain from this Short-term Swing Opportunity, stops just below $43,812, TP @ $51,068 at the 61.80% Fibs, additional TP at the 78.60% @ $57,125 (19% Gain from current price level). Please see previous analysis below. Happy Trading :)
The Bitcoin Bulls are Back! After setting a new ATH @ $64,841 in April, Bitcoin experienced its the first major sell (some may say manipulated) off in this Bull Run Cycle (-50% from the top). We have been closely watching the BTC chart for a strong trend reversal signal. From the ATH @ $64,841, Bitcoin formed a triple bottom in the $28-30k region, the last bottom experienced on the 21st July is confirmed as our bottom here. The Swing Call Script gave further confirmation of the strong trend reversal as a Buy signal was triggered on the 4H Chart on the 22 July and further on the 6th August showing strong signs of bullish momentum back into the market.
From here we expect BTC to retest the current ATH @ $64k which is a 40% Gain from the current price @ $45k. Further to this, we can expect some heavy resistance between the 61.80% - 78.60% fibonacci level. A clear break past the 78.60% fibonacci level see BTC setting a new ATH at the 127.20% fibonacci level. Please see previous analysis below. Happy Trading :)
BTC finally testing the 200 SMA and is showing strong signs of bullish momentum as we see the BTC Bulls coming back into the market 🚀. After 4 failed attempts of trying to break above the key resistance @ $38,595 BTC has finally broken above this key price level. Since the crash BTC found its Bottom tanking down -51% on the 19th May to $28,787 from $57,777 and had previous retraced from the ATH price @ $64,841 to $46,814 (-27%). BTC has been in a whale accumulation zone for the past 27 days from 19th May to 15th June. Our Swing Call Script triggered a strong buy signal for #BTC LONG when the 13 EMA crossed up above the 50 SMA on the 10th June; BTC has since increased over 10% in just over 5 days. From the current price level we have longs positioned and the current TP 1 is at the 127.20% Fibonacci level @ $74,647 (85% gain from current price level) and TP 2 at the 161.80% Fibonacci level @ $87,122 (116% from current price level). Note the price targets are for long term swings, we may be in this accumulation phase a little longer. Happy Trading :). See previous analysis below.
Bitcoin Update 02/04/21 Next Target @ $66,953 13% Gain New ATH in April
I've loved charting BTC last Month, analysis has been quite spot on just waiting on our new ATH now @$66,953 13% Gain from current price level. #Bitcoin has found key support around $58k price level. It looks like the Bitcoin Bulls are back in the market. Worst case scenario from here in the short-term could see the price test the 50SMA, and breaking below this level would see another test of the 200SMA before the anticipated move to the upside and our target of $66.953 at the 127.20% Fibonacci level. See previous analysis below. Happy trading :)
Update 29/03/21 Bitcoin next Target @ $66,953 21% Gain
Nice bounce from the whale accumulation zone at the 78.60% Fibonacci Level. Looks like the BTC Bulls are back in the market.
See previous analysis below.
BTC Monthly Outlook Update (23/03/2021) Approaching Whale Accumulation Zone at the 78.60% Fibonacci level @ $52,371. Interesting next few days from here as a bounce from the 200 SMA at the whale accumulation zone could finally see us break through the key resistance at the current ATH level from 14/03/21 @ $61,690. April is set to be a very interesting and pivotal month for the cryptocurrency space. See previous analysis and monthly outlook below. Happy Trading :) #whaleaccumulationzone
Update 21/03/21: Yesterday the Bulls failed to push the price higher and we had a small retracement down from $59.5k to $55.6 where we found some support of the current price level (-7%). From here the worst case scenario would find us in a key whale accumulation zone @ 78.60% Fibonacci level $52,371. However this scenario is unlikely to play out and as expected from the previous outlook before, we expect the Bulls to come back in the market, pushing as further to higher highs as we have been consolidating around this key price range between $54.5K to the current ATH @ $61.8k. If we fail to break past the previous ATH , the bearish scenario may see a test of the 200 SMA around the 78.60% Fibonacci level, otherwise the Bullish scenario is still in play. Note that from this current trend from 28th January we have only tested the 200 SMA once and a bounce from this level may signal a much stronger bullish move towards our price target $77,335 @ the 161.80% Fibonacci extension and further $107,340 @ the 261.80% Fibonacci level. So far great performance this month from £BTC as March is usually quite a bearish month looking back at the past. April looks ready for us to really fly, testing the 161.80% Fibonacci extension , but note this may not be a straight forward push but all the fundamentals are pointing towards the $70K as our next significant area of interest for the Bulls, currently a 16% gain from the current price level would see BTC reach $66,953 127.20% Fib extension. See previous analysis from 1st March 2021 below. Happy Trading :) $BTC #HODL
*Update 20/03/21
#BTC Monthly Outlook Update from 1st March 2021; 13 EMA crossing up 50 SMA showing strong bullish sentiment as we are about to enter the last week of the month, expect the bulls to come back and to push the price higher. Currently the 127.20% Fibonacci Target ($66,953) has not been tested yet, but we expect some big movement in price over the next few days and further going into the last week of the month (Yes, it has been March Madness), 13% Gain from the current price level @ $59,390 to $66,953 127.20% Fib extension. Our next target after this is $77,335 @ the 161.80% Fibonacci extension . From our analysis at the beginning of the month It looks like scenario 2 has been in play, see below previous analysis from 2nd March 2021.
In addition to previous price analysis, the Cryptocurrency 'Super Cycle' is in play as we are just at the brink of global adoption. 2017/18 was the hype era, we cannot continue to set targets based on the price movements during the cycle mainly fuelled by hyper and euphoria, it is now 4 years later and real development has been happening behind the scenes, a lot of people cannot quite comprehend the growth and the different cycle that we are now in as Moore's Law of exponential growth can only give us a hint at the growth that is about to be experienced over the next 4 year cycle. An increased influx of capital injection into this now trillion dollar market will only continue, as Defi takes its hold on current Global financial infrastructure, and yes history repeats itself, We call this the 'Roaring 20s' just like before at the end of WW1, the pandemic has only accelerated the current adoption rate of blockchain technology. As some are already aware, the best time to grow a million dollar portfolio was from 2009 to 2019 just after the housing market crash. The second best time in our lifetime is Now! from 2021 to 2029 after the pandemic market crash. We are still very much Bullish for BTC to reach our EOY Target of $356,000, See below key fundamentals which support our bullish sentiment.
*(March 02, 2021 Update)
BTC is currently consolidating at 61.80 Fibonacci Level. BTC outlook for the month ahead is still very much bullish . Although the sellers have been in control of the market since soaring to a new ATH on 21/02/21, BTC took a sharp retracement as expected at these new level of resistance as well as a new ATHof$58,792 on the Gemini Exchange. As from historic highs we see a lot of profit taking occurring after 3 weeks of setting new constant highs from the previous low of the last push wave which saw BTC setting a high of $42K and then sharply retracing down to $28,787 where we found the previous resistance and also the beginning of the last phase which saw one of the greatest run of Bitcoin in history, reaching the current ATH of $58,792.
With the current push phase now over we find ourselves asking how low can we go from here and when do we expect to break past a new ATH . This outlook is based on 2 possible scenarios which could both play out. We have seen the 50% Fibonacci retracement level respected on the last 2 Push phases which both set new ATHs, the first being $42K and latter, the recent high of $58K. As we have seen a strong retracement over the past 7 days back down to the 50% Fibonacci, it may be time for the BTC Bulls to regain control of the market as the current fundamentals point to the 50%-38.2% Fibonacci level of key resistance as well as a point of accumulation for the BTC whales, more importantly the $39,000 mark when looking left at the previous key resistance before the parabolic move to the $58k ATH .
With this in mind, from the current levels we could see the price of BTC sink further before the much expected move which could see BTC testing the previous High of $58k and further pushing to the 127.20% Fibonacci extension level setting a new ATH @ $66,953.
Scenario 2 would see the current push towards the ATH continue but may face some resistance, and further consolidation expected around $46k-$49k as they are the key Whale Supports towards the upside, so a further retracement could be in play, possibly testing the 50% Fibonacci level, as well as the 50 SMA , with a bounce confirming an explosive move to the upside which could see BTC easily smash past the 127.20% Fib extension level setting new fresh Highs between $67,000-$78,400+ by mid to late March. Use the buy zone indicated to map out your position as a possible 52% gain is achievable from the Buy zone. Stochastics showing an extremely oversold market condition. Happy Trading :) *
Key Supporting Fundamentals for BTC:
Strong Interest of Institutional Players
A survey of institutional investors and wealth managers who already engage with bitcoin reveals that 85 per cent plan to increase their investment in the cryptocurrency over the next two years.
The survey, which was commissioned by Nickel Digital Asset Management (Nickel), a regulated investment manager connecting traditional finance with the digital assets market, also reveals that between now and 2023, 72 per cent expect professional investors in general to invest in bitcoin for the first time or increase their exposure.
Current Economic Instability
The policy of the US Federal Reserve and the economic instability that has arisen as a result of the unprecedented emission of new dollars may further play a role in the growth of Bitcoin price...10% of the $380 billion stimulus money could be going directly into cryptocurrencies and Bitcoin .
Digital Gold
Crypto currencies certainly look as if they’re here to stay. It makes a lot of sense to have them in an increasingly digitised world. While bitcoin has a strong tendency to polarise opinion, it has now gained acceptance among some of the world’s largest financial institutions and payments companies. MasterCard, for instance, has said it will begin supporting crypto currencies on its network later this year. PayPal already allows eligible users to buy, sell and hold bitcoin in the US and expects to roll out its service in other territories soon.
The Case For Global Adoption and New Reserve Currency
Cryptocurrencies promise to help solve problems that are particularly acute in emerging markets (EM). Their governments are often centralized but relatively unreliable, which destabilizes currencies, opens the door to profiteering middlemen, and erodes public trust. Blockchain, the technology behind Bitcoin’s decentralized network, promises to cut out the grasping hands of governments and middlemen, and speed up transactions with more transparency and lower fees. It is offering what many EM customers are desperate for.
The Development and Extensions of Blockchain Technology
Due to the nature of blockchain technology’s ability to benefit all parties involved in different business operations. Since it was introduced in 2009 through the application of Bitcoin , blockchain technology continues to attract not just the financial institutions of the world, but also other fields and industries in insurance , law, entertainment and the Internet of Things ( IOT ) applications. Several scholars and advocates have also strongly suggested the use of the technology in voting systems globally, medical records and vehicle registrations by the state to further increase efficiency, simultaneously eradicating fraud in many areas. This technology does not only aim to improve conventional business operations but can also empower the greater society out of poverty as 1.7 billion adults in the world remain unbanked. The widespread adoption of a cryptocurrency like bitcoin running on the blockchain would mean that anyone with access to the internet can send and receive value from point A to B without the need of a third party.
Although many Banks were very hesitant and in fact spread fear in the markets due to cryptocurrencies being linked to nefarious activities on the dark web. A recent study by Goldman Sachs suggested that the adoption of blockchain technology in facilitating seamless cross border transactions without the worry of fraudulent transactions could save up to $6 billion a year; as the new models currently being developed by the bank would mean inefficient payment and accounting networks would be eradicated.
Bitcoinusdt

BTC Buy the trend of higher lows.Bitcoin - Intraday - We look to Buy at 54828 (stop at 53788)
Daily signals are bullish.
The trend of higher lows is located at 54800.
We look for a temporary move lower.
We look to buy dips.
Short term bias is bullish.
Our profit targets will be 57888 and 58488
Resistance: 57000 / 58000 / 59500
Support: 56000 / 55000 / 53800

Cryotocurrencies, Bitcoin, Daily Chart, Trading signal, BTC Looks like a #short story for #BTC today likely to test the 51.5k support level. Short correction or drop in #dominance ready for #Alts to fly #Bitcoin $BTC

$BTC red line => stop-loss
dashed lines => minor suppor/resistance
If the trend remains below, sales will increase.
i am neutral now

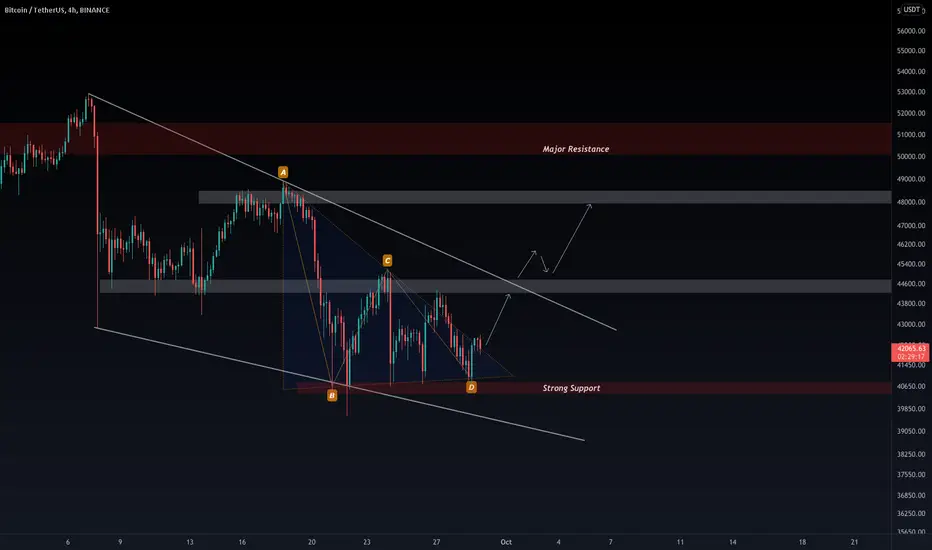
BTC: ABC Wave On TrackGood day to all profit makers!
If you find my charts useful please consider a follow and a thumbs-up as it motivates me to share and grow with you!
- If we do not hold support at 51-52K we can continue with this bearish trend and complete the ABC pattern
- Stong buy wall at 47K expected but not guaranteed to be enough to hold support.
- Possible ABC Correction Wave.
- We can also break the upside as the charts indicate with the green arrows
- Consult the chart for more information.
- Note:
- This is just my current idea.
- I am not a financial advisor! and this is not financial advice
- There is always a huge chance of different patterns taking shape in these ever-changing charts.
- My views and charts can and most probably will change!
- I can be 1000% wrong!
- Trade responsibly.
- Be focused.
- Have a plan.
- Stick to the plan.
- No FOMO.
- Take the time to study YOUR own charts and come up with your own ideas as you are going to trade with your money.
- Never trade what you are not willing to lose
- Remember Stop-loss is your friend.
- Smile!
- Good Trading and Good Luck
If you find my charts useful please consider a follow and a thumbs-up as it motivates me to share and grow with you!

4H $BITCOIN $BTC UPDATETP: 60361$
OR
TP:52868$
My feeling is that Bitcoin goes to 60361$
This is just a simple analysis based on Fibonacci and please do not consider it as a financial recommendation

BTCUSD - Bottom soon, Breakout after, HODL STRONGHello everyone,
Considering the Fibonacci Technical Indicators, we are close for a bottom, also, we can find the price right in a falling wedge, which can be easily broken, then we become bullish.
There are also Bullish Divergences on MACD & RSI Indicators, small, but there can be a good start for a new cycle.
Fibb zones can take up to a perfect price of $81,000.
Thank you for your time, HODL Strong
This is not a trading advice,
St.Gex

BTC sell the triangle downtrend.Bitcoin - Intraday - We look to Sell at 43888 (stop at 44604)
Price continues to trade within the triangle formation.
Daily signals are mildly bearish.
Short term bias is bearish.
The bias is to break to the downside.
Trend line resistance is located at 44000.
We look for a temporary move higher.
Our profit targets will be 41784 and 41224
Resistance: 42000 / 43000 / 44000
Support: 41500 / 40800 / 40000

BTC is ready to test new ATHs | $100k soon?Bitcoin price can surge above its ATH soon if the upper trendline gets broken with a daily candle above it. Two scenarios are shown on this BTCUSDT daily chart. I'm more optimistic about the bullish scenario which shows BTC's way to its ATH price and even $70k.
What are your thoughts?

another raising wedge for btcwe are forming raising wedge in 1h time frame its more likely to be break to down side but we cant loos hope can we ?


btc huge potentialif btc break its daily trend line sky is the limit be careful the volume is not super good we might regect

Cryotocurrencies, Bitcoin, Daily Chart, Trading signal, BTC BTC is once again battling uphill at key level of resistance. With weaker market momentum it’s unlikely to breakthrough. If 48.2 is tested and doesn’t provide the bounce needed, we are likely heading back to 44

Quick Update on BTCSupport Zone 1: 29k - 33k
Support Zone 2: 38k - 42k
Resistance Zone: 47k - 51k
The ultimate goal is to get above the resistance zone AND the bigger descending triangle and get at least 2-3 daily candle close above.
For now, BTC is struggling to stay within the resistance zone so we can't be too conclusive about the trend yet.
One thing to note is that we got a daily candle close above the 50 MA and 200 MA which normally is a bullish thing to do.
I have to add that the stock market continues to go down, and normally this impacts BTC, but for now it hasn't. We may see a decoupling for the next few months where BTC runs to new ATH's. When BTC went from 65k to 30k, the price of S&P 500 made new ATH's and at that time the stock market did not impact BTC. The theory is that BTC might do the same now where it runs to new ATH's where at the same time we see a correction in the stock market.
-------------------------------------------
What are triangles when it comes to trading?
Key points:
"1. In technical analysis , a triangle is a continuation pattern on a chart that forms a triangle-like shape.
2. Triangles are similar to wedges and pennants and can be either a continuation pattern, if validated, or a powerful reversal pattern, in the event of failure.
3. There are three potential triangle variations that can develop as price action carves out a holding pattern, namely ascending, descending, and symmetrical triangles."
-------------------------------------------
If you like the content, then make sure to comment and like the post :D
Follow me for daily profitable trading setups
BTC dictates the market. If BTC falls, then Alts will fall as well. Trade safe!

Bitcoin chart predication 4HBTC is now sideways to jump new high. it break local resistance level go down position of short

Btc Chart Analysis Btc Almost Near Our 1st Resistance. It's Followed Our Previous Analysis As Well..

Cryotocurrencies, Bitcoin, Daily Chart, Trading signal, BTC #BTC dominance breakout!! What will this mean for Alts?

Cryotocurrencies, Bitcoin, Daily Chart, Trading signal, BTC BTC finally breaking out. The move up past 45k will be a test of momentum as it is a strong level of resistance. Few bumps against the 45k with a small pullback, and we could be flirting with 47k.

Cryotocurrencies, Bitcoin, Daily Chart, Trading signal, BTC BTCUSDT 4HR Chart - BTC finally broke out of the falling wedge trading around $43k and looking to test previous resistance as support before a possible move up.

BTC Sell the downtrend.Bitcoin - Intraday - We look to Sell at 43688 (stop at 44464)
Daily signals are bearish.
Trades with a bearish descending triangle formation.
Trend line resistance is located at 43700.
We look for a temporary move higher.
Preferred trade is to sell into rallies.
The bias is to break to the downside.
Our profit targets will be 41404 and 40818
Resistance: 43000 / 44000 / 45200
Support: 42000 / 41000 / 40500

Cryptocurrencies, Bitcoin, Daily Chart, Trading Signal, BTC,AltsOver the last few days and on thr 4HR chart, BTC has tested and retested the $40,600 support level and showing some bullish momentum.
Provided BTC can break out of the $42,800 resistance it is likely to run up to $44,200. This has proven to be another tough level of resistance.
BTC "PITCHFORK TRADING STRATEGY" (ON THE ROAD TO 130K)Hello everyone !
Today the Black Cat Trader is analyzing BTC on a weekly chart.
What we can see :
- By using the Andrew's Pitchfork into on one of the first BTC impulsive wave back in 2012, we can identify a very nice long term uptrend for bitcoin (Low = 2,25 ; High = 1163 ; Low 198) . Thanks to PF, supports, resistances and possibilities for futur growths can be easily identified.
- By extending horizontal lines (purple) from previous ATH to lower lines of the pitchfork, we can clearly identify the potential zone where BTC could make its new ATH :
ATH (25 Novembre 2013) = 1172 $
Extended line (from ATH to the lower line of the pitchfork) = NEW ATH (19.680 $)
ATH ( 11 décembre 2017) = 19.680 $
Extended line (from ATH to the lower line of the pitchfork) = POTENTIAL NEW ATH (130.000$)
What we can expect :
Regarding the actual situation and based on the datas we have, we can expect two scenarios:
(N°1)
Bitcoin manages to break the intermediary lower median line of the pitchfork (which is actually a resistance) to turn it into a strong support to go higher. Then we can expect that bitcoin will make a new ATH located at minimum on the median line of the pitchfork (red one)
- Resistance : intermediary lower median line of the PF
- Strong support : lower line of the PF
TAKE PROFIT : 130 000$ ((Median line of the PF)
(N°2)
Bitcoin fails to break the intermediary lower median line. In this situation, we can expect that Bitcoin could bottom on the lower line of the PF which would be a very good opportunity to buy btc low.
Major support : Lower line of the PF
IF YOU LIKE THIS POST, FEEL FREE TO FOLLOW THE BLACK CAT TRADER AND LEAVE A LIKE
(D.Y.O.R)

livermore's speculative chart : longwe're in the accumulation cylinder with a widening mount stage. IMHO we are going to see a sharp increase in the price.
