💡Don't miss the great buy opportunity in BTCUSDTrading suggestion:
". There is a possibility of temporary retracement to suggested support line (54580).
. if so, traders can set orders based on Price Action and expect to reach short-term targets."
Technical analysis:
. BTCUSD is in a uptrend and the continuation of uptrend is expected.
. The price is above the 21-Day WEMA which acts as a dynamic support.
. The RSI is at 42.
Take Profits:
TP1= @ 57600
TP2= @ 59445
TP3= @ 61760
TP4= @ 65000
TP5= @ 67700
SL= Break below S2
❤️ If you find this helpful and want more FREE forecasts in TradingView
. . . . . Please show your support back,
. . . . . . . . Hit the 👍 LIKE button,
. . . . . . . . . . Drop some feedback below in the comment!
❤️ Your Support is very much 🙏 appreciated!❤️
💎 Want us to help you become a better Forex trader?
Now, It's your turn!
Be sure to leave a comment let us know how you see this opportunity and forecast.
Trade well, ❤️
ForecastCity English Support Team ❤️
Bitcoinusdt

#BTC Heading to my Target $63k!In my previous updates I told you guys that the price will soon break the $60k level+ and it already happened today! Read my previous update if you haven't.
BTC Update : The way price is holding up the 59.5k level this Scenario seems highly likely.
Invalidation will be a close below $59,120!
Do hit the like button and share your views in the comment section.
Thank you


BTC usdt - Slight retracement then upwardsHere we're seeing a slight retracement after the all time highs, then upwards movement to the one hour resistance and beyond.
Trade volumes are good. EMA is cooling a little.

BTCUSDT LONGMoonshot incoming.
Could close at ATH.
Nuance in the candles
Candle has never closed this high on BTC
inflation incoming. 60K first target.

BTC usdt - All time highsFantastoc growth from bitcoin.
Pushing resistance levels to all time highs.
We'll see a slight cool off from the ath's on the 1h chart.


💡Don't miss the great buy opportunity in BTCUSDTrading suggestion:
". There is a possibility of temporary retracement to suggested support line (58343.20).
. if so, traders can set orders based on Price Action and expect to reach short-term targets."
Technical analysis:
. BTCUSD is in a uptrend and the continuation of uptrend is expected.
. The price is above the 21-Day WEMA which acts as a dynamic support.
. The RSI is at 76.
Take Profits:
TP1= @ 61023.20
TP2= @ 63443.70
TP3= @ 65960.30
TP4= @ 68865.10
TP5= @ 72213.70
SL= Break below S2
❤️ If you find this helpful and want more FREE forecasts in TradingView
. . . . . Please show your support back,
. . . . . . . . Hit the 👍 LIKE button,
. . . . . . . . . . Drop some feedback below in the comment!
❤️ Your Support is very much 🙏 appreciated!❤️
💎 Want us to help you become a better Forex trader?
Now, It's your turn!
Be sure to leave a comment let us know how you see this opportunity and forecast.
Trade well, ❤️
ForecastCity English Support Team ❤️

Plain and Simple Bitcoin Daily Analysis - 3/12/21 - BTCUSDTPlain and Simple Bitcoin Daily Analysis - 3/12/21 - BTCUSDT
Market does not care what people want.
People want 60K so bad.
Market takes decisions.
Allright, we got 2 bearish divergences popping up, and a lower high on the bigger scale.
That's not good at all to get that lift to 60 K.
Price is attracted by the 48700 K level, that we might head back for the coming days.
I don't feel any euphoria around, so, ...
Back in february, people ignored RSI and kept buying - euphoria was at peek -
Now it seems like something else.
That's a day to be carefull, more on the short side, with extra wide SL from 58250 down to 55366
So..
Have fun, trading today !
Thanks for reading !
Stay safe.
And remember, the market is a b..ch, trying to take the money right out of your pocket for a cheap and short moment of pleasure.
See you all tomorrow, and don't forget to ......
smash that like button !
And don't forget to subscribe to my feed to get my daily analysis in your Trading view chart
Comments are also welcome anytime.
And go check my socials down there if you like this analysis!!!!

BTC usdt - pushing all time highs again (ish)Strong BTC growth
Solid EMA. Solid upwards trendline.
If it can break that 1 hour resistance then it'll be ATH time.

BTC usdt - Bitcoin pushed the 1 day resistance!Strong growth with BTC/usdt
Good ema, good trading volumes.
Natural pullback after testing the one day resistance. Expect a further climb after a retracement.
Buy the dips.

#btcusdt #4h #bitcoinHi guys..its the latest analyze chartof btcusdt in 4H .if you are interested any crypto that you want analyze with me and any questions please do not hesitate and comment below the chart!
if u like it press like-comment and folow me.thx

BTCUSDTHello to you all. Mars Signals team wishes you high profits at all times.
The price has been able to break the 51,300 resistance and we can say that it’s bullish run has begun. The next target would be around 68,800 but do not expect the price to have a solid growth. We will experience some fluctuations in the middle.
Warning: This is just a suggestion to you and we do not guarantee profits.
Wish you luck!

BITCOIN scenarios 4H timeframe 07th of March 2021Hi guys,
Bitcoin looks choppy so I'm not entering new positions for now. I do think the two scenarios are as follows :
Bull : we get a close over the 54.000$ and go on to re-test the 58.000$ levels
Bear : we get rejected once again at the 52.500$ levels and we go searching for buyers lower, in the 41.000$ levels.
Trade safely my friends !
PS : my previous idea played out perfectly, you can find it in the related area.

Like Axl Says ''All we need is just a little patience''Chart is clear. We gonna see new ATH but be patient.
I'm just a trader like u guys, and I just wanted to share what I saw here. Don't take it as a financial advise.

#BTC weekly btc still hold the 46800$ support on weekly everything's look ok, as soon as hold can be range between support and 50k
me personally bullish as soon as hold the support and looking for 70k ATH , but at the same time no volume in the market
and if breakdown we have a strong support around 40k
Bitcoin is just in another corrective phase.Short term downtrend is still active (4h time frame), however this is nothing unusual as Bitcoin is in corrective phase.
In order to break out of this corrective phase, Bitcoin has to break the downtrend line at $51000 and ultimately the previous high at $53000 to break the trend of lower highs.
However, this correction is a good opportunity to accumulate or buy the dips of some desired alternative coins with some decent discounts as alt traders have weak hands.
The question now is, will there be another retest of the 50 EMA?
No matter how bullish the recent news are, market is market and another retest of $43000 can be easily seen in the next days as the short trend is a downtrend.
Looking at daily indicators.
Wave indicator, MACD (26 and 9 EMA) is still in a corrective wave and as we are looking the chart now, the selling pressure seems to be increased as histogram is trying to print a taller tick (more vibrant red). However, the daily candle is not closed yet so this would be an early conclusion, the important thing is that we are still in corrective wave on daily time frame.
Demand indicator, RSI is in a good position as there is no hidden bear signal or any other reason to be bearish. As long as RSI stays above 40, the overall daily uptrend remains active.
Trend indicator, 20 and 50 EMA’s are pointing towards a clear uptrend but as the price is below 20 EMA we are only speaking about an uptrend, instead of a strong uptrend. Again nothing uncommon in a corrective phase.
In summary, Bitcoin is expected to see some more sideways in the next couple of days before any stronger moves to the upside, which are highly expected to be seen once again.

Three senarios for bitcoin right now, be watchfulWarning: our thoughts are ours; not financial advice.
A careful observation of the bitcoin chart this morning, and we can see that there are three case scenarios for bitcoin at the moment. One must play out in a day or two. Maybe slightly more, but very soon.
Scenario 1: ABCD
Points ABCD is an uptrend channel that started on January 27, 2021. This is the second time we are testing the lower end of the channel in the past six days. If this trend must continue, we must close above that line today.
Scenario 2: BEDF
Points BEDF is a downtrend channel that started on February 21, 2021. If we break the support line of ABCD to the downside, we will be confirming the BEDF downtrend line and we should see bitcoin price continue to decline to the $42K - $41K in the coming days.
Scenario 3: BDE
Points BDE forms a triangle. Breaking out to the upside of this triangle means we are confirming the ABCD uptrend (scenario 1). Breaking out to the downside of this triangle means we are confirming the BEDF downtrend (scenario 2).
How we plan to play this.
If scenario 1 holds true, then we'll be buying a large number of bitcoins at the breakout to the upside.
If scenario 2 holds true, we'll wait for a bounce at the bottom line of the channel and take the trade to the top line of same channel.
If scenario 3 plays out today, we'll just wait for a breakout to the upside or downside, then take our trades accordingly.
Good luck with trading this week.

BTC/USDT - heads and shoulders - what to expect? BITCOINHello dear friends.
New near-term goals for bitcoin for the day (this data is sent to me by my bot assistant.
Within 1-3 days. The price will be adjusted, as well as one of these boundaries will be broken.
Upper limit: 50555 - 51050
Lower limit: 43650 - 44550
BTC / USDT coin under consideration
Where I want to start is that I'm wrong, and a few days ago, we had 3 negative positions where we lost a little money. But the loss was returned, earned, and for the given moment we are in a good plus.
So I write right away - this is not financial advice, this is not a recommendation, and I am also mistaken, therefore, you should not take everything as if I forced you.
For this coin, the work takes place in a channel, a very large channel of accumulation / distribution of positions between a large player and simple traders.
The chart shows that the price was lowered to the middle of the channel, and the area was tested from the bottom up.
This suggests that the buyer will defend this zone in order to bring the price back to the 49000-50000 level.
Also, according to the FIBO grid, the price reached just the 0.618 level - where this level is corrective.
But I implore you to be extremely careful now, since the fact that the price is consolidating in a descending, widening wedge - the price may drop even lower.
All you have to do is slide past the 48250-48580 level now. It is the turning point.
If the price is fixed there at 2h TF, you can try to look for a place for a long.
To work out the pattern - HEAD AND SHOULDERS (secondary)
Another note is that at 30m TF - the price is consolidating in an expanding wedge, with a tightening to 46300-46600. If this zone is broken and the price reaches the level of 46000 You can look for a place for short positions.
The volume in the market will weaken, liquidity in the market suggests that something very strong and inevitable will happen soon ...
12CH TF - forms a global inverted head and shoulders pattern
But I have a premonition that we will fall very strongly, having collected liquidity, making a correction by 40-50% from the top, and then it will be possible to look for a place for long positions.
Globally - for me it is a short, if within a day, then lower the price to the level of 46000 and below, and even test the 45000 zone.
Since it is the 45000 zone that is the trend reversal now and the price hike down to 43500-43850
This Channel is not financial advise, It's My opinion and My observation: @opptrade
❗️❗️❗️Disclamer:❗️❗️❗️
Dear friends, traders.
My trading ideas here are not financial advice or coercion into action. I am not responsible for your trading and how you follow all aspects of correct trading.
- I do not recommend that you trade AT ALL if you do not know what risk management is, money management.
- I do not recommend that you trade without a STOP LOSS.
- And I'm not responsible for your "make millions of dollars fast" gag
- I am only showing you the charts that suit me for certain positions.
- For each position - RESPONSIBILITY LIES ON YOU.
If you don't use all of the above, your deposit will soon become $ 0
- Therefore, if you decide to follow my positions - Take responsibility for where the bad outcome may be.
In time, i to bee wrong too, and have a loss.
But with the correct observance of the indicated points, which trade with me others traders - they earn (NOT IN A DAY, but in the medium, long term)
I am only showing you how this or that scenario can work in trading.

BTC Market Overview (2021.3.3, bullish reversal)Hi, this is Walnut Trading.
Here's our view on BTC market.
As could be seen on the chart above that the pair is trading above a strong support level that is 43425.
In addition, the close of March 2nd was a bullish engulfing candle, which supports our bullish scenario.
Therefore, we are bullish as long as the pair is trading above the level mentioned above.
Our targets: 52k followed by 54555.
On the other hand, if the level of 43425 is broken, it might continue going downwards to reach 40k and even 38k.

Bitcoin to 40000 - 39000 And then it will break 58,35238000 - 40000 : After 1 - 2 Week .
And then it will break 58,352.

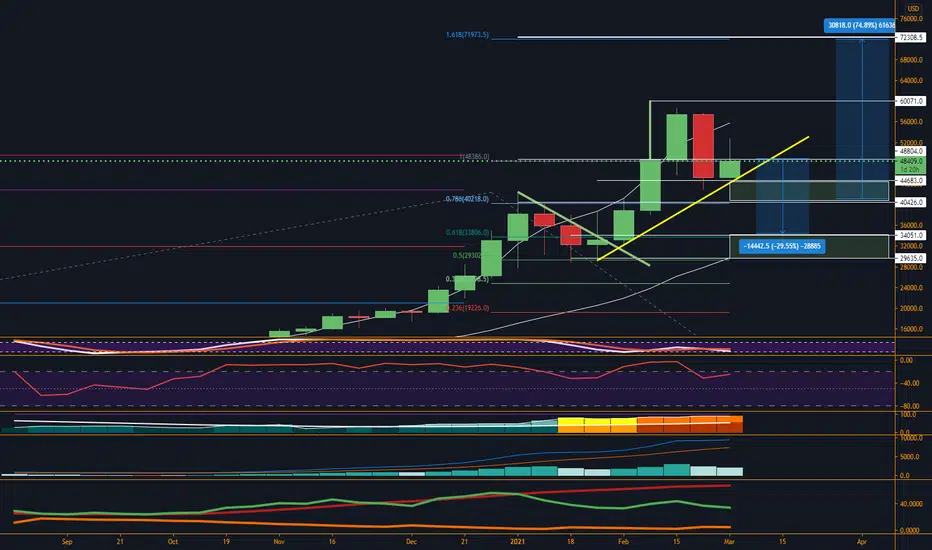
Bitcoin Bearish Scenario before 100KBitcoin just hit the top of its major channel and rejected with an engulfing weekly candle similar to the top back in Dec 2017 bull-run.
The last bull-run in 2017 ended with a %958 growth in price from $1,800 to almost $20K and made a correction of %67 (0.382 fibs level) before the crash caused by Silk-Road shut down.
Now Bitcoin just went up as %958 from the last crash of March 2020 to almost $58K.
If the market cycle repeats itself I expect a %67 correction to 0.382 Fibonacci level which is at $20K and the mid-line of the major channel and the bottom of the red ascending channel before the next top at $100K in 2022.
This analysis will be invalidated if a weekly candle closes above $62K
