BTC usdt in trend lines to 60kNice growth from BTC. Next target is the 60,000 mark with strong trading volumes and healthy EMA we will see this.
Bitcoinusdt

BTC/USDT - 1 TRILLION $ Hello dear friends.
I want to congratulate each of you, as we are the first of those who see the history of cryptocurrencies.
Bitcoin has reached $ 1 trillion, and the price continues to rise, according to my analysis.
Congratulations to all on a good profit.
Although, there was a moment when I was wrong.
We look forward to continued growth, stop loss at breakeven.
You can find more profitable analyzes and analyzes on my channel, link in Bio

BTC usdt holding the trendline upwardsSeems to be a bit of consolodation in the 4 and 1 hour charts.
EMA is slowed down.

BTC buy the uptrend.BTCUSD - Intraday - We look to Buy at 49745 (stop at 48789)
Daily signals are bullish.
Daily signals for sentiment are at overbought extremes.
Trend line support is located at 49800.
We look for a temporary move lower.
We look for gains to be extended today.
Trading within a Bullish Channel formation.
Our profit targets will be 52496 and 54381
Resistance: 52000 / 53000 / 54000
Support: 50500 / 50000 / 48600


BTC usdt to range up to the 55k areaGood strong EMA and trading activity in an upwards channel for bitcoin usdt.

Bitcoin 100k ScenariosSo here you get my view on 4 scenarios to go 100,000$. i made it very simple in graph. Don't check the live price of BTC on this analyse cuz i used BLX index.
1. Greedy Scenario (Green) :
- BTC break 50k now and still have FOMO Power and go straight to 100k.
2. Optimistic Scenario 2 (Yellow) :
- BTC will pass 50k hardly and retrace around 38K (61.8% Fibo) and back up stronger to Break 50k.
3. Realistic Scenario (Orange) :
- BTC will pass 50k and retrace to 20k first before restarting his pump.
4. Sad Scenario (Red) :
- BTC will retrace to 9K ish ( EMA300), this is the Strongest support for BTC.
i am naturally optimistic on BTC so i would bet on... Scenario 2. Let me know what you think in comments.
Happy Tr4Ding !

BTC/USDT IS TRYING TO FIGURE OUT ITS LIFE 🐝Hey hey my friends 👋
Waiting to see what the king bee does 🐝
Must break above and hold otherwise we make a move lower and try and consolidate we keep bouncing off the .618 fib so thats bullish but still waiting...could be starting to form a head and shoulders here also 🥱
As always, be safe 🦺

BTC usdt still in the pathway to $50kStill good growth from BTC despite some drops.
Still within the $50k channel with good EMA and trade volumes.

BTC usdt on track for the $50k markStrong upwards movement for BTC usdt.
Will we see the $50,000 bitcoin this week?

BTCUSDT seems set to hit 54k-57k soon. Levels I am watching.Price action on BTC is looking really bullish IMO.
As long as price do not break below 42 - 44k area, 54-57k should be within reach in the next few days.

BITCOIN PULLBACK POSSIBLE 🩸Hey hey my friends 🤠
Hate to be the debbie but, if we dont break to the upside of this we have some downside ahead of us! 😓
That is okay though! We can find some good scalp options and get some good entries on these overbought altcoins 🥳
If you have altcoin positions open and in profit move stop loss into profit, recommended ✔️
Lets watch the show 🎬

BTC usdt to level up to $50kChannel looks to be showing a rise to the $50k area
Strong market and EMA.

BE CAREFUL PLEASE, smart money is watching youThis zone in which we are now is a really tricky zone, so attractive for the smart money to control the price and to drop the chart, so that they can make sure that no one else is owning bitcoin.
be extra-careful.
ADVICE: do not open new positions until Sunday. and stay tuned for the next instructions.
Only continue managing your already bought assets.
if it keeps going up, that's okay. but listen and repeat: in the crypto market, FOMO is more dangerous than FEAR
Follow and comment

BTC usdt - Price correction after the Elon Candle?We saw massive gains after the Tesla announcement of their $1.5 billion investment into btc.
Is this a price correction after this news?

BITCOIN BTC 15M CHART MOVEMENT IDEA - BTCUSD BTCUSDT BTCUSDC XBTBITCOIN BTC 15M CHART MOVEMENT IDEA - BTCUSD BTCUSDT BTCUSDC XBT

BTCUSDT - Fly to 300kI posted this chart before.
Since then, it has grown by 150%.
It's late to buy now.
only if you have an entry point for the strategy.
Be sure to use a stop loss.


BTC usdt to climb to the $42k marktight support and resistance levels indicate a breakout of current resistance.

BTC usdt still trending upwards...BTC usdt still trending upwards but there is a bit of indecision and see,s to be consolidating


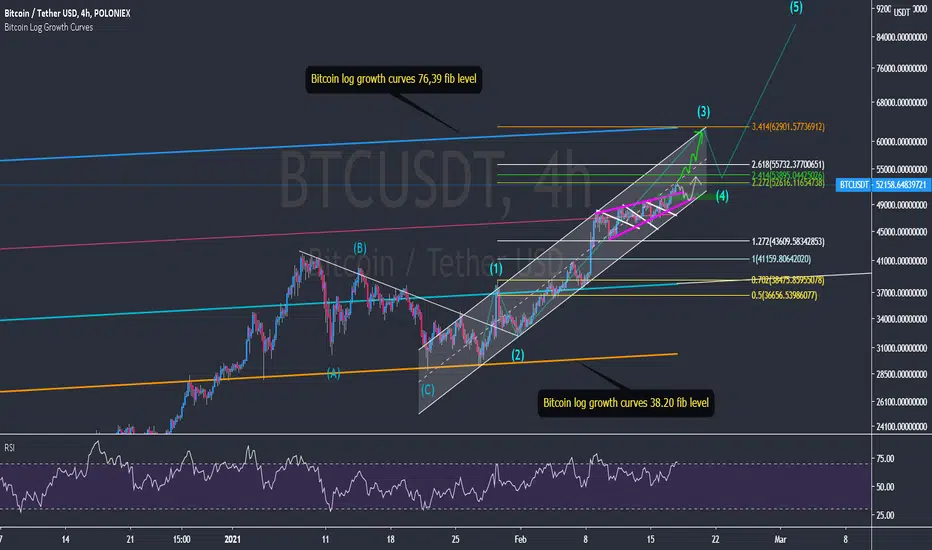
60000$ is the new target for BitcoinBitcoin is in the third wave of a cycle which is started form March 2020.
But if we consider the last impulse wave which started from Sep 2020, it seems that the third and forth wave has been finished and the new impulse is expected.
(the ending point of the forth wave can be easily fined by the help of retracement and extension fibonacci and also EMA50 which is shown with blue box)
Therefore, 4h and daily chart are shown that BTC is started a new wave with short time and long time targets.
