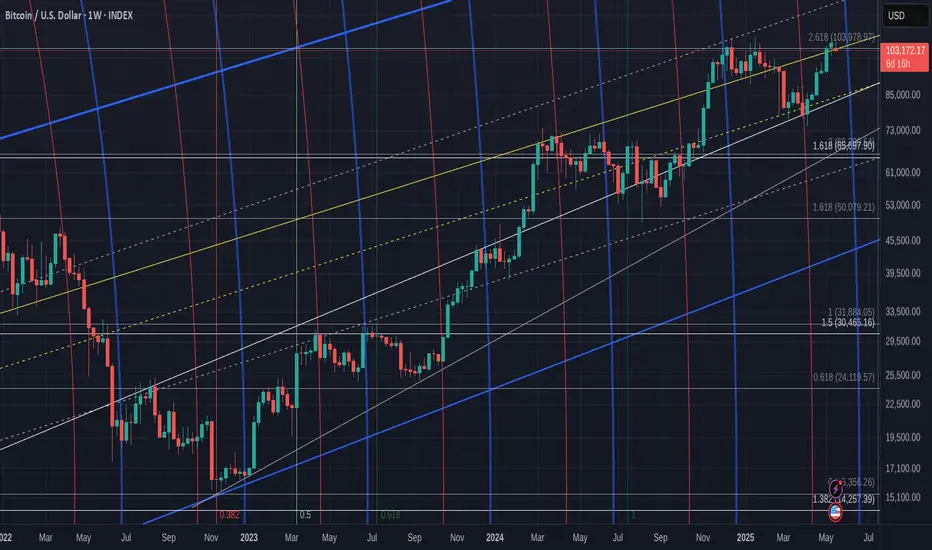
Bitcoin Closed the week with a strong Green candle...now ?PA has been trying to get over that bold trendline since Feb 2024.
It is the same line that PA used back in 2021, to bounce up to the Cycle ATH in Nov 2021.
And we have begun th e week just on Top of it, as we can see in the Zoomed in version of the chart below.
This week is a Big one in many ways.
We also have the Month close today and currently, we have a Big Green candle for that .
If we close with that, historically, it points towards an unsettled summer or a Big push en-route.
More on that tomorrow.
The weekly MACD still has room to climb but I still think we are to see a repeat of where that arrow points.
Th weekly RSI is also in Mid ground and can move in either direction
One thing that has really caught my eye however, is the Volume Delta
See how this is reducing - Could this be the Calm before the Storm ?
And that storm could be Bullish or Bearish. We do have a number of lines of resistance overhead that could prove difficult.
So, hang in there.
My personal opinion is that we are going to see apull back in the near future,,,,,and if we close the month green today, that WILL be next week
Bitcoinweekly
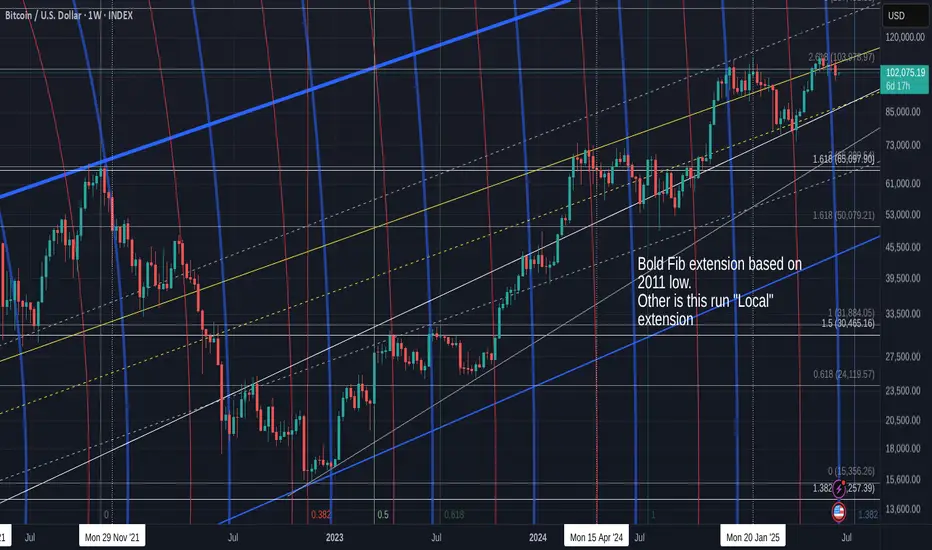
Bitcoin Closed week RED and opens Green but is back in channel
As the title says, BTC PA has fallen back in channel that offers a potential low in the High 80K should confidence fail.
PA also lost support on the Local 2.618 Fib extension.
This is a shame and poses potential problems reclaiming that.
I will say, that I do not consider this a long term Bearish beginning but it could certainly add to the "Calm" Summer I have talked about.
I say "Calm", that does depend on the world not entering a level of Madness.
The Zoomed chart below shows more detail
Here we can see clearly how PA got rejected off that upper trend line, fell through the 2.618 and is currently being rejected by it.
The potential for a further drop does exist and if we repeat the "Pattern" we have since the beginning of 2024, of bounce off Lower trend line, get rejected from Upper zone, re test lower as support and bounce again, we can expect to revisit 89K
This idea is supported from this LINEAR Daily chart
The dashed Trend line that is arrowed has origin in Sep 2024 and was also used again in April 2025.
That intersection the arrow points to is the intersection with the current supporting Fib circle at around 88500 USD
None of this is certain but these levels exist as support.
PA also has the ability to move higher
The Weekly MACD below shows us how MACD is turning down towards its signal line ( red)
We did this before in Jan 2024 ( Arrow) and The MACD bounced.
We talked about this possibility a few weeks ago But on a Daily MACD, things do look a little different.
The FEB 2024 looked like this, Bullish, rising and above Neutral
Currently, the Daily MACD looks like this
We just fell below Neutral and the Signal line just hit it
We may seea bounce but we need to have the idea that this may continue to drop a little further.
But the White bar on the Histogram shows us some recovery is currently in progress
We will have to watch the rest of this month closely. This time next week is last day of month.
I have mentioned a number of times that a small RED Month candle would be potentialy good.
We are currently Only just GREEN, so a further Drop in price is actually almost expected this week.
Interesting days ahead
Bitcoin closed week RED but that is OK, it was closeFor the last 3 weeks, Bitcoin has been in a tight range and each candle has been small body and long wicks, showing indecision and uncertainty
This close up chart shows how these 3 weekly candles have occurred at the intersection of a Fib circle (blue) and This alone could explain these "wicky" candles... The Bulls have been fighting hard to keep PA up and to not let it slide down that fib circle, as is normal the majority of the time.
.
We shall find out this week because, now, there is not a lot to stop the Bulls trying harder.
The FED will let us know the decision on interest rates on 18th.
This will likely cause a reaction in markets and I think we are most likely to see Rates remain static.
PA is currently on Support and remains above the 2.618 Fib extension.
All is Good
The MVRV (Green) and Z Score (yellow) can be complicated to fully understand but what is important to understand here is how the Yellow Z Score is still above the Green MVRV. this remains Bullish. We should notice how Both are falling and we wait for them to cross back over that falling line of resistance.
Currently, This chart shows us that Bitcoin has a slightly undervalued price. The higher we go, the more Oversold, Undervalued/ the top is the opposite, overbought / over valued.
The MACD is showing us a s;light levelling off
For me, I think this is similar to what we saw in the end of 2024. The MACD may go back down to the Red signal line and bounce....Again, we have to wait and see. Remember, that just because MACD drops, BTC PA does not always follow. We can range across instead
Over all, I am still Bullish long term but we may see some continued uncertainty in this market. The FED decision later this week will have an impact for sure
Bitcoin remains strong though but should circumstances allow, we could revisit 90K on that trend line below current position. I am not to sure this will happen but a good idea t be ready if it does.
What is certain is how PA has never really been in such a "soft" controlled action.
The nearest we have is way back in 2016 to 2016.
At this time period, we also saw BTC PA rise in a slow steady rise, no sharp pushes higher till the final push to ATH.
Currently, we seem to have repeated a similar Acton though. now, for longer
So, we wait and we will find out..
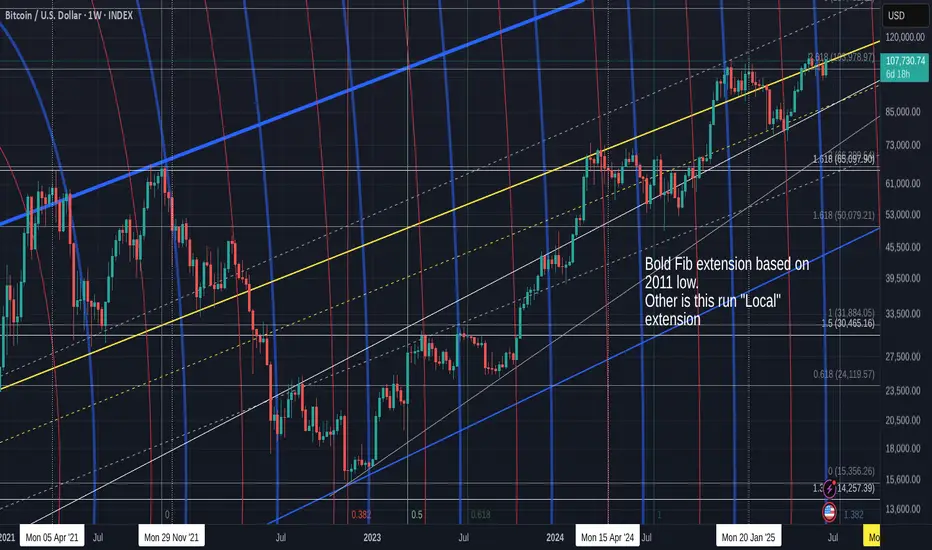
Bitcoin Weekly Closed GREEN -opens RED. Whats next ? After 6 consecutive Green Weeks, Bitcoin maybe about to Turn around and Cool for a bit.
BUT DO NOT PANIC
We have opened the week with a sharp drop back below the 2.618 Fib Extension. This in itself is a major move if unsurprising
Last week, we talked about this possibility by looking at the Daily MACD.
MACD Rising above the Signal line is a Bullish indication and Visa Versa
See the Arrow on the left, how MACD had 2 slight pullbacks and then went higher. This was in Nov 2024, just as the Ranging was finishing and PA was getting ready to push up to its Current ATH line
What I was looking at mostly though, was the Histogram. The Histogram shows us the distance between the MACD line ( yellow ) and its Signal line ( Red ) . The Bigger the bar, the bigger the difference between them.
See how it rose twice and then, went red for 2 days, recovered for a day and then , OFF WE WENT
And I am suggesting this is what may happen again.
So far, that pattern is repeating and the Histogram just went Red.
We may need to understand the difference in scale of this histogram though.
This could point towards a Week of unsettled PA, maybe Longer.
Notice how the MACD ( yellow) has now dropped below the Signal line ( red) as it did in Nov 2024.
During this period of MACD dropping and going red in 2024, we had 6 days of Red PA candles before the Bigger push higher. This may take longer this time but we have to wait and see.
We need to watch this close as the lines of support are in different place now.
If We zoom in on the Weekly PA chart, we see things a little more clearly
PA has fallen back below a line that was required as support. If you Look back to Nov 2024 area, we can also see a very Big difference in how PA is on the lines of support.
In 2024, we bounced off support.
We are currently being Rejected.
This Daily chart offers some more detail
The Circled area is the Nov 2024 area I been talking about.
Todays pull back is sharper but as we saw with the Histograms, we are in a bigger scale anyway
We could also see a similarity if we look back before the Circled area, see the W shape? A Double Bottom that appeared just before the push up.
Well, we just did that too.......If you back from where we are now, to the Low..There were 2 Dips down and then we pushed higher.
And, again, It is the scale that is Bigger.....
So, for me, this week maybe a bit bloody, but over all, Still Highly BULLISH
We need to regain that 2.618 Fib ext on this chart as support but that may not happen just yet.
There are "Local" lines of support near by and the LOG Daily chart I will post later gives some hope that Big Drops may not happen
The line of resistance just over head is strong and untill we break 112K and Hold it, we are likely to remain being bounced around.
But I do believe we Will do this and that we do seem to be repeating a pattern that led to a Goodpush higher.
We just have to wait and see
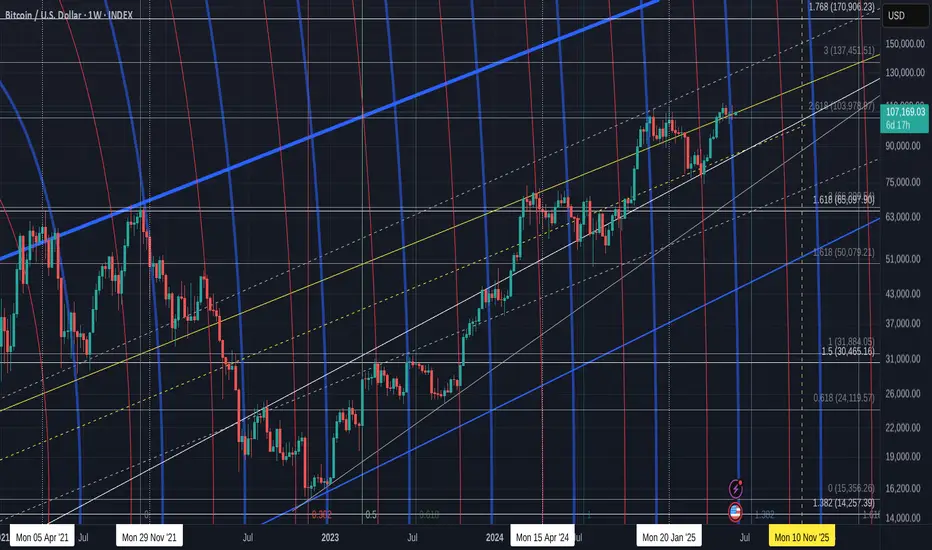
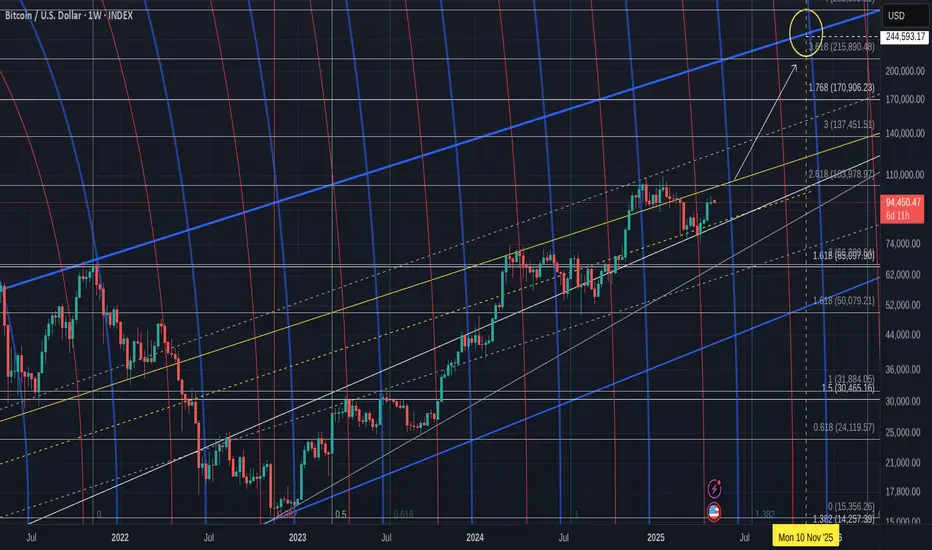
Bitcoin Weekly Long Term Chart showing realistic Cycle ATH
Bitcoin PA taking a breath of Air having pushed up off the lower trend line
Currently facing short term resistance as mentioned in the Daily chart just posted.
The Weekly MACD has yet to Croos its signal line ( red)
There is currently little reason to expect this to not happen.
PA currently sits Mid point of its rising channel with strong support below. We may well stay in this area till Mid Month, depending on the Macro influences.
The projected ATH in the circle top right of chart is on the ATH line created sine the 2017 ATH top.
It is a projection and an Expectation but there is confluence with many charts as to this Cycle Top price range. There are charts that show a Much higher price, though I feel they are possibly more pointing towards the Next cycle Top in 2029 ( If the cycle pattern continue as they have since 2017 )
We are on the edge of moves higher and we just need to remain patient......
Bitcoin Lifetime Analysis → Reverse to $20,000 Before New Highs?Bitcoin broke out of it's trading range between $25,000 and $32,000 and touched $44,800! Does this mean we're going to new all-time highs? I'm skeptical for a parade of reasons, all of which are based on historical and current data points. Let's dig in!
How do we trade this? 🤔
Recent Data
Since the trend reversal in January 2023 we've had three pushes to the upside, which is a textbook leg count before the trend converts into a trading range. The RSI has also been over 70.00 since October 2023 and the Daily candles leading up to December 4th 2023 could be the exhaustion bars at the end of the bull trend. This is enough evidence to warrant a pull back, likely to the top of the trading range around $32,000.
Historical Data
When are we going to see new all-time highs? Refer to the Monthly chart above. We can see that prior to hitting 3 of the 4 new all-time high events, Bitcoin will make contact with Lifetime Support. The one exception was the 2013 all-time high. Another data point is the Bitcoin halving has occurred prior to *every* new all-time high.
There is one more clue in the Weekly chart to observe! Look at the 2019 high, looks very similar to where we are now: Double-bottom reversal before touching Lifetime Support on Feb 2019, three pushes to the upside hitting the 2019 high, RSI over 70.00, price failed to break the 2019 high then capitulated to Lifetime Support, Bitcoin Halving happened shortly after, THEN went to new all-time highs.
I believe this is the situation we're in right now. If we don't make contact with Lifetime Support, I believe we need to at least come back down into the trading range before hitting new all-time highs. We also have the Bitcoin halving happening in the April 2024 area, all seems conveniently timed based on what we've discussed here!
Trade Options
There are many ways to trade this:
1. Fading your position down to lifetime support: Longing support areas as the price falls, starting with smaller positions and increasing your entry at every level.
2. Waiting for a bounce at lifetime support or in the trading range: Playing the reversal, which includes not entering until you see a reversal signal then you enter with a larger position.
3. Scalp your positions with higher probability of profit, but less profit and more risk in your Risk/Reward Ratio.
To strike a balance between Risk, Reward, and Probability, I'll stick with a standard Reversal Entry, which means we wait for a reversal confirmation. Based on this analysis, we should look to enter after a Lifetime Support or Trading Range bounce around $25,000. Enter in this price area, place a protective stop below the last bear run low at $15,000. Take profit areas are based on previous resistance and the projected lifetime resistance range of $120,000 and $130,000. The first take profit is at the price we just hit around $45,000, the next take profit should be just before the current all-time high around $65,000, the final take profit should be below the projected new all-time high somewhere in the $120,000 and $130,000 area, around $105,000. You could add more take profit areas between $65,000 and $105,000 based on lower timeframe analysis, but we don't have that data yet.
More updates will be provided as the months go by. Let me know your thoughts!
💡 Trade Idea 💡
Long Entry: $30,000
🟥 Stop Loss: $15,000
✅ Take Profit #1: $45,000
✅ Take Profit #2: $65,000
✅ Take Profit #2: $105,000
⚖️ Risk/Reward Ratio: 1:5
🔑 Key Takeaways 🔑
1. Bullish since January 2023. This is not *THE* bull run.
2. Bull Breakout of $25,000 to $32,000 Trading Range, but RSI overbought.
3. Every New All-Time high was Preceded by Touching Lifetime Support.
4. Bitcoin has not Touched Lifetime Support. Pullback to $20,000 Area.
5. RSI is above 70.00, Supports Pullback.
⚠️ Risk Warning! ⚠️
Past performance is not necessarily indicative of future results. You are solely responsible for your trades. Trade at your own risk!
Like 👍 and comment if you found this analysis useful!

Bitcoin Weekly Overview,Is This The Top ?Bitcoin candlestick wise showing signs of top.Trend Line wise we could see way higher price for btc in the upcomin weeks.
Thanks for watching

THE LAST DROP OF BITCOINHello traders,
Bitcoin is going to be drop one more time before run and create a new high from my perspective this is the best and maybe the last opportunity, price can drop from around 32k to 48k now the current market price is around 28k so probably it can hit 32k in coming days.
Bitcoin is currently rising but in my view there is one more drop is coming it will take time a lot of time but after that bitcoin will be going to create a new high.
I am waiting for bitcoin to drop and buy from the low price as much as possible, i mentioned area with box in the chart that is the potential area for buy bitcoin but right now bitcoin is for short term of time is bullish and i am not interested in that short term.
watch and wait bitcoin to drop and look for a long position opportunity for a long-term period of time in the area that i mentioned.
The area that i mentioned in the chart for a buy bitcoin is around 18k to 5k i will be looking for a buy bitcoin in between these two prices, i know that the distance between both prices is so long but i will update you later with the new idea if price drop and enter in the mentioned area.
This is the analysis and my view about bitcoin.
This is just analysis, not the exact trade or any kind of signal that proven with wining or losing % so be sure trade with your own according strategy do not depend on my analysis, this analysis is just a scenario and i would love to be wrong because i will learned from it and come back stronger.
Trading is like marathon race, its a long run game.
I wish you good luck and good trading.

BTC weekly scenario Market struture support at 19.4kish levels. Falling wedge on weekly. Previous weeks are bullish with solid bullish volume which signifies more buying happened at support. Btc if manages to close and hold above 200weekly MA next resistance to test is at upper trendline resistance of the falling wedge.
-Key resistances to be broken 26.7 - 28.6k - 30k (major).

Revised Bitcoin Trend analysis on Weekly Time frame
If BTC consolidate between 28643 to 32485
and it breaks upside will lead to Target of 37900 to 38000
If BTC consolidate between 28643 to 32485
and it breaks downside 28600 It will lead to downward Journey very fast.
below are downside Targets
1st 25475
2nd 19300
3rd 12900 (In case drastic changes in global environment)
Disclaimer: These levels are purely based on Price action/demand and supply zones & and consumed only for educational purpose & should not be taken as buy/sell recommendation. I will not be responsible for any loss/profit incurred if anyone takes trades based on my views.
Please consult your Financial Advisor before making any trading decision.
Leave a comment that is helpful or encouraging. Let's master the markets together.

Will 27K hold?BTC price and RSI in a falling wedge. Will this structure hold? Or will we fall lower to previous significant levels?
I hate to admit that we were overdue for a wash out of the market. These types prices are for buying, not for selling. “I wish I could make that type of money off of cryptos!”. Tell your friends to put their money where their mouth is for once.

Bitcoin rally signal to 43,000~45,000 on weekly 0.3 Genesis FibBitcoin just shifted the weekly chart into positive as seen on the Momentum Oscillator indicator. It is the first time since the several months of bear market we have experienced that Bitcoin finally confirms consolidation at the 0.5 Fib
Yesterday, BTC had an much easier win for the 41,3 resistance than expected. Momentum is on the side of the bulls as it will take a either a major world event or an almost impossible effort from the bears to shift this back into sub 40,000 price mark.
Without a doubt, if Bitcoin breaks through the upcoming resistance at 0.3 genesis Fib, respectively ~43,600 price mark, BTC will be shooting towards 45,000 without much resistance. At 45,000 it is highly possible that retail market will gain confidence into bulls, and with that confidence, Bitcoin will push above the ~50,000 price mark.
However, bulls should pay attention for the strong resistance at the 0.2 genesis Fib.
Definitely a long signal here, shorts should be closed or extremely closely monitored.

Bitcoin re-accumulation zone7 Essential principles we have learnt this year from trading weekly charts:
-Weekly charts are where the real $ is.
-If you are looking at weekly charts, don't get caught up in the short term volatility. Unless trading the 1D and 4H charts, of course.
-Identifying the accumulation or re-accumulation zone early is essential.
-Don't expect the price to start moving as soon as you buy or sell. A single trade on a weekly chart can last up to 16 weeks.
-Accumulation zones on a weekly chart can go from 10 to 16 weeks, sometimes more. Market sentiment is usually bearish during this time.
-Accumulation zones are where the institutions buy the lower part of the zone, while retail sells their positions following bearish news.
-Retail jumps on board once the price has left the accumulation zone. Don't follow market sentiment!
That being said, I believe we are currently at the early stage of a re-accumulation zone that will last several weeks. Maybe another 7 to 10.
Guessing when the price will leave the zone would be as naive as trying to guess how deep the dip will be. That's why I always show a box with the "zone".
So, start accumulating without expecting to be the last buyer before a rally.
I re-accumulated BTC at $33.500 in July while the market sentiment was extremely bearish. I wasn't the last buyer, because prices went down to almost $28.000 few weeks after. I closed those positions at $65.000 and again, I wasn't the last seller. Expecting to be that person is imposible and will affect your judgment.
My best advice is, start accumulating and be patient. When trading the weekly, use the daily timeframe ONLY to try and find the best buying zones but don't get caught up in the short term volatility.
I'll be posting the daily projections as per usual. Here's the link to the previous one, which is right on track with the forecast:
We might or might not visit the 42k zone. The question is: If you buy BTC at 46 -current price- and you sell around 70. Would you care if you bought it at 42 or 46? Maybe!
Ask those bears who were waiting for the $20.000 in July just because that was "The best buying zone" what they think now.
Happy 2022!
Rio.

BTC Weekly Update! Bullish Close!Checking out our weekly Bitcoin chart we are still trailing to the downside but we actually had a bullish close on sunday, we managed to climb up and above the 49K mark where we had our weekly close, we have since fallen down below this level but thats not very crucial, we have another whole week to make progress moving back to the upside We just missed out on closing above the 51K level, both last weeks candle and this weeks have wicked up and above the 51K which is a good sign and i wouldn't be surprised to see us make a push for closing above here next sunday! Another good sign that i noticed is we are trading inside of a bullish pennant which historically leads to breakouts to the upside. We are pretty close to the apex point and could see a breakout soon but i would say the longest period before we get that true breakout would be a few weeks, thats the maximum time period before we would be forced to breakout, now we could see some crazy momentum this week which brings us to a breakout point this week but we must confirm with a weekly close above the pennant. We have wicked multiple times above the pennant and even had a false breakout awhile ago so we are effectively weakening the resistance every time we do so, if we were to breakout this week we would be looking at an incredibly bullish close due to the top of the pennant lining up directly above the 51K resistance! Now the EMA ribbons, this indicator even on the daily is a very slow mover but powerful indicator, it shows the bullish or bearish momentum we have over a longer stretch of time. On the Weekly this indicator is very powerful and is still pointing to heavy bull momentum shown by the green ribbons ontop, when things get bearish we see these ribbons squeeze really tight before then flipping to red ontop, and i personally would say we are a far ways away from that happening, what we want to see is the ribbons start to point upwards and begin to spread out even further carrying price action with tons of bull momentum! Now the Wavetrend, keep in mind this is slow but powerful due to us being on the weekly timeframe, we are approaching the midline on this downwards wave but things are starting to look really good, we seem to be flattening out along the midline which is getting me thinking we are getting ready for a reversal and a push into a next bullish wave, the red crosses are getting closer and closer to our actual wave which is what we wanna see in this scenario, and eventually we gotta see that wave cross overtop of the red crosses and that is when we can confidently say we are in the midst of a reversal! Overall looking bullish on the BTC weekly and could be seeing a strong breakout any day/week now with a maximum of 3 weeks before we see a true breakout! Not financial advice just my opinion!!

Bitcoin's weekly analysis, So important don't miss it!Bitcoin's weekly candle closed recently with this details:
Open price : 43,172$
Close price : 48,233$
High : 49,300$
Low : 40,750$
From the point of view of Candle sticks pattern this candle is a strong Engulf candle which can be a bullish sign that correction phase is over and Trend is reversing.
Personally I bought Altcoins when BTC was around 41,000$ and I expect to climb without a fanatical look, I expect to see a breakout of upper resistance Trend Line in this weekly candle or next weekly candle.
After this breakout and according to my previous analyzes on BTC I expect 58K-61K for upcoming 3 weeks and even a new ATH this year which I will talk about that after conquest of 60,000$.
Thanks for your attention, I hope that this analysis can be useful for you.
Follow me for more analyzes and constant weekly BTC analysis.
Good Luck

Incoming BTC correction, I am hoping for the blue correction.I am very confident that we will experience the blue correction, hitting a low of around 39k. If we go for the purple correction we will go much lower to around 30k. After all the cryptocurrency buzz recently I just don't see us dropping that far. My big concern in the decrease in volume that continued getting lower despite the shills from famous people.

Bitcoin still neutral into this simetric triangle; but like bearSo, I consider that Bitcoin is in the volatile and warning zone that Bitcoin still it above of $13,000 USD.
But, if you're not prepare, we would need to see in weekly timeframe and right now, we see in the highly zone that obviously we would need to make a correction toward the $12,400 USD as I say you. Once that Bitcoin it's going with the parabolic up, Bitcoin would need a descense of the price to steady between the supply and demand!!!
I do not trade Bitcoin until I see a movement, so Bitcoin is neutral!!!. But in weekly, I hope that pass it in my model of my chart.
We could see a possible correction, in Daily we see a bearsh candlestick and the yesterday, the candlestick closed up with a indecision form. That could be a possible correction, also that in 2 ocassion we see a drop!!!

BITCOIN WEEKLY ANALYSISHello Traders! BTCUSD has been on my mind all weekend. Longing for the Long opportunity to the MOON. :)
For now, Bitcoin is currently testing a Strong Local Resistance Level. Proceeding th elast weeks of July, price rose above weekly resistance & completely ignored thoughts of a pullback. I think price could have trouble at the current level its at now, because it already failed to cleanly break above it twice. The Volume Oscillator has diverged from current Price trend. Which predicts possible downtrend following the Divergence rules. Awaiting for any possible confirmations.
If you Like this Analysis give it a Thumbs Up!
Comment Your Thoughts Below on BITCOIN

Anytime 50 Weekly MA did this brought a huge crash (Must see!)Hey everyone,
Recently I've been only focusing on the macro-level perspective mainly on the weekly chart. This one is very interesting...
Take a look at the 50 Weekly Moving average . Anytime it goes down pulls the price down too. It hasn't happened very often and when it did in 2014 and 2018, massive price dumps followed.
It seems like today, 50 Weekly MA is pointing down and getting ready for a downward movement. If it goes down do you think the history will repeat? Please let me know your thoughts by leaving your comments below.
Please also take a look at my recent weekly analysis regarding my bearish view.
