Opening (IRA): BITO April 19th 26 Short Put... for a 1.23 credit.
Comments: Adding to my covered call position (See Post Below) on weakness, converting the covered call into a covered strangle (i.e., short put + stock + short call). I went with April, since May appeared to be shit illiquid at where I'd want to pitch my tent.
I'm fine with being assigned additional stock here at the 26 strike, since my cost basis in my shares is currently 27.54, with the cost basis in any shares assigned via the 26 at 24.77, although my preference would be just to take profit on the covered call aspect at 50% max and the short put at 50% max and move on.
Naturally, if I also manage to grab the April dividend, that would be additionally bueno.
As a standalone trade:
Break Even/Buying Power Effect/Cost Basis in Any Assigned Shares: 24.77
Max Profit: 1.23 ($123)
ROC at Max: 4.97%
ROC at 50% Max: 2.48%
Bito

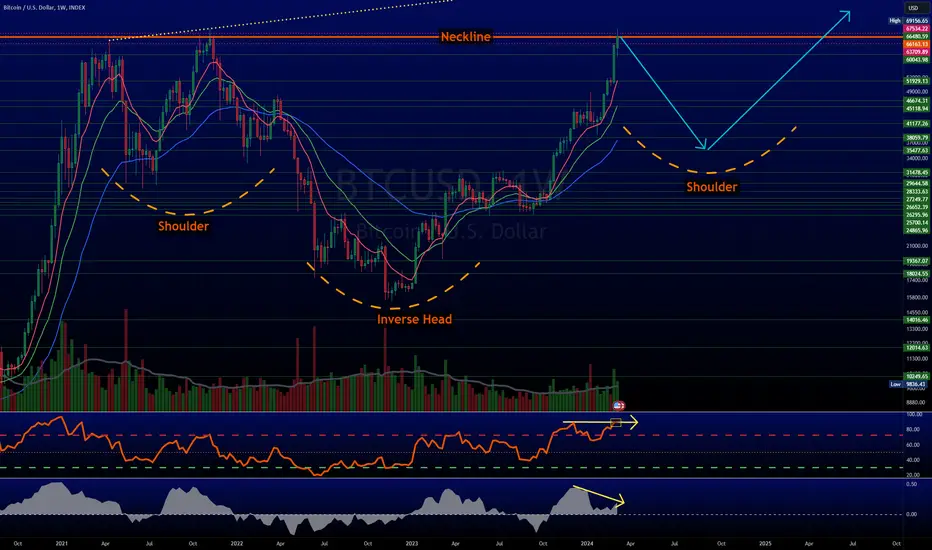
$BTC seems tired, Weekly most overextended vs AveragesGOOD MORNING
The CRYPTOCAP:BTC RSI is weakening further as it hits 74k.
The closer it gets to 80-100k the more risk rises.
#BTC is due for another correction/consolidation, IMO.
#Bitcoin $ Flow is still decent so, IMO this is not the top.
A)Shows RSI peaked & Selling begins to come in.
EURONEXT:FLOW was NOT strong at all.
B) Volume is light before picking up.
CRYPTOCAP:BTC has Heavy Buying coming in.
RSI hits the peak for this run.
$ Flow stable & goes higher.
C) #BTC buying subsides.
RSI is further weakening.
$ Flow still decent but keep in mind that this is LAGGING indicator.
Weekly
#Bitcoin is attracted to the Green Moving Avg.
This is the most overextended it has been during this run.
Needs rest imo

$BTC making moves, not stoppingPosted this elswhere(see profile here for more info) last night:
RSI is falling on For CRYPTOCAP:BTC Futures & Spot
#BTC Money Flow does look better on Futures vs Spot
The #Bitcoin weekly, last chart, looks VERY interesting. We have spoken on this possibility already. The Inverse Head & Shoulder Pattern - Tends to be very bullish.
---
Today
This is why you DO NOT trade on indicators alone. MOMENTUM/TREND is KEY!
Unless we make it CLEAR, weakness is just pointed out.
CRYPTOCAP:BTC will eventually CRACK, BUT it could be 100, 120, 200k, who knows?!
But it'll show signs when it begins to wane. None atm!
Prefer #BTC Futures charts vs Spot charts as, to me, they give a better idea.
#Bitcoin let's GO!

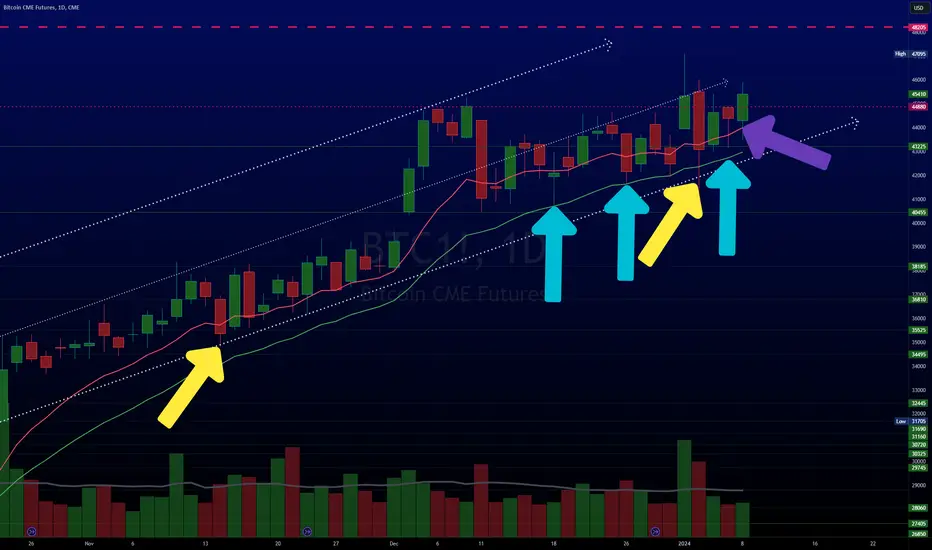
Told you $BTC has been a different animal!!!1st CRYPTOCAP:BTC chart shows the arrows pointing to the highs of this morning.
2nd #BTC chart shows where it is at the moment.
This shows us that Spot #bitcoin is correcting itself and catching up to Future's price action.
Futures $ Flow broke the downtrend & is rising. Bullish.
Spot $ Flow is pretty even. But just like price action, this will likely correct itself and catch up.
Both show lower RSI but IMO doesn't matter, yet, because the trend is strong!
Told ya it's different this time! It has been different!

$BTC comparisons, expectation, & pattern forming
To the untrained eye, CRYPTOCAP:BTC does look like a double top, but in reality it would be closer to a Triple Top, if anything.
Peaks are higher & we're trading ABOVE resistance levels.
IMO there is NO #BTC double top!
Yesterday #Bitcoin formed an OUTSIDE DAY (this is a so so pattern)
$ Flow is not great but the RSI is still HEALTHY!
------------------
Futures #BTC look a little better than Spot, shorts covered already!
Strength here is better than last peak by far!
-------------------
Inverse Head & Shoulder patterns are BULLISH but best at bottoms.
Spot CRYPTOCAP:BTC is forming one at the moment.
Drew the "expected" lines on the last chart.
#Bitcoin is trading very different and this has been true for some time now.
Many are making calls but are getting it wrong because of this, IMO 80-100k this year.
$BTC Futures showing different data vs SpotINTERESTING divergence happening at the moment with $BTC.
#BTC Spot has RSI falling & sells beginning to pour in.
#Bitcoin Futures has a strong RSI & some, light, selling.
Wont comment on $ Flow today but will say that both paint slightly different pictures there as well.
Weekly shows WHY this area will be tough. This area will not break easy.
HOWEVER, IMO, what have we said? The more something hits the weaker that resistance gets. It'll likely break through. But when?

Comparing previous $BTC tops & current state of BitcoinCurrent charts (not shown here, this is a weekly chart, se profile for more info)
CRYPTOCAP:BTC $ Flow is better captured on spot price.
#BTC RSI is better captured on futures price.
Weekly is interesting indeed!
Both show:
Cratering of $ flow as it goes higher, negative divergence.
RSI is still OKAY.
------------------------------------------------------------------------
Let's compare the other 2 #Bitcoin tops:
1st top shows CRYPTOCAP:BTC RSI cratering.
$ Flow took longer for futures to show a top but it was obvious on spot price.
2nd #BTC RSI is flat on both, it is healthy on its own accord, BUT is significantly lower than the previous top put in.
$ Flow is seen lessening on both futures and spot action.
Sell volume obvious on futures, no sign at all on spot.
Continuation....... (current chart shown)
#Bitcoin buy volume is exhausting.
CRYPTOCAP:BTC $ Flow is weakening. This is way more obvious on the Spot chart. However, it did is reach normal peak highs.
#BTC RSI is currently trading like the 2nd top, but it is stronger, reaching higher RSI number.
Futures are identical to 1st top, but Spot is a little bit lower in comparison to 1st top.
RSI is okay on both , healthy even.
Shorts have been wiped out and it stands at a low amount at the moment.
Warning signs but should retest highs at he least.

$BTC extreme bullish sentiment & most orderly movementAs stated before, there's extreme bullishness on $BTC.
Every influencer's excited & media is plastering a bull take.
They can be right but more often than not they are wrong and can be used as a contrarian indicator.
Things to notice:
#BTC shorts are @ their LOWEST in a year!
Money Flow is lessening.
Decent sell volume at the moment.
----------------------
Let's look at weekly data, chart shown.
Weekly CRYPTOCAP:BTC shows that indicators are weakening.
(Indicators aren't primary means of trading but are used for HELP)
Let's compare #BTC to other time periods, shall we?
Are we more like early or late 21?
This is most orderly run since the introduction of derivatives.
Looks almost like an Index, interesting, sarcasm.
#Bitcoin #bitcoinhalving #ETF

$BTC bullishness is really taking offAm seeing a ton of bullishness on CRYPTOCAP:BTC at the moment.
Extreme bullishness is okay but one should always take caution.
Keep in mind that volume has NOT been optimal but there was a bump not long ago. We're not changing anything and still long #crypto at the moment.
Let's see how #BTC reacts the next few days. Would like to buy some more on a dip.

$BTC stays strong, light volume thoughYesterday, CRYPTOCAP:BTC broke out of the symmetrical triangle we had spoken about two days ago
Today;
#BTC RSI is breaking out of downtrend it's been in.
Money flow pumped higher for #Bitcoin over last 2 days.
All this has happened while the volume is lower.
This can only mean one thing....... that is a lack of sellers.
We're still bullish on #crypto
48k breaks we should see 51k easily.
IMO - Buys on pullbacks.

Another case showing BTC post is irrelevant as Derivatives dictaDaily
CRYPTOCAP:BTC shorts are non existent at the moment.
Short term, the #BTC downtrend is still intact.
There's a tiny symmetrical triangle formed. (direction broken will dictate the push)
Volume is paltry. As if there is a wait for something.
$ Money Flow & RSI not showing much.
----------------------------------
Weekly Chart
$ Flow better vs Spot #Bitcoin.
So much spot was sold yet it held, why?
What have we been saying for years?!?!?!
Spot doesn't matter, DERIVATIVES Dictate!!!!!!!

Bitcoin ETFs now available on TV. Easy Money As Never Before 😅Bitcoin ETFs now available on TradingView
NASDAQ:IBIT - iShares Bitcoin
AMEX:BITB - Bitwise Bitcoin
AMEX:DEFI - Tidal Bitcoin
AMEX:ARKB - ARK Bitcoin
AMEX:GBTC - Grayscale Bitcoin
AMEX:FBTC - Fidelity Bitcoin
AMEX:BTCW - WisdomTree Bitcoin
AMEX:BTCO - Invesco Bitcoin
NASDAQ:BRRR - Valkyrie Bitcoin
AMEX:HODL - VanEck Bitcoin
AMEX:EZBC - Franklin Bitcoin
SEC officially approves BTC Spot ETFs
Tip #1: use TV search box to filter, find, and sort all Bitcoin funds, just like the attached screenshot.
Tip #2: use TV search box to filter, find, and sort all Bitcoin futures, just like the attached screenshot.
Tip #3: Long 1st, Short 2nd
Tip #4: Enjoy the Money 🤣🤣🤣

$BYC gap filled & more dataGood Morning/Afternoon Update
The CRYPTOCAP:BTC GAP was FILLED yesterday.
38k is minor support, don't expect a stand there but bounce possible.
Dotted lines are Fibonacci levels.
#BTC 37k price target very close.
#Bitcoin 32k is a stretch but anything is possible with a volatile asset.
Bearish moving avg crossover is shown by the yellow Circle
------
Shown elsewhere, see profile for more info:
A big X account speaks about positive divergence on 4hr chart.
Futures shows nothing of the sort.
Spot #BTC shows TINY divergence but NOT what should be used to trade or step in, IMO. Bounce? Maybe, we said CRYPTOCAP:BTC is at small support
Don't see any signs of turnaround for #bitcoin yet.
Sell volume is reducing, that's a +.

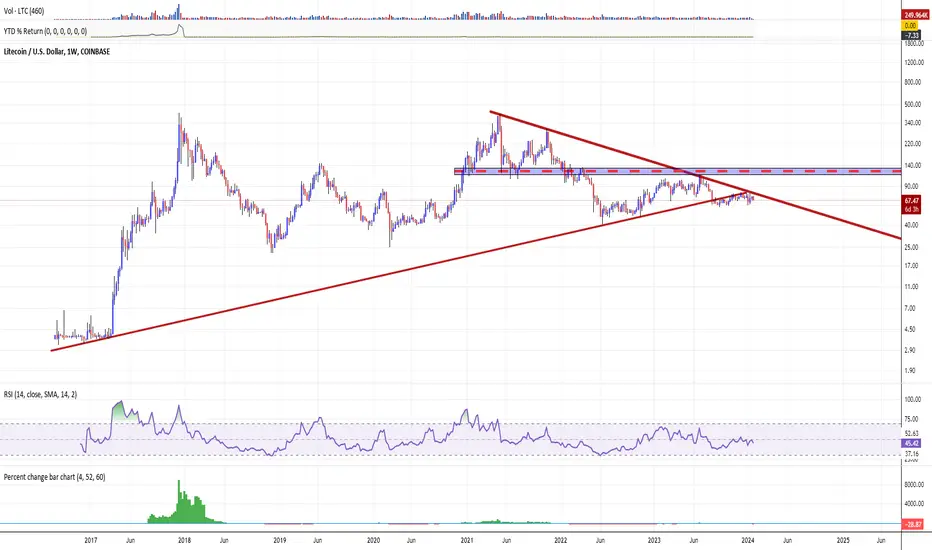
🏃♀️🏃♂ LTC. The spring has compressed. XxX's are inevitableOne of the most anticipated online events in the digital currency ecosystem in H2'23 was the Litecoin (LTC) halving, that took place in early August, 2023.
As the cryptocurrency market prepares for one of the network's major events, the Litecoin (LTC) halving, investors and analysts were peering into the crystal ball of market trends in an attempt to predict the outcome.
However, based on the hype that has accompanied the halving event over the past few months, there is good reason to believe that the online event may produce a different result than expected.
Historical backtest analysis says that every time the number of new addresses COINBASE:LTCUSD exceeded 350,000 over the past five years, a significant price correction followed.
More than 690,000 LTC addresses have recently been created, suggesting that the upcoming halving could be a “news selling” event.
On the other hand, the upcoming Litecoin halving, in theory, provides the opportunity for a significant price increase. This thesis stems from the deflationary effect that halving will cause, reducing the rate of creation of new Litecoins.
Combined with the growing demand for the coin, this again, in theory, could create an ideal scenario for price growth in the medium to long term.
The aftermath of the Litecoin halving should provide the cryptocurrency community with valuable information, especially as investors prepare for the subsequent Bitcoin halving
BITSTAMP:BTCUSD , scheduled for April, 2024.
Technical picture in Litecoin COINBASE:LTCUSD at the same time indicates a continuing deflationary price compression, with possible prospects for a further price decline within the boundaries of a downward channel to multi-year/ historical lows.
BTC futures dictate price, people still don't get itSince the price action reversal on CRYPTOCAP:BTC it has been struggling.
(also sold CRYPTOCAP:ETH & CRYPTOCAP:LTC few days later)
There is way too much positivity in this space for what's happening.
#bitcoin is at the top portion of the gap, but may not hold and will likely fill & trade lower.
We have been huge proponents of using futures data vs spot #BTC
If you only use spot CRYPTOCAP:BTC you're at a disadvantage
RSI looks similar but look @ $ flow
Futures #BTC showed cracks in mid/late December
#Bitcoin Fibonacci
50% from RECENT trend low = 37k
50% from 12/22 low = 32

Bitcoin sending mixed signals but trend has been strongCRYPTOCAP:BTC has hit the 1st 24 target.
Volume has been a little mixed lately. Was more buying leading up to the last few days.
#BTC RSI & $ Flow indicators are diverging.
RSI holding 50 but going lower (middle).
$ Flow above 0 going higher (middle).
Weekly
#Bitcoin trend has been strong.
It has been overbought since October.
Monthly
Not overbought, that's RARE when it does happen.
More on this another day.

$BTC holding while weakening, what? LOLGOOD MORNING
Don't see an increase in CRYPTOCAP:BTC shorts. With #ETF news perhaps traders do not want to be short.
Don't see a #BTC a breakdown, JUST weakening of the RSI during this current move.
BUT
#Bitcoin keeps bouncing off the trendline, yellow arrow.
We also see bouncing off the 20 Exponential Moving Avg, cyan, & the red = TREND strength.
As posted few days ago, the top part of the range keeps getting poked. The more poking the weaker resistance gets!
Bitcoin Spike on DailyOne of my primary technical analysis trading tools is that of False Breakouts or as I identify them; Spikes . I have found that when prices moves quickly in one direction only to return in the opposite direction within the same or following candle this indicates a potential reversal with a high probability. The corollary to this concept is that if price does then break that "spike" bar the trend can be confirmed.
The Spike
I have been watching the price action of Bitcoin exceptionally close over the last few weeks as the 2023 bullish trend approached and has stubbornly held a major Resistance. On the first US market open trading day of 2024 Bitcoin made a push to break the recent consolidation. However, the following day Bitcoin price reacted with a nearly -10% drop. Such a daily move is not uncommon in Bitcoin but where and when it happened is significant.
I operate under the logical thesis that if something is bullish... it should GO. There should be no such major rejections if the trend is strong. To have such a sudden rejection qualifies as a "Spike" and I created an indicator that identifies these for me to filter out the noise. That is exactly what happened at this point and place in Bitcoin price action.
This spike bolsters my conviction that the 2023 bull trend of Bitcoin has reached its zenith.
The Levels
If this spike proves to be a bearish reversal then the supports I identify based on past price inflation and 50% Retracements are:
35,400
30,700
If price surpasses the high of this week significantly the next level of Resistance is the March 2022 high of 48,200:
Expressing the Trade
Contrary to popular memes there exists already Bitcoin based ETFs. Rather than deal with the theta decay aspect of options the symbol AMEX:BITI is the SHORT Bitcoin ETF. The price action is distorted but it also exhibited the Daily Spike price action. This instrument is the one I will use to express bearish trades on Bitcoin going forward.
I talk about my Spikes as a trading concept often during my Weekly Livestreams here on Tradingview. You may also follow my last few years of Bitcoin price action analysis in the links below to see how we got here. Trade wisely!

Shocked @ $BTC and #crypto hit today?Good Morning!!!!!!!
In reference to the rout #crypto is taking, everyone's playing Monday morning quarterback.
The post quoted, pls see more info on our profile page, wasn't the 1st post with warning!!!
We had mentioned the breakout had a lot of selling with little buying to support holding the move. CRYPTOCAP:BTC gave up a large chunk of the gains.
We also spoke on #BTC $ flow lessening & the weakening RSI.
The CRYPTOCAP:BTC RSI looks to cross sub 50, it must hold 40ish area.
#BTC $ Flow hasn't looked good at all, buy on the rumor and sell news. Could be what's happening.
#Bitcoin forming a BEARISH ENGULFING. Recall NASDAQ:NDX did this and was walloped for a bit before recuperating. KEEP and EYE ON VOLUME TODAY!
Weekly, Bitcoin has formed an outside week, more on this later.
AMEX:BITO

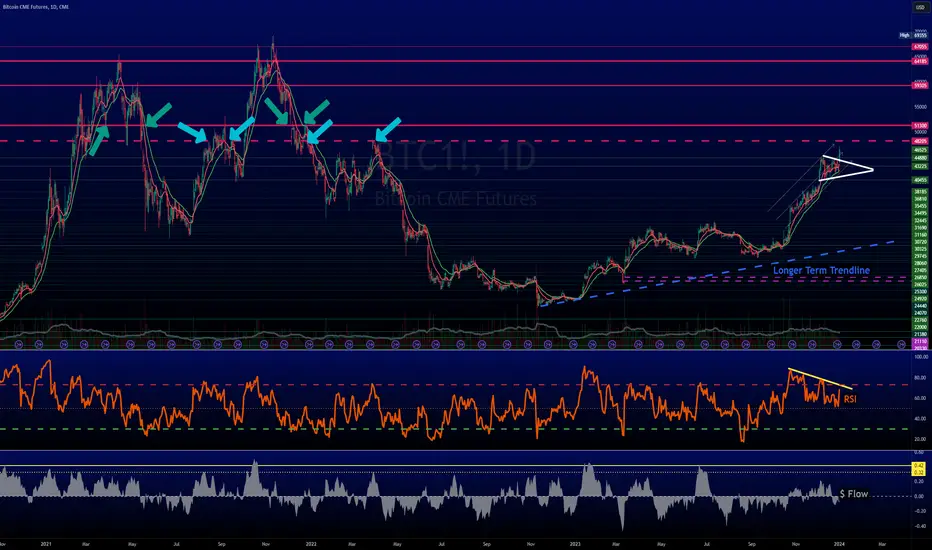
BTC held the 44kish call for 2023, 48-50k next before pauseGood Evening/Morning!
The call for CRYPTOCAP:BTC topping around the 44k range for 2023 was GOOD!
1st trading day and #bitcoin rips higher!
How's that for coincidence, huh?
The call for #BTC being in a temp pause & in a CONTINUATION pattern was GOOD!
IMO, the next level that #Bitcoin is most likely to test is the 48k with a good possibility of hitting low 50k area.
Let's continue.......
The RSI is still trending lower and $ Flow is not that great either.
Things can change though...
Why 48-50k? Arrows show the areas of resistance.
Even after breaking above this staunch resistance area, 50kish, Bitcoin didn't trade very long above it.
More on what we think later.... Still time...
For more info visit our profile page...
$BTC dip on light volume, leveraged trades wiped out $150MWe mainly focus on the right side of the long vs shorts but let's look @ left side today, yes?
Longs were wiped out. Crumbled as can be seen by 1st pic.
In reality, who would leverage a BTC long here?
Back to the right side of the chart.
There's a tiny amount of shorts adding up.
#BTC volume is NOT heavy for such a dip, hmmm, curious.
Seems as if half that sell was gobbled up already.
Intraday #bitcoin = OVERSOLD

$BTC still range bound BUT shorts begin to pileGOOD MORNING!
CRYPTOCAP:BTC is maintaining its trend very nicely.
The RSI is still range bound.
1Hr #BTC does not show anything out of the ordinary.
What is out of the ordinary are the increase in shorts lately.
HOWEVER.......
They're nowhere near the nose bleed levels from earlier in the year and at the end of last year.
#Bitcoin moving higher could very well FORCE a nice pump.
#crypto
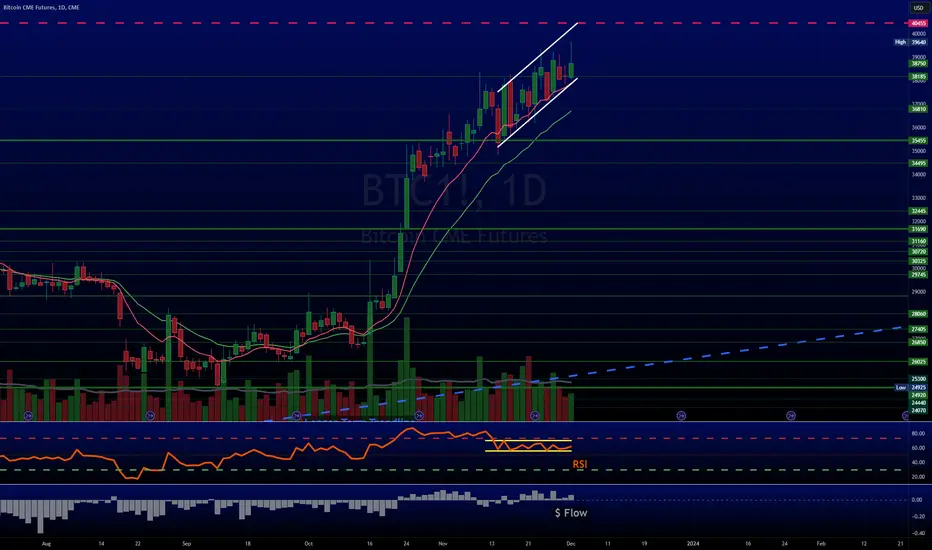
$BTC slow climb to 40k areaGOOD MORNING!
MIL:BTC is slowly creeping up towards the very important 40k level.
#BTC volume is satisfactory on buys vs sells.
#Bitcoin has been trending UP the red moving avg since Oct 16.
IMO, keep eyes on RSI. Will have an idea by which side ends up breaking out.
The money flow is still ok, for now.
40k area is very important. There will likely be some sort of pullback there.
