Buy Block (SQ) at 92$-95$ to target 115$Buy Block at market (probably 92$-95$ range) than w8 some days to sell at 115$.
Block

SQ coming into buy zoneSQ is undervalued and oversold. As long as the Nasdaq is weak it is likely to continue to drop. I might look to layer into a position between the macro .786 and the point of control of the lower range. Good investment for a five year hold.

SQ longNot sure why no one is paying attention to SQ. It's got a nice triangle forming and everyone knows I love triangles. Could break up or down, but I'm thinking up. SQ has been on a steady downtrend (down 60% since August highs), and I think it has found a nice bottom. A lot of people are fearful of AAPL's new tap to pay, but I don't see this having a significant affect on SQ in the near future.

SQAnalysis done on 30 minute candles. Block Inc, formally known as Square, is trading near a 52 week low and bulls are still wary of buying the stock. Looking at their financials, the company's revenue and bottom line are moving in the right direction, but their balance sheet needs work, specifically in its asset to debt ratios and free cash flow. Square's growth has been consistent, but new threats from Apple's new payment processing software are making it hard to foresee a robust future for the company. Square may see itself in trouble if they don't pivot or consider a buyout. Looking at the short term potential, the daily candle (not shown) peaked above the 20 day moving average today, making that line the primary support in focus. If SQ's daily candle opens above it tomorrow then use it for support, but if it gaps below it then it will become a strong resistance. Another resistance in the way is the 116.20 mark, which SQ will need to break for a chance to move towards 118.00-119.00.

Technical Analysis Of 10 Mentioned Stocks!Hi,
Long time no see! ;)
Actually, quite a busy time but still, have some old depths again and here they are - the stocks you mentioned in the comment section. Probably you don't even remember them :)
Sadly this series is not popular amongst crypto followers but still got enough data to sort out some stocks which may indicate that technically we get short-term bounces from shown areas.
To be said, it is the only technical side, fundamental analysis is your homework to do. These aren't my picks, these are your mentioned stocks.
Remember - fundamental analysis showing what to buy, technical analysis showing when to buy. So, do your homework and select what to buy ;)
1. Adobe
2. Alibaba
3. NVIDIA
4. Ball Corporation
5. Block
6. JD.com
7. Ford
8. CRISPR Therapeutics
9. Intel
10. PayPal
If you were interested in anything, go and do your homework! ;)
Regards,
Vaido

Square/Block Analysis 05.02.2022Hello Traders,
welcome to this free and educational analysis.
I am going to explain where I think this asset is going to go over the next few days and weeks and where I would look for trading opportunities.
If you have any questions or suggestions which asset I should analyse tomorrow, please leave a comment below.
I will personally reply to every single comment!
If you enjoyed this analysis, I would definitely appreciate it, if you smash that like button and maybe consider following my channel.
Thank you for watching and I will see you tomorrow!

Bitcoin most important levelsGo and press Like and follow
Hello friends
Happy weekend for you all
In this chart you can see the most important price blocks for my and for the whales
This is like gravity, if it goes up it should reach the upper block or at least a try to touch it.
That is all folks, have a nice weekend and be the profits be with you.
;D

Square or Block, who cares? We are going higher. Hi everyone,
As a proud bagholder, I present to you the NYSE:SQ chart.
Slaughtered as all growth stocks, the price finally bounced this week for +15% gain for now.
That's nothing compared to meteoric dump of the last few months.
The chart.
Last 2 year POC is at 230 .
All-time POC is at 60 .
Square has been investing into growth for many years now, I think real value of the stock is nowhere near 60. Thus, I doubt we return to that range.
The 100-150 price zone is a wild west, with swift moves and low volume.
We should slice through it on the upside.
Next significant supply zone is 151 .
Further up: 170, 191, 222-230 .
RSI is still oversold on a weekly. I would say it is not too late to buy.
Full disclosure : I am long Square since Jun 2020. I bought more shares yesterday.
As always, trade wisely and good luck!
-----------------------------------------------------------------------------------------------------------------
Disclaimer!!!
This is not financial advise.

How to Day Trade, Live Trading on SQ Looking at support and trendlines real time can have a big positive impact on live trading success.
Here, I live traded SQ and explained how.

Block/Square needs consolidate in the bullish pattern Block needs to consolidate in the bullish pattern in 'a' wave of the 2nd wave.
crab harmonic pattern:
X=$426
AB=0.61 XA
BC=0.38 AB
0.78 BC=$81
0.88 BC=$90
0.78 XA=$183
1.6 BC=$209
0.88 XA=$271
2 BC=$322
2.24 BC=$424
2.6 BC=$654
1.13 XA=$712
1.27 XA=$1248
3.6 BC=$2051
1.41 XA=2153
4.23 BC=$4157
1.6 XA=$4898

SQ a buy at $130?SQ a buy at $130 or coming down to $120? Selling volume picking up but $130 holding for now.

Square/Block Analysis 15.01.2022Hello Traders,
welcome to this free and educational analysis.
I am going to explain where I think this asset is going to go over the next few days and weeks and where I would look for trading opportunities.
If you have any questions or suggestions which asset I should analyse tomorrow, please leave a comment below.
I will personally reply to every single comment!
If you enjoyed this analysis, I would definitely appreciate it, if you smash that like button and maybe consider following my channel.
Thank you for watching and I will see you tomorrow!

Looking for these levels to hold. Bought short term SQ Calls.Expecting the July/August 2020 accumulation area to hold.
Looking for a pop next week to 144/147 to take off my Calls. Will scale out of calls as we trade above 140.
Started a position in shares for a longer term hold.

$SQ | WEEKLY WATCHLIST 1/10$SQ 1D
Same view as PayPal... wants more downside.
Watching the $120-130 area for support, otherwise mid $80s possible before recovery begins...😅

$SQ BLOCK weekly 0.618 bounce????? $SQ might have found its bottom need to confirm support in this area bears still in full control
looking for support at the 200ma which is also the .618 fib level if we lose 200ma next level of support is way down below $100 where the volume profile shows strong support in the $87 area
I expect $SQ (BLOCK) to start consolidating near the 200ma remember stocks like to SINK into support so could trade slightly below 200ma for a bit but not much lower IMO if sell momentum continues worse case is $87

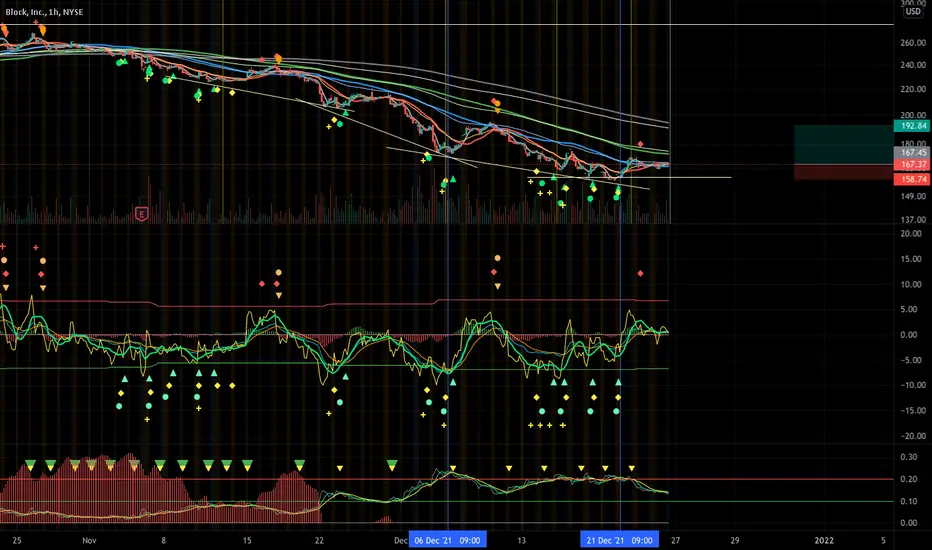
SQ displaying sign of reversalHaving drop 40% from the peak, I'm seeking a sign of reversal of SQ. Checking the 1H chart, the last 3 local minimums are only 5% different. 1H chart SMA20 already crossed SMA60, and tallying with oversold RSI from 15 Dec to 20 Dec. Price trend up since then.
Buy @ 167
Stop loss @ 158
Profit @ 192
Profit to loss ratio 2.9
💡BLOKUSDT ANALYSIS💡Hello Friends
When we look at the chart for four hours , Bat Formation Bullish Bat Formation Current It is
very risky to enter the trade before the voluminous momentum comes . Risk money management is very important in such trades .
There are technical levels on the chart.
Tp1:0,103809
Tp2:0,103809
entry level:0.077201 At the close of the 4-hour candle,
stoplos:0,053562 I keep the level away from my own money management, you can pull it close
. IT IS NOT INVESTMENT ADVICE.
If you are using the analysis, don't forget to like and follow
. If there is something wrong with the formation, you can warn.
EDUCATIONAL PURPOSES
Bats Formation Boge ( Bullish Bat )
Rules:
X / EU = 0.382 and 0.50 in
the EU / CD = 0.382 and between 0.886
BC / CD = 1,618 with between 2,618
XA / CD = 0.886

GBPAUD-ShortPOI on the 1H OB. 4H S/R identified. Looking for price to return to POI before continuation down.

GBPJPY-Short, then Long....expecting GJ to continue to fall... looking for a reaction in the Daily Order Block to continue pushing back up

$BTC Chart UpdateNothing to say just an update to the chart. The green arrows are my thoughts on how it moves on this upcoming breakout.

$BTC is killing me lol...Not that I'm wrong....Sheesh just explode.... smh so we have a little downside here and it should breakout about or around 8pm... DO NOT EVER FOMO UNLESS YOU ARE CERTAIN OF YOUR TP's AND STOP's. So I charted this beautifully and was busy at the time not realizing how fast BTC moves and I missed the original entry I made for myself. Had I got in at my original price I wouldn't have lost a dollar to this play... When you miss the correct entry you are forced to scalp or add heavy before liquidation... If you hit the mark its more or less smooth sailing to the end of the contract... I missed my entry I chased... found a good location then made the mistake of adding to my position at the wrong time which moved my liquidation causing me to get liquidated twice... but thats not the issue... My issue lies in trying to justify a new position by trying to make it into the original position which you can't do. I literally missed my entry and still made over 2k, but then I watched 3k in profit just turn red!!! How much of a greedy idiot am I?!!!! Needless to say all the money I made on this play damn near gone all because i missed my original entry....
PLEASE MANAGE YOUR ACCOUNTS WISELY AND KNOW THAT THERE WILL COME ANOTHER RUN...SHIT WE HAVE 2 MORE BEFORE THE END OF THE YEAR TO COME... SO I COULD HAVE WAITED AND STILL HAD MORE MONEY!
THIS IS NOT FINANCIAL ADVISE! THIS IS FOR EDUCATIONAL PURPOSES ONLY USE THIS INFORMATION AT YOUR OWN RISK.
**Remove Your Emotions
**Don't Chase
**Think Double Check And Check Again Before You Enter A Play!!!
GOOD LUCK TRADING!

BTC...Here We Go Again!This is getting fun I'm getting better... headed to $57876 area. All the lines are points on the Fibs so just follow them up... after 60k we will chart out our $90K mission.
THIS IS NOT FINANCIAL ADVICE! THIS INFORMATION IS FOR EDUCATION USE ONLY! PLEASE DO YOUR OWN RESEARCH BEFORE INVESTING IN ANYTHING! GOOD LUCK TRADING...

Predict What's Next... My Guess?🤔💭🚀My guess is after a little consolidation in the triangle BTC will drop back to about 55500 for the least and at the worse 50000 from here. Then if you scroll up the chart you will see all the key stops from here up to 60K. I'm not gonna get into all the numbers just look at the chart.... its late! Good Night I will see my Risk Takers in the AM!
What a better day to talk about $HUT. Lets hike these BTC coins out the roof so we can get into some of these crypto stocks! So we had a gap from a few weeks back when the market dipped. Well we filled the gap and now have opportunity on the upside. We are definitely bullish here alone on the side of crypto, which could only mean good things for $HUT. According to the Fibs this stock should have a break to the 1.618. Pay attention to the direction of BTC and follow the leader. Mining stocks will 50x-100x when BTC 10x's (roughly). Also my advice to you is to get familiar with crypto stocks and companies investing in them they are all about to explode!
THIS IS NOT FINANCIAL ADVICE! THIS INFORMATION IS FOR EDUCATIONAL AND ENTERNTAINMENT PURPOSES ONLY!
