[Deep Dive] OP – Edition 4: Accumulated Pressure!Optimism (OP) may be quietly setting the stage for a classic reversal play — with structure, sentiment, and cycle theory all lining up.
After a sharp markdown throughout Q4 2024 and early 2025, OP has spent several months forming what appears to be a rounded accumulation base. And if history rhymes, a markup phase could be next.
🔍 Phase Breakdown
📉 Markdown
The aggressive downtrend sent OP tumbling from above $3 all the way to the $0.50–$0.60 support region, wiping out months of bullish structure and triggering capitulation.
📦 Accumulation
Since then, the price has been compressing sideways in a tight range, respecting the $0.50 psychological zone while creating a rounded bottom pattern. This sideways action — combined with declining volatility — suggests sellers are exhausted, and accumulation may be underway.
📈 Markup Potential
The current setup mirrors textbook market cycles, where markdown gives way to accumulation, followed by expansion. If OP breaks above the $0.70–$0.85 resistance zone with volume, the door opens for a rally toward $1.85 and even $2.00 — the next key supply zones.
⚙️ Fundamental Fuel
Optimism is more than just a Layer 2 — it’s the engine behind the Superchain vision. With OP Stack now powering not only Optimism but also chains like Base and Zora, the protocol is becoming the backbone of Ethereum’s scalability roadmap.
Recent key updates include:
- New governance structures via RetroPGF Round 3 distribution.
- Continued expansion of OP Stack rollups.
- Growth in on-chain activity and TVL thanks to Base's rapid adoption.
All of this adds up to strong long-term tailwinds — especially if Ethereum Layer 2 narratives reheat.
🧠 What to Monitor Next
🔍 Break above $0.85 = confirmation of phase shift.
📊 $0.50 remains the key invalidation level for the current bullish thesis.
🧨 Watch for volume spikes near resistance — they often precede explosive markups.
💬 Are we witnessing the calm before Optimism’s storm — or just another pause in a longer downtrend?
🔔 Disclaimer: This post is for educational and informational purposes only. It does not constitute financial advice. Always do your own research and manage risk carefully.
📚 Always follow your trading plan => including entry, risk management, and trade execution.
Good luck!
All strategies are good, if managed properly.
~ Richard Nasr
Blockchain

From Euphoria to Exhaustion – BTC's Next Move?BTC Idea – Bearish Divergence + Key Level Watch ⚠️
Summary / Bias:
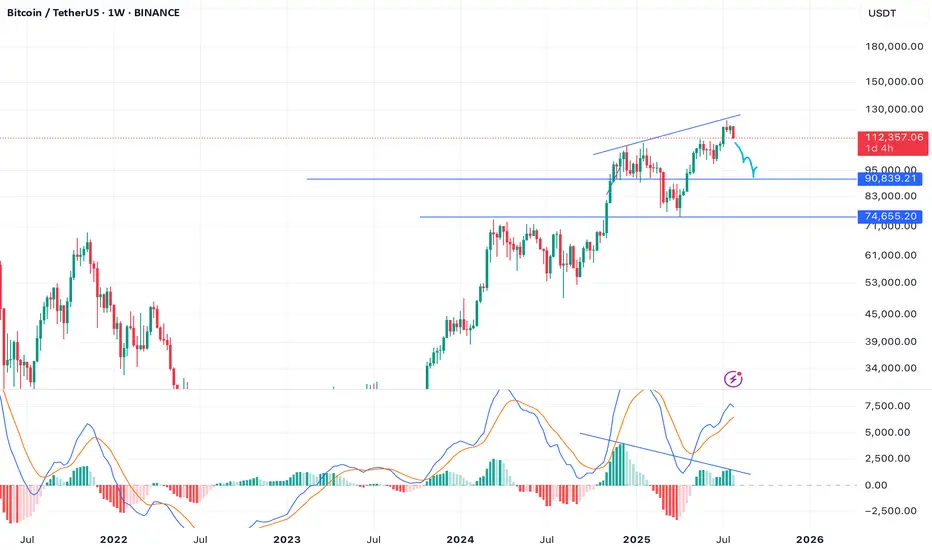
BTC has tapped 120K and is now showing early signs of weakness. A bearish divergence on the MACD Histogram (weekly) is flashing caution, while price has retraced back to the critical 112K zone. I'm leaning bearish short-term, expecting a move towards 100K, and possibly as low as 93K, if key confirmations unfold.
Technical Context:
Weekly MACD Histogram shows a clear bearish divergence, signaling potential exhaustion.
BTC rejected from 120K and has pulled back to 112K.
Price crossed below the Yearly Camarilla L#, but we need a weekly close below to confirm further downside.
112K remains the key pivot – failure to bounce strongly here could open the door for deeper retracement.
Scenarios to Watch:
🟥 Bearish Continuation (Primary Bias)
Breakdown and close below 112K
Downside targets:
TP1: 100K
TP2: 93K
🟨 Neutralizing Risk
Hold above 112K with strong bounce = neutral bias, reassess
Close back above 115K+ with strength = invalidate bearish lean
Caution & Patience:
Now is not the time for aggressive longs. Signs of exhaustion + major level retest call for defensive positioning and high-quality setups only. Let confirmation guide entries.
NFA. Risk management always.
Will update if structure shifts.
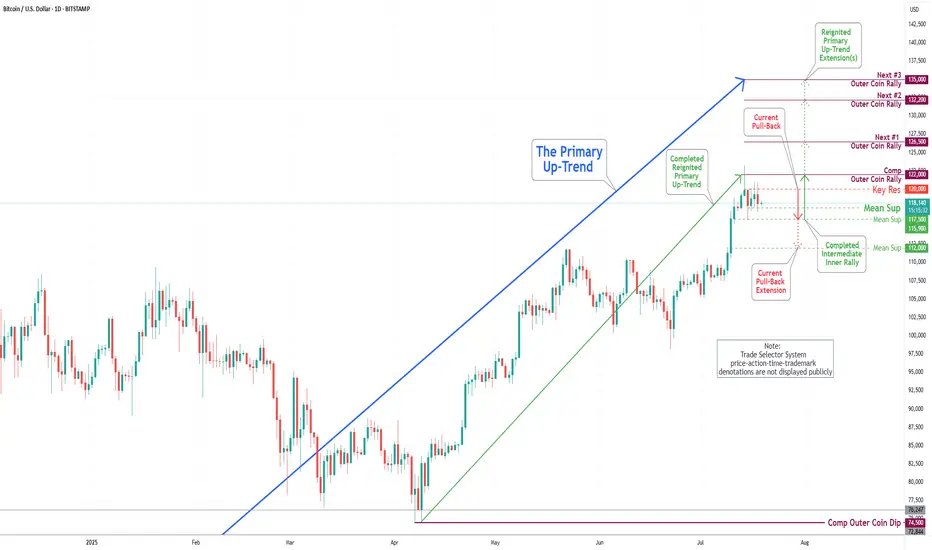
Bitcoin(BTC/USD) Daily Chart Analysis For Week of August 1, 2025Technical Analysis and Outlook:
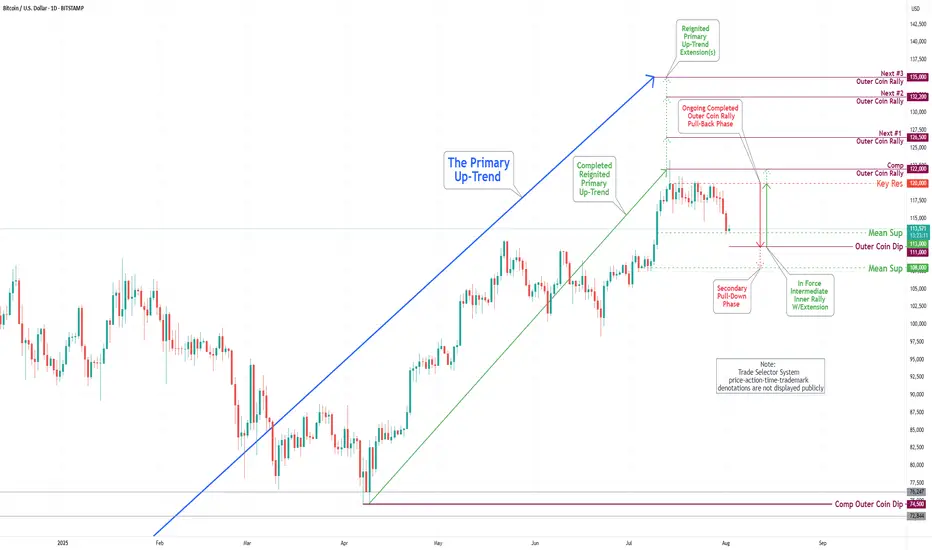
In this week's trading session, the Bitcoin market experienced a notable pullback. The primary reason for this movement was the Key Resistance level, which led to a decline that reached our Mean Support level of 113000. This anticipated pullback is prompting the completion of the Outer Coin Dip target of 111000, with a strong likelihood of moving towards the Mean Support level of 108000.
INJ - Back Bullish!Hello TradingView Family / Fellow Traders. This is Richard, also known as theSignalyst.
📈INJ has been overall bullish trading within the rising wedge pattern marked in blue.
This week, INJ has been retesting the lower bound of the wedge.
Moreover, the green zone is a strong demand.
🏹 Thus, the highlighted blue circle is a strong area to look for buy setups as it is the intersection of the lower blue trendline and green demand.
📚 As per my trading style:
As #INJ approaches the blue circle zone, I will be looking for trend-following bullish reversal setups (like a double bottom pattern, trendline break , and so on...)
📚 Always follow your trading plan regarding entry, risk management, and trade management.
Good luck!
All Strategies Are Good; If Managed Properly!
~Richard Nasr

Bitcoin(BTC/USD) Daily Chart Analysis For Week of July 25, 2025Technical Analysis and Outlook:
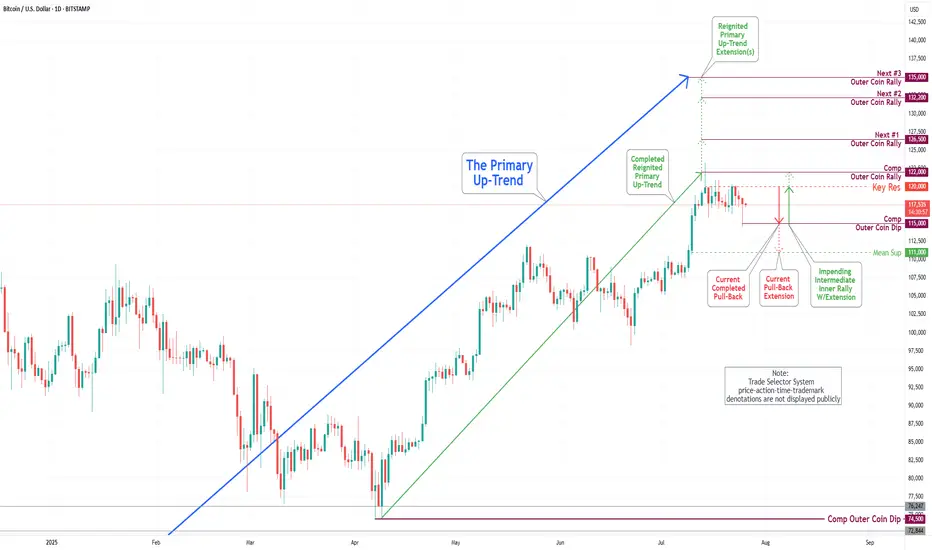
In the trading session of the previous week, the Bitcoin market exhibited considerable volatility as it retested the Key Resistance level at 120000. On the lower end of the spectrum, the market engaged with the Mean Support levels at 117500 and 115900, culminating in the completion of the Outer Coin Dip at 115000. Currently, the coin is poised to retest the Key Resistance at 120000 once again. This anticipated rebound will necessitate a retest of the completed Outer Coin Rally at 122000. The additional target levels for the renewed Primary Up-Trend are 126500, 132200, and 135000.
XYZ momentum is buildingXYZ positive weekly volume this week is a first in its history! Even though it has never had this much 'green' volume in its weekly history, there is plenty of resistance to be overcome for this stock
$81-85 will be challenging as sellers all the way from 2022 will begin dumping shares, especially when uncertain market conditions will be pushing them to sell. If it consolidates at 85, plan for a move to 98, where there will be another wave of sellers from Dec 2024 and 2022.
XYZ moves will parallel the BTC market with a lag. When BTC breathes, XYZ will breathe. With a BTC bull, expect XYZ to run.
Rating is neutral as this needs to break through resistance prior to accumulation, not the other way around.

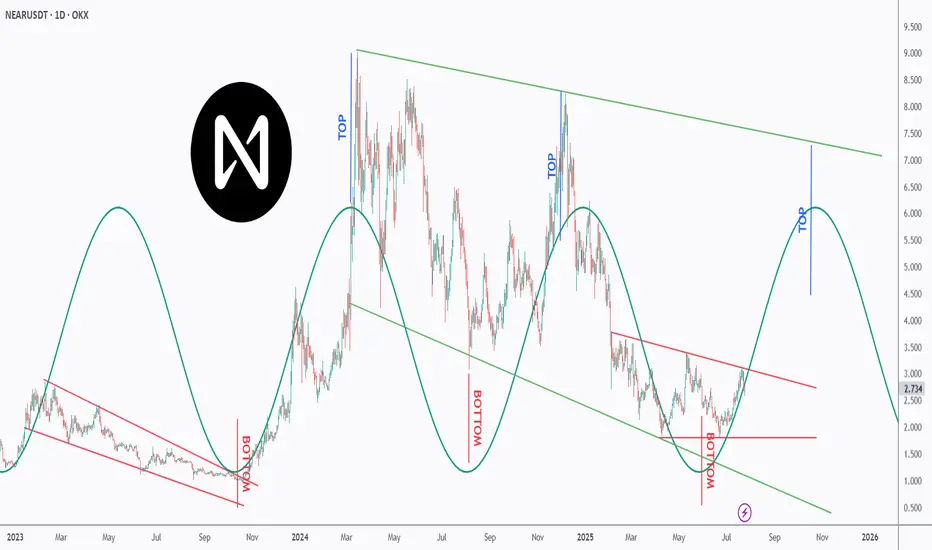
Is NEAR NEARing Its Next Explosion? Watch This Perfect Pattern!NEAR is dancing to a powerful rhythm — and it’s all in the cycles 🔁
This chart uncovers a repeating top-bottom cycle that has held since early 2023, with precise peaks and valleys emerging every few months 📉📈.
After bouncing off a major bottom at ~$2, NEAR is now approaching the mid-line of the descending red channel, suggesting a potential trend reversal is underway 🔄.
Each previous “BOTTOM” aligned with strong recovery waves 🚀, while the projected “TOP” now points toward the $6–7 zone — aligning perfectly with the upper green trendline resistance 🎯.
If the pattern continues, we could be looking at another macro push before year-end 2025 📆.
📊 Will NEAR ride this wave to new local highs — or is it just another lower high in the making? Either way, the rhythm of this chart is too clean to ignore.
📚 Always follow your trading plan regarding entry, risk management, and trade management.
Good luck!
All Strategies Are Good; If Managed Properly!
~Richard Nasr
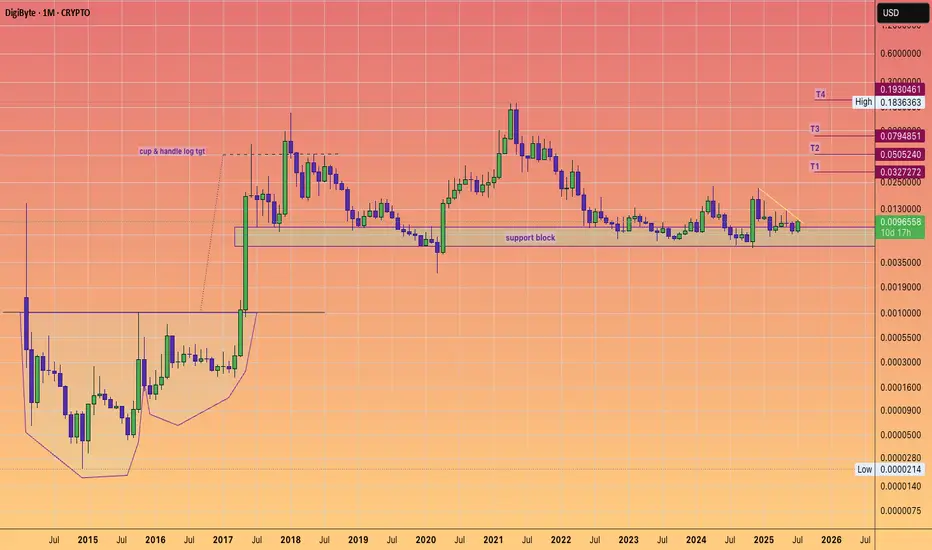
Digibyte $DGB Breakout watch. Bullish surge ahead?Digibyte appears to be reawakening, and a long accumulation phase appears to be ending.
If we scroll back to the beginning of the chart we can see the massive cup and handle and the subsequent moonshot to 5 cents.
I think 5 cents will also come back into play, in these coming weeks and months a healthy 5X.
As we know technically Digibyte is known for speed and decentralisation and UNDERvaluation.
Their much loyal supporter base deserve another moon mission.
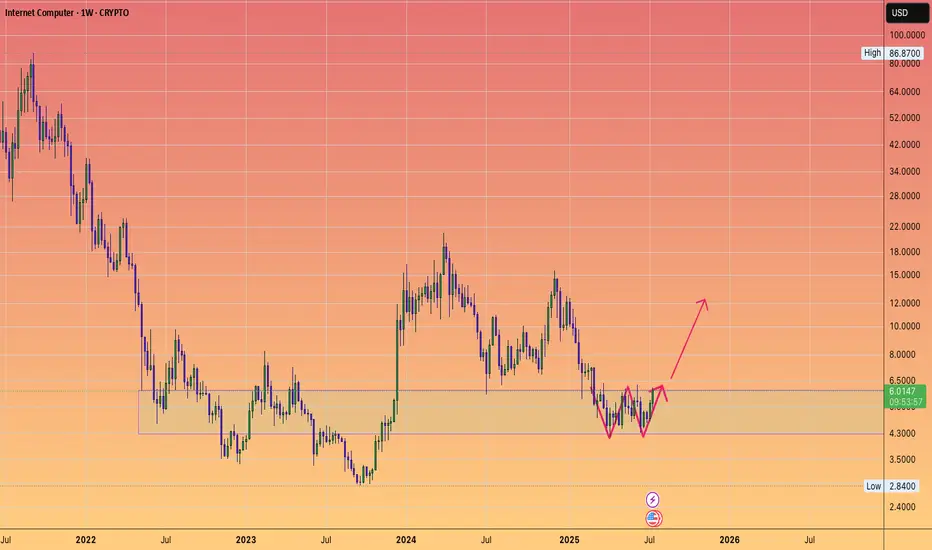
ICP still in the reload support zone....W pattern.
I like it down here.
Low risk accumulation block given the backdrop of #altseason going on.
Enjoy.
;)
Bitcoin(BTC/USD) Daily Chart Analysis For Week of July 18, 2025Technical Analysis and Outlook:
In last week's trading session, we achieved a new historical high by completing our Outer Coin Rally at 122000. Following this milestone, the coin retraced, as expected, to the newly established Mean Support at 115900 and is currently trading at the Intermediate Mean Support at 117500. Presently, the coin is set to retest the Mean Support at 115900, with the potential for a further pullback to the Mean Support at 112000. This anticipated decline will necessitate a retest for the completed Outer Coin Rally at 122000. The designated targets for the renewed Primary Up-Trend are 126500, 132200, and 135000.
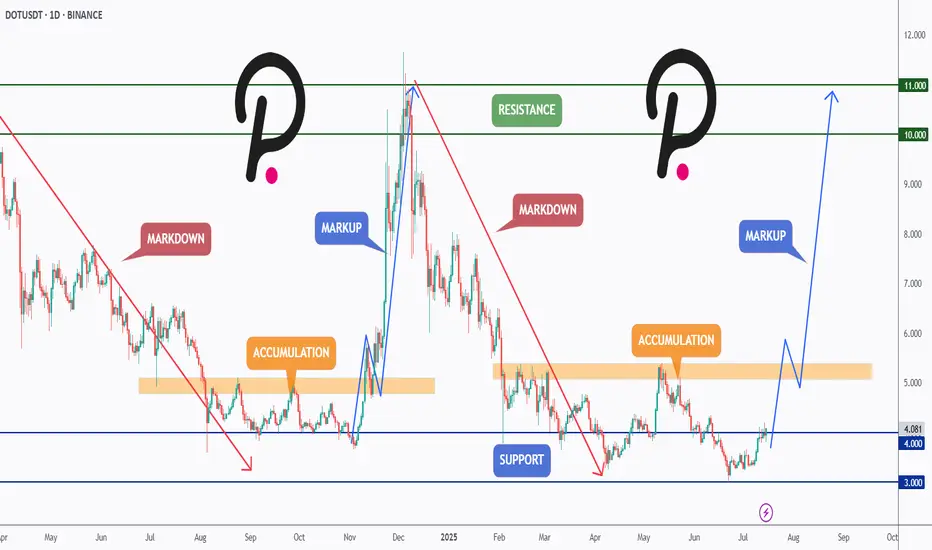
DOT Reloading for Takeoff ?CRYPTOCAP:DOT has been following a textbook Wyckoff cycle — moving from markdown into accumulation, followed by a sharp markup, then another markdown, and once again settling into a fresh accumulation zone.
After retesting the major support at $4 and holding above it, DOT is showing early signs of bullish momentum. If this structure continues, we could be preparing for another markup phase with potential targets at the $6, $10, and even $11 resistance zones.
This setup mirrors the previous cycle — will history repeat itself?
📍 Key Levels:
Support: $4.00 & $3.00
Resistance: $6.00, $10.00, and $11.00
Let me know your thoughts in the comments 👇
📚 Always follow your trading plan regarding entry, risk management, and trade management.
Good luck!
All Strategies Are Good; If Managed Properly!
~Richard Nasr
Key Insights: Financial Markets Transformation by 2030For years, this page has been my space to share in-depth market research and personal insights into key financial trends. This post reflects my perspective — a strategic outlook on where I believe the digital finance industry is heading.
The financial world is evolving at an unprecedented pace, and it's easy to overlook subtle shifts. But the undeniable fact is that we are now standing at the intersection of three powerful industries — financial markets, blockchain, and artificial intelligence. We are positioned at the cutting edge of technology, where innovation is not a future concept but a present reality.
This post serves as a reference point for future trends and a guide to understanding the transformative forces shaping financial markets by 2030. These are not just facts, but my vision of the opportunities and challenges ahead in this rapidly converging digital ecosystem. Staying ahead today means more than following the market — it means recognizing that we are part of a technological shift redefining the core of global finance.
📈 1. Electronic Trading Evolution
Full transition from traditional trading floors to AI-driven digital platforms.
Integration of blockchain and smart contracts ensures transparency, automation, and risk reduction.
Real-time data analytics democratizes market access and enhances strategic decision-making.
🤖 2. Algorithmic Trading Growth
Accelerated by AI, machine learning, and big data analytics.
High-frequency trading (HFT) boosts efficiency but introduces new volatility factors.
Adaptive algorithms dynamically adjust strategies in real time.
Strong focus on regulatory compliance and ethical standards.
🔗 3. Tokenization of Real World Assets (RWA)
Transforming asset management with projected growth to $18.9 trillion by 2033. (now 18.85B)
Enhances liquidity, accessibility, and transparency via blockchain.
Institutional adoption is driving mainstream acceptance.
Evolving regulations (DLT Act, MiCA) support secure tokenized ecosystems.
🏦 4. Institutional Adoption & Regulatory Frameworks
Digitalization of fixed income markets and exponential growth in institutional DeFi participation.
Key drivers: compliance, custody solutions, and advanced infrastructure.
Global regulatory harmonization and smart contract-based compliance automation are reshaping governance.
💳 5. Embedded Finance & Smart Connectivity
Embedded finance market to hit $7.2 trillion by 2030.
Seamless integration of financial services into everyday platforms (e-commerce, mobility, etc.).
AI, blockchain, and IoT power real-time, personalized financial ecosystems.
Smart contracts reduce operational friction and enhance user experience.
🛡 6. Financial Crime Risk Management
Market expected to reach $30.28 billion by 2030.
AI-driven threat detection and anomaly monitoring strengthen AML compliance.
Blockchain ensures data integrity and automates cross-border regulatory adherence.
Global collaboration (FATF, EU AML) fortifies defenses against evolving financial crimes.
🌍 7. Consumer Behavior & Financial Inclusion
Digital banking bridges the gap for underbanked populations, especially in emerging markets.
Mobile solutions like M-Pesa revolutionize access to financial services.
Biometrics, microfinance, and AI-powered engagement tools foster inclusive economic participation.
🚀 Conclusion
By 2030, financial markets will be defined by technology-driven efficiency, regulatory adaptability, and inclusive growth.
Success will favor those who embrace innovation, leverage automation, and engage in cross-sector collaboration.
The future belongs to agile stakeholders navigating a landscape shaped by AI, blockchain, tokenization, and smart finance connectivity.
Best regards, EXCAVO
_____________________
Disclosure: I am part of Trade Nation's Influencer program and receive a monthly fee for using their TradingView charts in my analysis.

Bitcoin(BTC/USD) Daily Chart Analysis For Week of July 11, 2025Technical Analysis and Outlook:
In the last week's trading session, Bitcoin has demonstrated a significant surge, achieving historical prices as anticipated by TSS for an extended period. The cryptocurrency has successfully completed both the Outer Coin Rally 114500 and the Inner Coin Rally 118200. Presently, Bitcoin is poised to celebrate this notable accomplishment with a victory lap, but it may face a potential downward trajectory, targeting the Mean Support level of 112000. This anticipated decline will necessitate the resilience to a retest of Inner Coin Rally 118200. The designated targets for the Outer Coin Rally at this juncture are 122000, 126500, 132200, and 135000.

SUI - Channel Structure
SUI just printed a powerful +12.95% daily move, bouncing cleanly from the mid-range of its long-term ascending channel. This structure has been respected since mid-2023, guiding both impulse legs and corrective phases with precision.
Now trading around $3.47, the next logical magnet is the channel top near $5, especially if momentum persists and market sentiment remains risk-on.
Technical Structure:
Bullish trend within a well-defined ascending channel
Clean reaction from dynamic support (midline)
Clear higher low + breakout structure in play
Upside Target:
$5 (channel resistance)
As long as SUI holds above the rising midline (~$2.80 area), this setup remains valid for trend continuation toward the upper range.
📌 Risk Management:
Break below the midline flips the bias short-term. Until then, trend = friend.

Bitcoin(BTC/USD) Daily Chart Analysis For Week of July 4, 2025Technical Analysis and Outlook:
During this week's trading session, Bitcoin rebounded from our Mean Support level of 104900 and, with significant momentum, subsequently completing the Mean Resistance level of 110300. Currently, the cryptocurrency is poised for a continuation of its downward trajectory, with a target set at the Mean Support level of 105500. This downward trend may necessitate heightened resilience to address the Key Resistance point at 111700 and the emerging historical price action of the Outer Coin Rally at 114500 and beyond. Nonetheless, it remains essential to acknowledge the possibility that current prices may experience an uptick from this juncture, bolstering the rally mentioned above.

RVYL updated outlook...ULTRA BULLISH month ahead!Both weekly & monthly timeframes indicating bullish inverted hammer. This is a bullish reversal signal based on technicals alone.
Near term buy-side technical target is just above the wick on daily candle from 6/2.
Take note of June's price action remaining predominantly within the consolidation range of the daily candle body from 6/5. The current retracement to gap fill levels on 4 hr tf is seen as an immense discount buy opportunity.
Rate cut narrative is also strongly bullish for small caps in general. Rates are to stock prices as gravity is to physics. Lower rates relieve downward pressure on stock prices, as future earnings projections are more optimistic amidst less growth-restrictive conditions.
Long term buy-side target into 2027-2028 remains 8$ range. Near term, we have at least a couple multi-bagger setups left for 2025.

INJ - Back from the Dead?Hello TradingView Family / Fellow Traders. This is Richard, also known as theSignalyst.
INJ has been hovering within a wide range between our two green zones, spanning from $10 to $16.
For the bulls to take control in the medium term, a break above the last major high marked in blue is needed.
To confirm long-term bullish dominance, a breakout above the upper boundary of the green range is required.
📚 Always follow your trading plan regarding entry, risk management, and trade management.
Good luck!
All Strategies Are Good; If Managed Properly!
~Rich

Bitcoin(BTC/USD) Daily Chart Analysis For Week of June 27, 2025Technical Analysis and Outlook:
Throughout this week’s trading session, Bitcoin has demonstrated an upward trajectory and is positioned to achieve the specified targets of Mean Resistance 110300 and Key Resistance 111700. This progression may ultimately culminate in the realization of the Outer Coin Rally 114500 and beyond. Nevertheless, it is crucial to recognize the possibility of a subsequent decline from the current price to the Mean Support level of 104900 before a definitive upward rebound.

Do you want to have glory? Do want to see Valhalla?#HODL
These next few years will could change your life.
#ETHEREUM is cheap right now.
#ETH still can do tens of X's

SUI - Only way is up.BINANCE:SUIUSDT (1W CHART) Technical Analysis Update
SUI is currently trading at $2.77and showing overall bullish sentiment
Price has touches the trending support and managed to bounce back from the support, this is a good sign. I see a good opportunity for long trade here with a decent stoploss.
Entry level: $ 2.77
Stop Loss Level: $ 1.77
TakeProfit 1: $ 3.6997
TakeProfit 2: $ 4.2126
TakeProfit 3: $ 5.7785
TakeProfit 4: $ 9.5494
TakeProfit 5: $ 14.1762
Max Leverage: 5x
Position Size: 1% of capital
Remember to set your stop loss.
Follow our TradingView account for more technical analysis updates. | Like, share, and comment your thoughts.
Cheers
GreenCrypto

Bitcoin(BTC/USD) Daily Chart Analysis For Week of June 20, 2025Technical Analysis and Outlook:
In the recent trading session, Bitcoin exhibited an upward trend; however, it subsequently experienced a significant decline from the established Mean Resistance level at 110300. On Friday, Bitcoin exhibited notable price action, characterized by a pump-and-dump scenario. At this juncture, Bitcoin is retracing downwards as it seeks to approach the Mean Support level at 101500 and the ultimate Inner Coin Dip at 96500. It is essential to acknowledge the potential for an upward rally from the Mean Support levels of $101500 and/or the Inner Coin Dip at $96500. Such a rally could culminate in a retest of the Mean Resistance level at $107000.

Bitcoin(BTC/USD) Daily Chart Analysis For Week of June 13, 2025Technical Analysis and Outlook:
Throughout the past week, Bitcoin has exhibited considerable volatility. After reaching a peak at the first Mean Resistance level of 109500, the cryptocurrency experienced a significant decline. Nevertheless, on Friday, Bitcoin demonstrated a notable recovery, ascending to a newly established resistance now designated as the new Mean Resistance level marked at 110300.
At this juncture, Bitcoin is retracing downward as it retests the initial Mean Support level of 104000 while aiming to target the Mean Support at 101500 and the ultimate Inner Coin Dip at 96500. It is essential to recognize the potential for an upward rally from the Mean Support levels of $ 104,000 and/or $ 101,500, which could culminate in a retest of the Mean Resistance level of $ 110,300.

UNI to the Mooni - Unleashing Banking into DeFi - Send itUniswap has powered trillions of dollars of exchange volume over the years, but, while its achieved economies of scale, it's been held back from mainstream use and value accrual due to the existing banking system's de facto and now uncovered to be de jure prohibition on interaction and SEC's systematic administration by enforcement campaign to destroy on-chain freedom of choice in the new digital exchange economy.
How big does it in the age of when the President of the USA has launched his own coin? Now that every bank in the world is about to "plug-in" to our Matrix?
Bigger than you can possibly imagine. That's the answer old boy.
But first, send it to $35.
That's a Livermore Accumulation Cylinder by the way
