ATOMic Impulse Soon 💣Hello TradingView Family / Fellow Traders. This is Richard, also known as theSignalyst.
📈 ATOM has been overall bullish, trading within the flat rising wedge pattern in black.
Currently, ATOM is in a correction phase, approaching the lower bound of the wedge.
Moreover, it is retesting a strong support and round number $10 in gray.
🏹 Thus, the highlighted Atom logo with the blue arrow is a strong area to look for buy setups as it is the intersection of the gray support and lower black trendline.
📚 As per my trading style:
As #ATOM approaches the blue arrow zone, I will be looking for bullish reversal setups (like a double bottom pattern, trendline break , and so on...)
📚 Always follow your trading plan regarding entry, risk management, and trade management.
Good luck!
All Strategies Are Good; If Managed Properly!
~Rich
Blockchain

BTC - Follow The Flow 🌊Hello TradingView Family / Fellow Traders. This is Richard, also known as theSignalyst.
📈 BTC has been overall bullish , trading within the rising channel in orange.
Currently, BTC is in a correction phase, approaching the lower bound of the channel.
Moreover, the highlighted red zone is a strong demand.
🏹 Thus, the highlighted blue circle is a strong area to look for buy setups as it is the intersection of the red demand zone and lower orange trendline.
📚 As per my trading style:
As #BTC approaches the blue circle zone, I will be looking for bullish reversal setups (like a double bottom pattern, trendline break , and so on...)
📚 Always follow your trading plan regarding entry, risk management, and trade management.
Good luck!
All Strategies Are Good; If Managed Properly!
~Rich

MPC - Bulls Already In Control 📈Hello TradingView Family / Fellow Traders. This is Richard, also known as theSignalyst.
📈 According to our latest analysis, M PC rejected the $0.3 round number and subsequently broke above the last major high in red. Therefore, the bulls have already taken over.
📉 MPC is currently in a correction phase, retesting the red structure.
🎯 For the bulls to regain control and initiate the next upward impulse movement, leading to a continuation towards the $0.525 resistance, a break above the last minor high in orange at $0.42 is required.
📚 Always follow your trading plan regarding entry, risk management, and trade management.
Good luck!
All Strategies Are Good; If Managed Properly!
~Rich

SEI - Bullish Impulse Ahead ↗️Hello TradingView Family / Fellow Traders. This is Richard, also known as theSignalyst.
📈 SEI has been overall bullish, trading within the flat rising wedge pattern in red.
Currently, SEI is in a correction phase, approaching the lower bound of the wedge.
Moreover, it is retesting a strong support in blue.
🏹 Thus, the highlighted red circle is a strong area to look for buy setups as it is the intersection of the blue support and lower red trendline.
📚 As per my trading style:
As #SEI approaches the red circle zone, I will be looking for bullish reversal setups (like a double bottom pattern, trendline break , and so on...)
📚 Always follow your trading plan regarding entry, risk management, and trade management.
Good luck!
All Strategies Are Good; If Managed Properly!
~Rich

Bitcoin(BTC/USD) Daily Chart Analysis For Week of April 5, 2024Technical Analysis and Outlook:
In this week's price action, Bitcoin rapidly moved towards a Mean Support level of 66700 and, in the process, established a new Mean Support level of 65600. This new level is being used as a base to ignite the bullish trend further. Currently, the market is experiencing consolidation, with the expectation of moving toward reaching the Key Resistance level of 73200 and beyond. However, a potential decline may occur, resulting in Bitcoin falling to the Mean Support level of 65600.

Bitcoin 8 year forecastThe white vertical line is Jan 09.
The white horizontal line is my personal estimation for a ceiling in price and adoption.
The blue lines are my personal extrapolation of the range using historical peaks and dips.
A stabilization between 100 000 and 200 000 $ would put Bitcoin between 2 - 4 trillion $ market cap.
This would be relatively small compared to global money supply but still a wonderful achievement.
... and a nice ride :----))
I expect the 2018 bubble to overshoot down to 2 500 $ around falls 2018.
An important aspect of this scenario is a significant decrease in volatility, making then Bitcoin a reasonable option for storage of value.
With all sorts of arguments, some people predict up to a million $ / Bitcoin, while some others predict it to eventually be worthless.
Things often turn out to be a compromise, which is the principle of a "market", and this scenario is my personal vision of this compromise.

MPC - Shift In Momentum In Action 📉📈Hello TradingView Family / Fellow Traders. This is Richard, also known as theSignalyst.
📉 MPC has been overall bearish trading within the falling channel in red.
📦 Currently, MPC is hovering within an Accumulation Phase between $0.3 round number and $0.36 major high.
📈 For the MarkUp phase to start, shifting the momentum from bearish to bullish, a break above the last major high in red at $0.36 is needed.
🎯 In such a scenario, a movement towards the $0.525 resistance would be expected.
📚 Always follow your trading plan regarding entry, risk management, and trade management.
Good luck!
All Strategies Are Good; If Managed Properly!
~Rich

Bitcoin(BTC/USD) Daily Chart Analysis For Week of March 29, 2024Technical Analysis and Outlook:
Bitcoin has achieved a decisive breach of its weak Mean Resistance level 68400, and is now eying the completed Inner Coin Rally 72500 and significant Key Resistance level 73200. The market anticipates that attaining these levels will set in motion a major bull run, with the primary target being the Inner Coin Rally 78200 first. However, it is essential to note that a potential takedown may occur, which could result in a decline to 66700.

💎 MPC/USDT - First SHORT , Then LONG ! (READ THE CAPTION)By re-examining the MPCUSDT chart, we can see that after moving to the first target, the price started to drain the excitement caused by the previous pump because it was just listed in this exchange, and it is currently trading in the range of 31 cents., The demand range for the price is between 25 and 30 cents, so we have to wait for the price to react to this level! If the price can make a strong return from this area, we can expect growth to higher levels than the price! (Targets are on the last TA) So, wait for confirmation and a suitable trigger to enter the price! So first, I expect the price to be corrected to lower levels, and then if the price returns to above 33 cents, we can see more growth in the price!
Please support me with your likes and comments to motivate me to share more analysis with you and share your opinion about the possible trend of this chart with me !
Best Regards , Arman Shaban

BTC - Detailed Video Analysis - in 2 mins!Hello TradingView Family / Fellow Traders. This is Richard, also known as theSignalyst.
📚 As long as the $70,000 holds, we are expecting a continuation till the upper bound of the channel and $80,000.
📚Always follow your trading plan regarding entry, risk management, and trade management.
Good Luck!.
All Strategies Are Good; If Managed Properly!
~Rich

BNB - Holding Strong and Ready for next moveBINANCE:BNBUSDT (4H CHART) Technical Analysis Update
BNB is currently trading at $317 and showing overall bullish sentiment
We are seeing nice 1D candle which is showing a bullish sentiment. We can expect the trend to continue until 340$ and we can see some resistance at that range.
Once BNB breaks the 340 range then next target is an easy 400$
Entry level: $310-317
Stop loss level $280
Target 1: $ 337
Target 2: $ 374
Target 3: $396
Target 4: $448
Max Leverage: 2x
Don't forget to keep stop loss.
Follow Our TradingView Account for More Technical Analysis Updates, | Like, Share and Comment Your thoughts.
Cheers
GreenCrypto

Bitcoin(BTC/USD) Daily Chart Analysis For Week of March 22, 2024Technical Analysis and Outlook:
Bitcoin has dropped significantly from a Mean Sup of 65900 to a Mean Sup of 61300, where it is currently gyrating. The upcoming retest of the Mean Sup of 68400 will be crucial for continuing the bull run. However, before the bull run takes place, the coin might retest Mean Sup 61300 and, in the process, complete Outer Coin Dip 57200.

ETH - Building Block 🏢Hello TradingView Family / Fellow Traders. This is Richard, also known as theSignalyst.
🏢 Imagine ETH is trading inside a building, and you are currently on the fourth floor.
📌 $3500 is currently your floor/support. For the bulls to take over, we need a break above $3600.
In this case, movement up to the ceiling at $4000 would be expected.
📌 Meanwhile, $3500 is the ceiling pushing the price down to the floor around $3000 - $3100.
Which scenario do you think is more likely to happen? Which floor is more likely to hold?
📚 Always follow your trading plan regarding entry, risk management, and trade management.
Good luck!
All Strategies Are Good; If Managed Properly!
~Rich

BTC - Narrow Range📦Hello TradingView Family / Fellow Traders. This is Richard, also known as theSignalyst.
📈 According to our last analysis (attached on the chart), BTC rejected the 60k-62k support and traded higher.
What's next?
🏹For the bulls to remain in control and initiate the next impulse that will lead to movement up to 80k, a break above 70k is required.
Meanwhile, as BTC retests the 60k support, we will be on the lookout for new short-term buy setups.
📚 Always follow your trading plan regarding entry, risk management, and trade management.
Good luck!
All Strategies Are Good; If Managed Properly!
~Rich

MPC - Wait For The Bulls 📈Hello TradingView Family / Fellow Traders. This is Richard, also known as theSignalyst.
📦 After finding support around the $0.5 round number, MPC has been hovering within a narrow range.
📈 As long as the $0.5 support holds, we anticipate a movement towards the upper bound of the range at $0.7 , which would also be a strong supply zone.
🏹 For the bulls to confirm medium-term control, a break above the red trendline is needed.
📚 Always follow your trading plan regarding entry, risk management, and trade management.
Good luck!
All Strategies Are Good; If Managed Properly!
~Rich

#SOL/USDT 2h (OKX Futures) Rising wedge on resistanceSolana printed an evening star, road back to 200MA support seems likely next.
⚡️⚡️ #SOL/USDT ⚡️⚡️
Exchanges: OKX Futures
Signal Type: Regular (Short)
Leverage: Isolated (2.3X)
Amount: 5.0%
Current Price:
171.72
Entry Targets:
1) 172.56
Take-Profit Targets:
1) 142.59
Stop Targets:
1) 187.58
Published By: @Zblaba
CRYPTOCAP:SOL OKX:SOLUSDT.P #Solana #SPL solana.com
Risk/Reward= 1:2.0
Expected Profit= +39.9%
Possible Loss= -20.0%
Estimated Gaintime= 1 week

Bitcoin(BTC/USD) Daily Chart Analysis For Week of March 15, 2024Technical Analysis and Outlook:
Bitcoin has reached our target, the Inner Coin Rally 72500. It has since dropped significantly and is now hovering around the newly established Mean Sup of 65900. The upcoming retest of the Mean Sup of 65900 will serve as a crucial point for continuing the ongoing bull run, which aims to achieve two more targets: the Inner Coin Rally 78200 and the Outer Coin Rally 81400.

XRD RADIXI'm bullish on XRD. After the recent lows, it should explode in a few days or weeks if BTC continues to perform well.
Bullish divergence on the RSI in the weekly chart.
I took a position between 0.038$ and 0.039$, i think bottom is here or near.
I also like the fact that XRD is completely under the radar right now, no one is talking about it anymore even though the project continues to evolve in the good direction.

SOL - Next Stop => $200Hello TradingView Family / Fellow Traders. This is Richard, also known as theSignalyst.
📈 SOL has been overall bullish trading within the long-term rising broadening wedge in blue.
How high can SOL climb?
The marked blue circle represents a significant resistance and overbought zone as it marks the intersection of the upper blue trendline and $200 round number.
Thus it would be a robust area to anticipate a potential reversal.
🏹 Meanwhile, as long as the $150 support holds, a continuation towards the $200 mark would be expected.
📚 Always follow your trading plan regarding entry, risk management, and trade management.
Good luck!
All Strategies Are Good; If Managed Properly!
~Richard Nasr

Stellar XLM LumensSecond highest peak following the higher peak range using a fib support resistance block on graph. This adjusted view puts Stellar into playing with getting out of the red zone.

STELLAR (XLM) LUMENS Stellar (XLM) is still in the red zone of trading. COINBASE:XLMUSD
Why is there no interest in the project of layer 1 blockchain Stellar XLM.
Moves like Tron but not Chinese. What's not to like--? Except for the fact there is little to no interest in trading Stellar now or before.

BITCOIN BTC MARCH 13teenth 2024A quick view on the BTC chart going forward with added lines to view some ranges for price and possible future breaks or lops; 77777 looks like the price target to beat and break through based on this conjecture as taken from the 'Lark' on the tree branch and expanded using fueled theory by late. The Ideas of March.

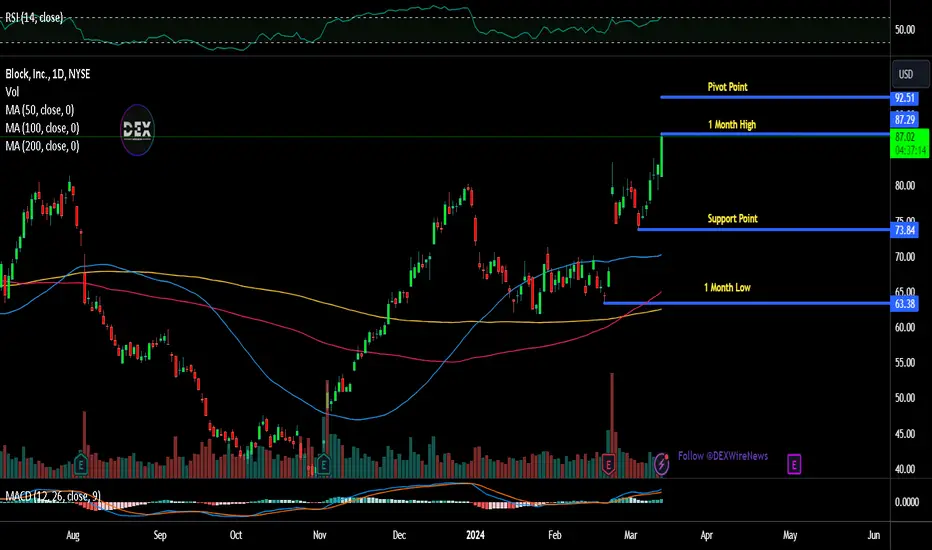
Bitkey Revolutionizes Bitcoin Custody with New Hardware DeviceBitkey, the innovative self-custody bitcoin wallet developed by the Proto team at Block, Inc. (NYSE: NYSE:SQ ), is poised to transform the landscape of bitcoin ownership and management. With the commencement of shipping for its first hardware devices and the introduction of advanced security and recovery features, Bitkey empowers users worldwide to securely own and control their bitcoin assets. Let's delve into the groundbreaking developments and the impact they have on the cryptocurrency ecosystem.
Enhanced Security and Recovery Features:
Bitkey's mission is to simplify self-custody while prioritizing security and accessibility for users. The latest updates include innovative features such as Trusted Contacts, enabling users to designate trusted individuals who can assist in account recovery. Additionally, the Emergency Access Kit provides a fail-safe mechanism for recovery in unforeseen circumstances, offering peace of mind to users.
User Feedback and Testimonials:
Early adopters of Bitkey have lauded its simplicity and robust security measures. Jacob B. from Mexico praises Bitkey's user-friendly interface coupled with robust security, emphasizing its potential to onboard new users to the world of bitcoin seamlessly. Australian photographer Georges F. commends Bitkey's ease of setup and multiple notification systems, underscoring the importance of redundancy in safeguarding assets.
Seamless Integration and Accessibility:
Bitkey aims to bridge the gap between traditional fiat currencies and the bitcoin ecosystem. Through strategic partnerships with Cash App and Coinbase, users can effortlessly transfer and now purchase bitcoin directly from the Bitkey wallet. These partnerships represent the first of many planned integrations, signaling Bitkey's commitment to enhancing accessibility and usability for users worldwide.
Technical Analysis
Prior the news of Bitkey Shipping, Block share ( NYSE:SQ ) was up by 6.7%, with a Relative Strngh Index (RSI) of 70 ( NYSE:SQ ) is currently riding on the bulls.
Global Reach and Adoption:
With availability in over 90 countries, Bitkey is poised to democratize bitcoin ownership on a global scale. The rollout of hardware devices and the Bitkey app across app stores further expands its reach, enabling individuals worldwide to take control of their financial future with confidence.