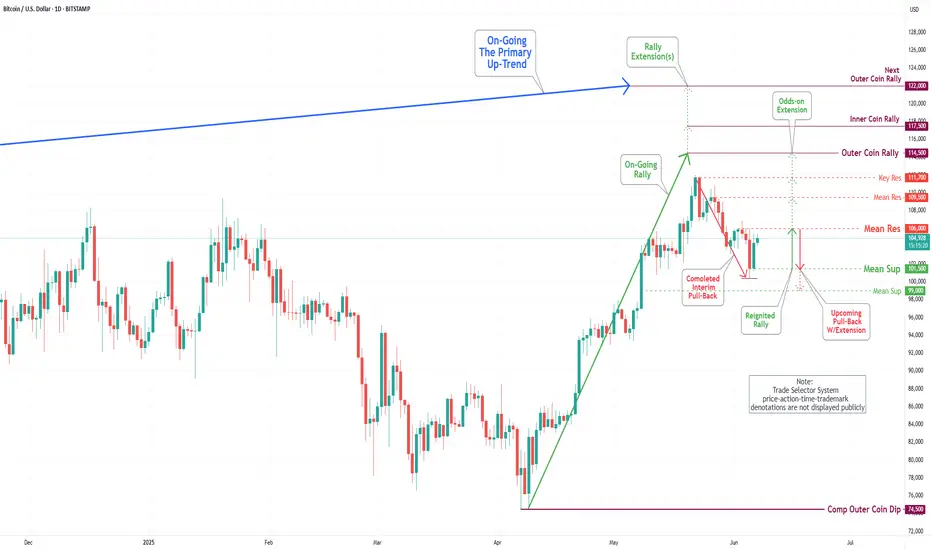
Bitcoin(BTC/USD) Daily Chart Analysis For Week of June 6, 2025Technical Analysis and Outlook:
Bitcoin has experienced a notable downturn throughout the week; however, on Friday, it made a substantial upward movement, effectively recovering all previous losses. It is currently positioned to establish a temporary pause at the Mean Resistance level of $106,000, which may facilitate the development of upward momentum from this point. This situation may pose challenges to achieving the Inner Coin Rally target of $ 114,500, which is contingent upon the Mean Resistance at $ 109,500 and Key Resistance at $ 111,700. It is essential to acknowledge the possibility of a downward pullback from the Mean Resistance level of $106,000, which could result in a decline toward the Mean Support level of $101500.
Blockchain
Bitcoin Breaks below $102,500 Support : Watch For RejectionIf you have been following my research on Bitcoin, you already know I published a prediction of a Double-Top pattern and a potential breakdown in Bitcoin on May 20, 2025.
TradingView selected this video as an Editor's Pick and it received thousands of views.
Thank you for all the great comments and questions from everyone.
Now, after about 3+ Weeks, we are starting to see BTCUSD move below my $102,500 support level (my breakdown level) and this could be the start of a broad downward price phase for BTCUSD and US/Global assets.
If you have followed any of my longer-term research, you'll quickly understand why I believe the US markets will struggle through most of 2025 as the world attempts to adjust to Trump leadership. This uncertainty will likely result in a sideways-consolidation phase in many global markets and a disruption of hard and soft assets.
In this regard, you can read the content of my original post (May 20).
Right now, I want to warn you that an immediate price rejection of the breakdown move is likely - possibly targeting $105k or higher.
This type of rejection is very common before price makes a much bigger move. So, be prepared for BTCUSD to attempt to reject and move back above $105k, then stall and break downward very hard - trying to move below $80k in an initial downward price phase.
It's going to be very interesting to see how this plays out with my broad cycle research. I'm still expecting a July 2025 and October 2025 MAJOR LOW cycle phase to play out.
Buckle up.
Get some
#trading #research #investing #tradingalgos #tradingsignals #cycles #fibonacci #elliotwave #modelingsystems #stocks #bitcoin #btcusd #cryptos #spy #gold #nq #investing #trading #spytrading #spymarket #tradingmarket #stockmarket #silver

RVYL indicating massive >600% profit potential near term!?!?massive short cover rally about to occur on this ticker... looking for progression above entire prior sell/consolidation structure on daily & wkly timeframes.
near term buy-side targets at 3.3-3.80$ levels.
long term, buy side target is at 8$
extra-ordinarily bullish on this one

Bitcoin(BTC/USD) Daily Chart Analysis For Week of May 30, 2025Technical Analysis and Outlook:
Bitcoin has undergone a significant decline during the current week's trading session and is presently situated at the Mean Support level of $103,000. This downward trajectory has the potential to establish a temporary pause, which may facilitate the emergence of upward momentum from this level, and it could pose a challenge to the Key Resistance level at 109500. A successful breach of this resistance may lead to the completion of the Inner Coin Rally target at $114500. However, it is crucial to acknowledge the possibility of renewed downward momentum from the current level, as this could result in a decline toward the Mean Support of 99000.

#BTCUSDT #4h (Bitget Futures) Ascending trendline breakdownCRYPTOCAP:BTC lost 50MA that may act as resistance now, retracement down to 200MA support seems next.
⚡️⚡️ #BTC/USDT ⚡️⚡️
Exchanges: Bitget Futures
Signal Type: Regular (Short)
Leverage: Isolated (19.0X)
Amount: 5.0%
Current Price:
107480.5
Entry Zone:
108234.7 - 109274.5
Take-Profit Targets:
1) 106010.9
2) 103944.6
3) 101878.3
Stop Targets:
1) 111050.5
Published By: @Zblaba
CRYPTOCAP:BTC BITGET:BTCUSDT.P #4h #Bitcoin #PoW bitcoin.org
Risk/Reward= 1:1.2 | 1:2.1 | 1:3.0
Expected Profit= +47.9% | +84.0% | +120.1%
Possible Loss= -40.1%
Estimated Gaintime= 1-2 weeks

Bitcoin - This time different ?In 2021-22 bitcoin formed a higher high on weekly chart and then bear run of 2022 started, if we look at the bitcoin current chart the same pattern being formed.
Do you think bitcoin will form the similar pattern ? In my opinion it is highly unlikely that bitcoin will see similar pattern, in 2022 the second push was due to overall market euphoria which pushed the price to new high even though bear market was already on (Bitcoin hit new ATH after crashing 55% which is unusual)
If we look at the current pattern bitcoin had -30% crash, which is normal between bull runs, so its highly unlikely that bitcoin will similar fate as 2021.
Follow Our TradingView Account for More Technical Analysis Updates, | Like, Share and Comment Your thoughts.
Cheers
GreenCrypto

ETH - Trading at crucial resistance levelBINANCE:ETHUSDT (1W CHART) Technical Analysis Update
ETH is currently trading at $2500 range and the price is at crucial resistance zone, previously ETH had one if its largest crash after this support line was broken, now the same support line is acting as resistance.
50 EMA is also acting as a strong resistance in this are.
ETH needs to breaks this resistance to reach the next resistance around 4k USDT. if ETH cross 3K then 4k is an easy target.
Im expecting this resistance to break in next couple of weeks.
Short term target 3100
Mid Term Target 4000
Long Term Target 7000-9000a
a
aRemember to set your stop loss.
Follow our TradingView account for more technical analysis updates. | Like, share, and comment your thoughts.
Cheers
GreenCrypto

Bitcoin(BTC/USD) Daily Chart Analysis For Week of May 23, 2025Technical Analysis and Outlook:
In the course of this week's trading session, Bitcoin demonstrated significant upward movement, surpassing both Mean Resistance at 105000 and Key Resistance at 106100. This progression also facilitated the surpassing completed Inner Coin Rally at 108,000, and the highly anticipated Outer Coin Rally marked at 110000. As a result, the cryptocurrency experienced a substantial decline, currently aiming toward Mean Support at 105600, with a potential further decline toward an additional Mean Support target at 101500.
It is essential to acknowledge the possibility of an upward momentum emerging from the current level, which may enable a challenge to Key Resistance at 111700. Success in this regard could result in reaching the Inner Coin Rally at $114500 and, subsequently, the Outer Coin Rally at 122000.

Bitcoin(BTC/USD) Daily Chart Analysis For Week of May 16, 2025Technical Analysis and Outlook:
During this week's trading session, Bitcoin has remained tightly bound within our Mean Resistance level of 104000 and is positioned to retest the lower target identified as Mean Support at 99300. There exists a possibility of a further decline toward an additional Mean Support target at 94000. Nonetheless, it is crucial to recognize the potential for upward momentum from the current level, which may lead to a challenge of the Key Resistance at 106100. This could culminate in a retest of the previously established Inner Coin Rally at $108,000.

SOL - Strong Structure Rejected!Hello TradingView Family / Fellow Traders! This is Richard, also known as theSignalyst.
The picture says it all!
📈As long as the $134 structure marked in red holds, I will be expecting a bullish continuation towards the $180 resistance level.
📚 Reminder:
Always stick to your trading plan — entry, risk management, and trade management are key.
Good luck, and happy trading!
All Strategies Are Good, If Managed Properly!
~Rich

Bitcoin(BTC/USD) Daily Chart Analysis For Week of May 9, 2025Technical Analysis and Outlook:
Bitcoin leapfrogged our Interim Coin Rally 100000 via Key Res 97500 in this week's trading session and is clearly aiming to retest the next target of completed Inner Coin Rally 108000. Nevertheless, current price movements indicate a potential retracement from Mean Resistance 104000 toward the Mean Support level at 99300, with a further possible decline likely toward an additional Mean Support target at 94000. However, it is imperative to recognize the potential for upward momentum from the current level, as this could facilitate a trajectory toward the Key Res 106100 and the next Interim Coin Rally at $108,000 and beyond.

ETH/USDT – Ascending channel. Breakdown below support?Ethereum - is a smart contract platform that allows developers to build decentralized applications (DApps) on its blockchain.
CoinMarketCap : #2
↗️ Ethereum is moving within an ascending channel, and the bullish trend remains intact.
Inside the channel, there are two triangles.
The first triangle, with a base of 88%, has played out—its third wave broke through the triangle.
Liquidity grabs and shakeouts before the growth in the inner channel zones are marked with yellow circles.
Currently, we see a mirrored situation with a new triangle, this time with a 156% base. However, if this pattern plays out, it will break the ascending channel.
At the moment, the price has been dragged below the channel support, and there is a lot of negative sentiment in the news and opinions. Few believe in an upward move, and many have been liquidated. To me, this looks like a strong trigger.
⤵️The bearish scenario implies a -61% drop. (A less likely scenario.)
I've marked everything on the chart—consider this in your trading strategy. Remember, there's a lot of negativity around Ethereum, just like with all altcoins...
I also believe that on the monthly chart, it will end up being just a wick of the candle.

Why Ethereum Could 10x in the Next Few Years🚀
1. Ethereum ETF Approval
ETFs are approved in the U.S. (similar to the Bitcoin ETFs in early 2024), institutional money will flood in.
Grayscale, BlackRock, and others have already filed.
Ethereum’s price jumped significantly after similar events in the past.
2. Deflationary Supply (Post-EIP-1559)
Since EIP-1559, ETH has been burned with every transaction.
Combined with Proof-of-Stake (The Merge), ETH is now net deflationary during periods of high network activity.
3. Layer 2 Ecosystem Is Exploding
Rollups (Arbitrum, Optimism, Base, zkSync) are scaling Ethereum.
These L2s settle on Ethereum L1, driving fees and activity.
Vitalik’s "rollup-centric roadmap" is playing out — this benefits ETH long-term.
4. Real Yield from Staking
Ethereum now offers a real, sustainable yield from staking (~3–5%).
Institutions love yield. ETH becomes more like a productive asset, not just a speculative token.
5. Ethereum as the Base Layer of Web3
DeFi, NFTs, gaming, DAOs — Ethereum is still the dominant smart contract platform.
The most secure, battle-tested, and widely adopted chain.
Developers and enterprises continue to build on Ethereum over competitors.
6. Macro Tailwinds
As the U.S. moves toward looser monetary policy, risk assets (including crypto) historically benefit.
Crypto adoption is growing globally — from Latin America to Asia — and Ethereum is often the entry point.

Bitcoin(BTC/USD) Daily Chart Analysis For Week of May 2, 2025Technical Analysis and Outlook:
Bitcoin prices have significantly exceeded our previously completed Interim Rally 95000, thereby positioning the cryptocurrency to aim for the forthcoming Interim Coin Rally marked at 100000. Nevertheless, current price movements indicate a potential retracement toward the Mean Support level at 94000, with a further possible decline likely toward an additional Mean Support target at 91800. It is imperative to recognize the potential for upward momentum to develop from a retest of either support level, as this could facilitate a trajectory toward the next Interim Coin Rally at $100,000 and beyond.

Bitcoin(BTC/USD) Daily Chart Analysis For Week of April 25, 2025Technical Analysis and Outlook:
Bitcoin experienced a significant rally in this week's trading session, breaking through all identified Mean Resistance levels: 86400, 90600, and 94500. This breakout led to the completion of the Interim Coin Rally at 88400. As a result, the newest identified Interim Coin Rally at 95000 has also been completed, indicating a possible pullback to the Mean Support at 92000 and a further decline potential toward an additional Mean Support target at 88500. However, it's important to recognize the chance of upward momentum emerging from a retest of the completed Interim Coin Rally at 95000, which could advance toward the next Interim Coin Rally at 100000.

Bitcoin(BTC/USD) Daily Chart Analysis For Week of April 18, 2025Technical Analysis and Outlook:
During the price movements observed throughout the week, Bitcoin has remained close to the previous Mean Support level of 85200 and appears poised to initiate an upward breakout, targeting the newly developed Mean Resistance level of 86400. This breakout may facilitate a retest of the completed Interim Coin rally at 88400, with additional expansions of targets also being a possibility. It is critical to acknowledge that potential for downward momentum may arise from a rechallenge of either the Interim Coin Rally at 88400 or the Mean Resistance at 86400.

BTCUSDT has reached a pivotal point.Market Alert: Bitcoin's Crucial Moment
The battle lines are drawn! BTCUSDT has reached a pivotal point, slamming into the trendline resistance zone that's proven to be a formidable foe for bulls. Will the bears finally break through, or will the bulls rally for another attempt at higher grounds?
Our analysis reveals a high probability of rejection at this critical level, setting the stage for a potential downturn. If our expectations play out, we could see BTCUSDT plummeting towards the $81K and $80K support zones. These levels will be make-or-break for the short-term trend, and traders would do well to keep a close eye on them.
Stay alert, stay informed, and let's ride the waves of volatility together! The market is full of opportunities, and with the right insights, you can navigate even the most turbulent of times.

(ETH) ethereum "triangle - slant"Ethereum is not priced for an only up direction as of right now, unlike Bitcoin. As seen in the chart and indicator. The pink and purple dotted lines are close to intersecting and if the pink link crosses over this is a good sign for the chance of a neutrality and even a possible upward forming price chart position.

Trading opportunity for SUIUSDTBased on technical factors there is a Sell position in :
📊 SUIUSDT
🔴 Sell Now
🪫Stop loss 2.8700
🔋Target 1.1100
📏 R/R 2
💸RISK : 1%
We hope it is profitable for you ❤️
Please support our activity with your likes👍 and comments📝

Bitcoin(BTC/USD) Daily Chart Analysis For Week of April 11, 2025Technical Analysis and Outlook:
In this eventful trading week, Bitcoin surpassed our key and completed Outer Coin Dip 78700 and another Outer Coin Dip 74500 target. As a result, we have robust rally development, and current development suggests a continuing rally as it aims to target a Mean Resistance level of 85200 and to retest the completed Interim Coin Rally 88400. There is also potential for additional target expansions. It is essential to note that a downward momentum may arise from the rechallenge of the Interim Coin Rally 88400 and/or the Mean Resistance at 75200.

Trading opportunity for LAYERUSDTBased on technical factors there is a Sell position in :
📊 LAYERUSDT
🔴 Sell Now
🪫Stop loss 1.6090
🔋Target 1.0666
📏 R/R 1,5
💸RISK : 1%
We hope it is profitable for you ❤️
Please support our activity with your likes👍 and comments📝

Bitcoin(BTC/USD) Daily Chart Analysis For Week of April 4, 2025Technical Analysis and Outlook:
In the course of this week's trading activities, we noted a successful retest of the Interim Coin Rally at 88400, with particular emphasis on the Mean Support at 82500. This development indicates the potential for an extension in a trajectory toward the previously established Outer Coin Rally at 78700. An upward momentum may originate from the Mean Support at 82500 and/or the Key Support at 79000/completed Outer Coin Dip at 78700.

LTO - Massive Support => Bullish Potential!Hello TradingView Family / Fellow Traders. This is Richard, also known as theSignalyst.
⚔️ LTO is retesting a massive zone , which marks the intersection of two key rejection points:
1️⃣ The $0.02 support level and psychological round number
2️⃣ The lower red trendline, acting as an oversold area
📚 According to my trading style:
As #LTO hovers around the blue circle zone, I’ll be watching for bullish reversal setups (such as a double bottom pattern, trendline break, and so on).
🏹 Moreover, from a medium-term perspective:
For the bulls to shift momentum in their favor, a break above both the upper red trendline and the blue structure is required.
📚 Always follow your trading plan regarding entry, risk management, and trade management.
Good luck!
All Strategies Are Good; If Managed Properly!
~Rich
