#btcstarburst Things are Looking Interesting?I don’t know THings are looking awfully interesting rights about now? End of year… I have been saying there could be a massive cup and handle forming into 2023 if a bottom single is forming? Even if we do strike a little lower we are splitting hairs at this point DCA safely DYOR… Trying to time the market is everything at this point… could we go to 10k, that s a hard sell… Side not Dfinitity (ICP) seems like it may be the big winner next bull run interesting enough this is a Gann study… Dcap a real state tokenization platform and others tokenization platforms/company’s will have 16 trillion dumped into them by 2030 DYOR…
Blockchain

Bitcoin - More short positionsBitcoin is in a critical situation, as it has been in recent months. This cannot guarantee a bearish trend in the medium to long term, but this is the most likely scenario.
Monthly chart: On a quantitative level, we can observe that on the monthly chart, the price is entering below the 70 simple moving average (the 210 is not yet developed), with an RSI of 40.
Weekly chart: On the weekly chart, the price is below the 210, 70, and 14 SMA, with an RSI of around 33, very low.
There is probably no trend-following system that gives a buy order on tokenised assets currently, given that the blockchain market is in a bearish phase.
One of the, at least, optimistic concepts of this scenario is that the weight of the trend that started in June of this year 2022 has a lot of strength, and therefore, if the channel is broken to the upside, there may be a lot of institutional and retail volume in the asset.
For now, we have short Sell Stop positions in place, as well as active futures positions and, for now, we are not placing bullish Buy Stop positions.
Obviously, whether the asset breaks to the upside or the downside, we will be in, although the most likely scenario is a bearish trend and the risk/reward ratios should be freer on these positions.

December 28 BTCUSD BingX Chart Analysis and Today's HeadlineBingX’s Bitcoin Chart
According to CryptoQuant, more than $19 billion in BTC, ETH, stablecoins left crypto exchanges since November 5, 2022. Bitcoin is down 1.22% over the last 24 hours and fell to an intraday low of $16,589.28. The cryptocurrency market has experienced record-low volatility as investors have largely stayed away during the holiday season. The price of Bitcoin has been fluctuating in a tiny range for the past few days, suggesting traders are not clear about the next directional move. The BTC/USDT is likely to stay in the $16,000-$17,000 price zone for the next few days.
Today’s Cryptocurrency Headline
Crypto Investment Firm Midas Shuts Down Platform
Iakov "Trevor" Levin, CEO and founder of Midas Investments, an investment company focused on DeFi yields, issued an announcement stating that the company decided to close its platform after suffering significant losses in 2022. Last spring, the Midas DeFi portfolio lost $50 million, or 20% of its $250 million in assets under management (AUM), and after the collapse of Celsius and FTX, its platform experienced over 60% of AUM being withdrawn.
Disclaimer: BingX does not endorse and is not responsible for or liable for any content, accuracy, quality, advertising, products, or other materials on this page. Readers should do their own research before taking any actions related to the company. BingX is not responsible, directly or indirectly, for any damage or loss caused or alleged to be caused by or in connection with the use of or reliance on any content, goods, or services mentioned in the article.

December 27 BTCUSD BingX Chart Analysis and Today's HeadlineBased on Bitcoin's recent behavior, it is still trading below the $17,000 resistance level, which it has been unable to break effectively. The quick recovery from last night's slight drop in Bitcoin is a sign of jittery market sentiment. If bitcoin does not break through resistance in the near term, it will continue to oscillate between $16,500 and $16,880.
Today’s Cryptocurrency Headline
Fidelity Filed Three Metaverse Related Trademark Applications
Fidelity has filed three metaverse related trademark applications with The U.S. Patent and Trademark Office (USPTO), covering NFT and NFT markets, virtual real estate investments, crypto trading, and metaverse investment services, according to The Block. Fidelity has embraced digital assets more than most large investment firms. In October, Fidelity said it planned to hire 100 more people in cryptocurrencies, expanding its digital assets team to 500. The company also launched commission-free retail crypto trading accounts in November.
Disclaimer: BingX does not endorse and is not responsible for or liable for any content, accuracy, quality, advertising, products, or other materials on this page. Readers should do their own research before taking any actions related to the company. BingX is not responsible, directly or indirectly, for any damage or loss caused or alleged to be caused by or in connection with the use of or reliance on any content, goods, or services mentioned in the article.

Going to Start another RIOT?Looks like this will be 50% cheaper shortly. Buckley up boys get ready for the recession.

BTC Detailed Top-Down Analysis - Day 120Hello TradingView Family / Fellow Traders. This is Richard Nasr, as known as theSignalyst.
120 out of 500 days done.
I truly appreciate your continuous support everyone!
Let me know if you like the series, and if you would like me to change or add anything.
Always follow your trading plan regarding entry, risk management, and trade management.
Good Luck!.
All Strategies Are Good; If Managed Properly!
~Rich

December 26 BTCUSD BingX Chart Analysis and Today's HeadlineBingX’s Bitcoin Chart
Bitcoin has been on a downward trend since it fell from $69,000 to the present without a decent rally. Bitcoin is currently in a low volatility range for a long time, and has yet to see a major upward or downward trend. If BTC can pull back $18, 500, then there is a reasonable chance that the decline will be reversed and a choppy climb will follow. However, there is not enough liquidity in the market for the Christmas holiday, so the cryptocurrency is still down.
Today’s Cryptocurrency Headline
Bitcoin Mining Companies Have Racked Up $4 Billion in Debt This Year
Bitcoin mining companies have been struggling under the weight of a year-long bear market, with collective debt expected to surpass $4 billion by the end of 2022, according to a report from Hashrate Index. The worst case is Core Scientific, which owes $1.3 billion to creditors and has filed for Chapter 11 bankruptcy. Marathon Digital owes about $851 million, but most of it is convertible notes, meaning its creditors can exchange them for stock in the company.
Disclaimer: BingX does not endorse and is not responsible for or liable for any content, accuracy, quality, advertising, products, or other materials on this page. Readers should do their own research before taking any actions related to the company. BingX is not responsible, directly or indirectly, for any damage or loss caused or alleged to be caused by or in connection with the use of or reliance on any content, goods, or services mentioned in the article.

Merry Christmas BitcoinThis has been my main focus this December, and it will continue being till Tuesday when we can expect more Data release to Support or Suppress Inflation for the next year.
We’re sticking to our strategy; till we see otherwise.
Holding Short long term. Projections towards 9k-7k
Ps. Hashrate had some influence today for sure, not really sure how The FED will play it on their plans for the Slow Growth Economy plan.
Merry Christmas!!
Cheers,

Is it possible that XEM like Bitcoin decides to be a butterfly?butterfly harmonic pattern:
AB=0.78 XA
BC=0.88 AB
CD=1.6 BC
or
CD=2.24 BC

Bitcoin (BTC/USD) Daily Chart Analysis For Week of Dec 23, 2022Technical Analysis and Outlook:
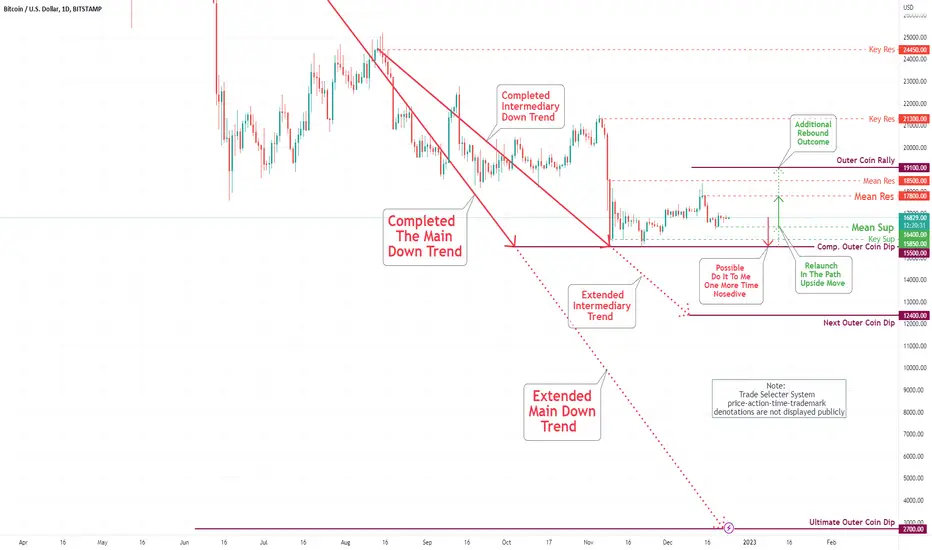
Bitcoin stays put above our Mean Sup of $16,400. The upward movement is in the process to Mean Res $17,800, extending to Mean Res $18,500 with high degree aftermath. The retest of the Key Sup $15,850 is continuously low at this time, pending the above scenario being played out.
December 23 BTCUSD BingX Chart Analysis and Today's HeadlineBingX’s Bitcoin Chart
Bitcoin price is almost flat over the last 24 hours. The largest cryptocurrency has been trading below the 20-day exponential moving average ($16,985) since Dec. 16, which has become a crucial resistance level. A breakout from here will potentially initiate an uptrend in the short term. The flattish 20-day EMA and the relative strength index (RSI) near 46 do not give a clear advantage either to the bulls or the bears. The BTC/USDT pair is likely to stay in the $16,000-$17,000 price zone until the holiday season is over.
Today’s Cryptocurrency Headline
Brazilian President Signs Off on National Crypto Rules
Brazil President Jair Bolsonaro on Thursday approved a crypto regulation bill recently passed by that country’s Chamber of Deputies and the Senate. The new law establishes a crime of fraud involving virtual assets, with a penalty of between four and six years in jail plus a fine. It also creates a “virtual service provider” license, which is to be requested by digital asset companies, including exchanges and trading intermediaries.
Digital assets that are considered securities will be regulated by the Brazilian Securities and Exchange Commission (CVM), while assets that do not fall into this category will be regulated by another yet-to-be-established agency. Companies will have 180 days to adapt to the new rules.
Disclaimer: BingX does not endorse and is not responsible for or liable for any content, accuracy, quality, advertising, products, or other materials on this page. Readers should do their own research before taking any actions related to the company. BingX is not responsible, directly or indirectly, for any damage or loss caused or alleged to be caused by or in connection with the use of or reliance on any content, goods, or services mentioned in the article.

Entering long in Sugar futures We have entered long in Sugar futures.
This position is not validated with all the patterns of our TTW system, so the percentage of liquidity assigned to the series of positions is very low.
Using our algorithmic trend-following system, Sugar futures are at 3-year highs, with an RSI of 63.57 on the weekly chart, and 65.64 on the monthly chart. The asset has broken one horizontal resistance and is above the 210, 70 and 14 SMAs, with a crossover between the 14 and 70 SMAs.
We have targets around 24 in the coming months, but there is a high probability of a pullback.
In the event of a pullback, we could re-enter.
Position :
Entry: Market price
Guaranteed trailing stop loss: 0.4% of the portfolio.
Target: 24-25.
Financial Engineering: Futures (without OTC derivatives)

December 22 BTCUSD BingX Chart Analysis and Today's HeadlineBingX’s Bitcoin Chart
Bitcoin is up 0.20% over the last 24 hours and rose to an intraday high of $16,916.63. The largest cryptocurrency has been trading below the 20-day exponential moving average ($16,985) since Dec. 16, and the bears have not been able to capitalize on this situation, which suggests that lower levels are attracting buyers. The flattish 20-day EMA and the relative strength index (RSI) near 47 do not give a clear advantage either to the bulls or the bears. The BTC/USDT pair is likely to stay in the $16,000-$17,000 price zone until the holiday season is over.
Today’s Cryptocurrency Headline
Core Scientific is Said to Possibly Sell Some Crypto Mining Sites in Wake of Bankruptcy
Core Scientific may sell up to 1 gigawatt worth of its sites under development after filing for Chapter 11 bankruptcy protection. Russell Cann, chief mining officer at Core Scientific, said the likelihood of selling assets in operation is close to zero, but the likelihood of us selling assets that are under development where we have power capacity and land and substations is high. Core Scientific is currently the largest company in the industry with around 800 to 850 megawatts of mining power. The sites it might sell are an extra gigawatt on top of that and were supposed to come online in 2023. The company filed for Chapter 11 bankruptcy protection early on Wednesday with a prearranged deal and plans to turn most of its debt into equity.
Disclaimer: BingX does not endorse and is not responsible for or liable for any content, accuracy, quality, advertising, products, or other materials on this page. Readers should do their own research before taking any actions related to the company. BingX is not responsible, directly or indirectly, for any damage or loss caused or alleged to be caused by or in connection with the use of or reliance on any content, goods, or services mentioned in the article.

#btcstarburst “THE CHRISTMAS HOPE”POSITIVE FUD… How about take a day off the leverage and and just buy some bitcoin, hold it for awhile… LOL. CHRISTMAS HOPE!!
DCA SAFELY. GANN Study

December 21 BTCUSD BingX Chart Analysis and Today's HeadlineBingX’s Bitcoin Chart
Bitcoin is up 1.65% over the last 24 hours and rose to an intraday high of $17,061.06. The largest cryptocurrency attempted to break above the 20-day exponential moving average (EMA) ($16,985), but the price was unable to sustain above the level, indicating that the sentiment remains negative and traders are selling on rallies. If the price stays below the 20-day EMA for another few days, that could mean the bulls lose the short-term advantage and the price could remain stuck between $16,000 and $17,000 for a few more days.
Today’s Cryptocurrency Headline
Christie's NFT Sales Fell 96% in 2022
Christie's sold 87 NFTs in 2022 for a total of $5.9 million. In 2021, the art auction house sold over 100 NFTs worth more than $150 million — one of them being Beeple's "Everydays: The First 5000 Days" NFT for $69.4 million. Christie's NFT sales fell 96% between 2021 and 2022. Christie's previously launched Christie's Ventures aimed at supporting emerging technology and financial technology companies related to the art market. In September, Christie's also launched the Ethereum-based NFT platform "Christie's 3.0".
Disclaimer: BingX does not endorse and is not responsible for or liable for any content, accuracy, quality, advertising, products, or other materials on this page. Readers should do their own research before taking any actions related to the company. BingX is not responsible, directly or indirectly, for any damage or loss caused or alleged to be caused by or in connection with the use of or reliance on any content, goods, or services mentioned in the article.

Fulfilling projections expectations 2023On Wednesday 14th December, 2022
We’ve placed an order at $18 140 to SHORT Bitcoin following our projections and Biz plan towards 2030.
Following our management plan; we expect to see more downside in Crypto Assets World.
Last week, the FED gave us every reasons to believe that growth will be retained; till we are able to see a better Economic Landscape in projections to the mid-ending of 2023 to the beginning 2024.
Carefully moving with wide eyes opened

BTC Detailed Top-Down Analysis - Day 118Hello TradingView Family / Fellow Traders. This is Richard Nasr, as known as theSignalyst.
118 out of 500 days done.
I truly appreciate your continuous support everyone!
Let me know if you like the series, and if you would like me to change or add anything.
Always follow your trading plan regarding entry, risk management, and trade management.
Good Luck!.
All Strategies Are Good; If Managed Properly!
~Rich

Eurusd sell limit 1.05700Hey trader eurusd trend change open maximum sell order .... bcz our target is 1.04660

For Crypto to "Win", it Has to Solve its Own ProblemsThe idea of "smart investing" comes with the assumption that the market rewards reason and punishes irrationality in the long-term. What they don't tell you, though, is that the opposite is often true in the short-term. If you want to make money, more often than not you do have to have the discipline to move contrary to what most are doing.
It's been almost a decade since I started getting into this stuff but the above still seems to hold true. Crypto has been mostly flat for about 6 months now, but has stayed mostly stable. The last bull run had a similar pattern where it climbed to new highs (BTC $4000→$16000, ETH $100→$1400) then went back down to where it was prior. (And stayed that way for a few years.)
The projects that were diligently working on their product even after the dip ended up reaping the rewards of the 2020 rally and did very well for themselves. The rivalries between Bitcoin, Ethereum, Dogecoin, Tezos, Cardano, Ripple, EOS, etc. were there even back in 2018, but the arguments were mostly about technical differences and felt less “personal”. This time, a lot of arguments you see on social media have more personal, political, ideological slants - a sign of the irrationality of mainstream money having arrived, perhaps.
For what it’s worth, despite the FTX scandals and the very negative media coverage of crypto in recent weeks, the price hasn't really moved all that much. Chances are good that the ones that were going to leave are already gone and we're only left with the ones who are in it for the long-haul. While the talking heads gripe about their losses in public, the builders will continue to build, pushing the industry where it needs to be for the future to come. That is the hope, anyway.
--
Long-term strategies only work if you're willing to wait at least one market cycle since the system needs time to work itself out - and I haven’t seen any exceptions to this rule, thus far. But having been through 3 crypto winters already, I’m starting to wonder what’s really taking so long for us to get to where we need to be - the “big ideas” in crypto (transparency, accountability, partnership automation) can already be done with distributed ledgers, but the industry has been slow to adapt to it, to say the least. The problem is that we're not really utilizing blockchain technologies the way we should be: case in point, when you look at all the people in the media and social media talking about how much money they’re making, how do we know if what they’re saying is actually true? We have no idea - we’re just taking their word for it, and now we’re finding out that many of them we’re just trying to lie and grift their way to the top. Whatever happened to "verify, not trust"?
Having gotten too used to low interest rates, the fiat markets are poised to be in big trouble over the next few years - if not more. The trends do say that when an economic system goes into disarray, crypto adoption tends to go up. But in order for that to happen, the crypto community does need to convince the world that it's safer to park their money in coins rather than fiat - which, if we're being honest - we're not quite there yet.
But unlike fiat institutions that are saddled with legacy and protectionist frameworks, crypto has the tools to fix itself if it wanted to - the advantage of being a new industry that has the energy and flexibility to adapt. The current irony is that crypto is suffering from the very problems it poised to solve - but a lot of it is holdovers of bad habits from Web2 and traditional fiat. You could probably argue the SBF's actions was a product of the fiat world, not crypto - there's a reason why there are those on the “inside” trying to protect him now. But FTX is also a preview, in a way, of what's to come to the fiat worlds as we head further into the recession - what they do to SBF could be them next - which is why they feel like they need to protect him at all costs, despite the blatancy of his misdeeds.
In a way, SBF did the industry a favor in getting the skeletons out of the closer earlier than later. For fiat, the tide is only just starting to pull. Crypto will either set the new standards for transparency, accountability, and decentralized governance - or it’s going to fall into old habits again and go to 0. (There is no reason for people to use crypto if it’s just going to be Web2.1 - the incumbents have that covered already.) It’s going to be an interesting ride over the next few years, either way.

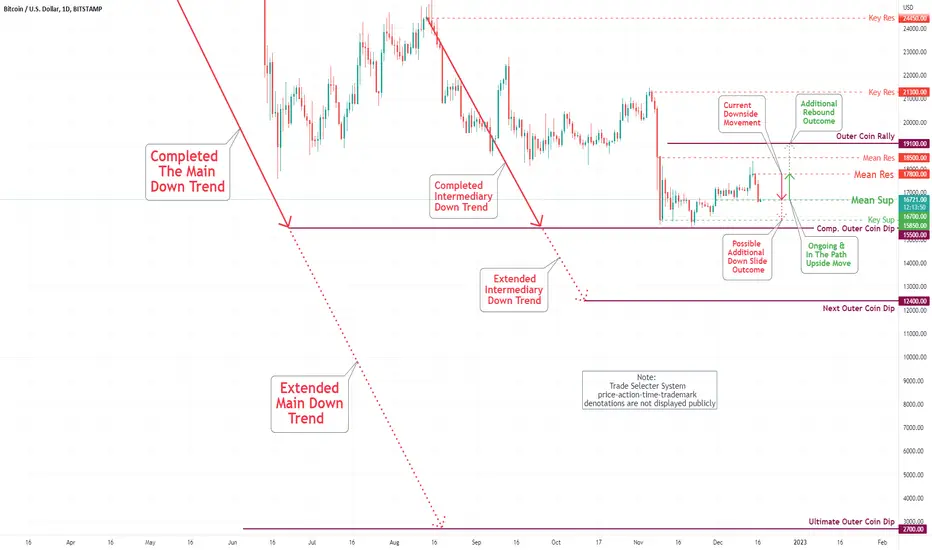
Bitcoin (BTC/USD) Daily Chart Analysis For Week of Dec 16, 2022Bitcoin diligently retreated to our Mean Sup $17,600 as specified on Bitcoin (BTC/USD) Daily Chart Analysis For the Week of Dec 9. The upward movement is in the process to newly created Mean Res $17,800, extending to Mean Res $18,500 with a high degree aftermath. The retest of the Key Sup $15,850 is the low probability at this time, pending the above scenario being played out.
December 17 BTCUSD BingX Chart Analysis and Today's HeadlineBingX’s Bitcoin Chart
Bitcoin is down 4.15% over the last 24 hours and fell to an intraday low of $16,528.49. The largest cryptocurrency turned down and broke below the 20-day EMA of $17,095 on Thursday, suggesting that the sentiment turned negative and the bears were selling the relief rallies. The 20-day EMA has started to turn down and the RSI has dipped below 43, indicating that bears are in command. If the price sustains below the 20-day EMA ($17,095), it could decline to $16,000.
Today’s Cryptocurrency Headline
Basel Committee to Enforce Standard on Banks’ Exposure to Crypto in 2025
The Basel Committee on Banking Supervision (BCBS) has approved its global crypto banking rules, which will come into force on January 1, 2025, according to a statement Friday. The BCBS, the main global standard-setter for prudential regulation of banks, recommends that banks should have no more than 2% exposure to certain crypto assets, and usually less than 1%. These particular assets are tokenized traditional assets including non-fungible tokens, stablecoins and unbacked crypto assets that don't meet classification conditions.
Disclaimer: BingX does not endorse and is not responsible for or liable for any content, accuracy, quality, advertising, products, or other materials on this page. Readers should do their own research before taking any actions related to the company. BingX is not responsible, directly or indirectly, for any damage or loss caused or alleged to be caused by or in connection with the use of or reliance on any content, goods, or services mentioned in the article.

December 16 BTCUSD BingX Chart Analysis and Today's HeadlineBingX’s Bitcoin Chart
Bitcoin is down 1.73% over the last 24 hours and fell to an intraday low of $17,275.51. Bitcoin is trending downwards after reaching a one-month high of $18,387 around the latest macroeconomic data and policy update from the United States, suggesting investors are worried about the future outlook of the U.S. economy. The relative strength index (RSI) is near the midpoint, indicating a balance between supply and demand. If the BTC/USDT pair drops below the 20-day EMA ($17,215), it could fall into the $16,500 - $17,000 zone again.
Today’s Cryptocurrency Headline
Ren DAO to Vote on Plan to Mint New Funding Tokens
The Ren community, which oversees a DeFi protocol that issues wrapped crypto assets, is considering the minting of new tokens to raise capital after the collapse of Alameda Research left the project without access to its funds. The proposal proposes four options for minting amounts, including 50 million, 100 million, 150 million or 200 million REN tokens, and a fifth option to reject the entire plan. At the current token price, Ren could raise from $4 million and $17 million. As previously reported, Ren stated that due to the bankruptcy of Alameda Research, the funds provided to the Ren development team will only last until the fourth quarter. Ren is negotiating with investors to continue to promote development and plans to launch Ren 2.0 earlier than expected.
Disclaimer: BingX does not endorse and is not responsible for or liable for any content, accuracy, quality, advertising, products, or other materials on this page. Readers should do their own research before taking any actions related to the company. BingX is not responsible, directly or indirectly, for any damage or loss caused or alleged to be caused by or in connection with the use of or reliance on any content, goods, or services mentioned in the article.

BTC - Trend-Following Setup! 📈Hello TradingView Family / Fellow Traders. This is Richard, also known as theSignalyst.
As per my last analysis (attached on the chart), BTC rejected the the 18k resistance and upper red trendline of the channel.
Now What?
We are still overall bullish trading inside the rising channel, and we currently entered a correction movement.
As BTC approaches the lower bound / lower red trendline, we will be looking for buy setups.
And this lower trendline also intersects with the previous highs marked in gray which makes the zone stronger.
As per my trading style:
As Bitcoin approaches the lower purple circle zone, I will be looking for bullish reversal setups on lower timeframes (like a double bottom pattern, trendline break , and so on...)
We would be overall bullish, UNLESS we break below the orange zone, in this case a movement till the lower bound of the range (around 15500) would be expected.
Which scenario do you think is more probable and why?
Always follow your trading plan regarding entry, risk management, and trade management.
Good luck!
All Strategies Are Good; If Managed Properly!
~Rich
