Bitcoin Finds SupportBitcoin caught a nice pivot from lows around $18.6K. This has proved to be a consistent lower bound with $17.6K an absolute floor if a selling wick were to come through. We should have resistance from current levels at or near $20K. If we are able to break through $20.7K then $22.4K is the next target, but we don't anticipate much momentum before the FOMC tomorrow.
Blockchain

September 20 BTCUSD BingX Chart Analysis and Today's HeadlineBingX’s Bitcoin Chart
According to CoinShare, digital asset investment products saw inflows totalling US$7m last week, another low activity week. Bitcoin price is almost flat over the last 24 hours. The largest cryptocurrency has been trading between $18,225 – $19,689.00, indicating the Federal Reserve's upcoming rate hike has put pressure on Bitcoin. In the near future, cryptocurrency markets are likely to remain volatile because of the uncertainty over the Federal Reserve’s rate hike on Sept. 20 and 21. As of now, the CME FedWatch Tool suggests that the majority favors a 75 basis point rate hike. If this happens, Bitcoin price could rise above $20,000.
Today’s Cryptocurrency Headline
Coin98 Labs Launches Decentralized Stablecoin CUSD
Coin98 Labs has announced the launch of its ecosystem’s decentralized stablecoin, Coin98 Dollar (CUSD), fully collateralized by reserve assets. In order to convert to 1 CUSD, a total of $1 worth of the collateralized assets must be sent into the CUSD Reserve smart contract. According to Coin98 Labs, the stablecoin aims to become a cross-chain unit of account that fulfills the demand for cross-chain liquidity in DeFi, unleashing the power of the Coin98 ecosystem and supporting networks such as BNB Chain, Solana, and Ethereum. In the future, CUSD will be deployed on as many chains as possible.
Disclaimer: BingX does not endorse and is not responsible for or liable for any content, accuracy, quality, advertising, products, or other materials on this page. Readers should do their own research before taking any actions related to the company. BingX is not responsible, directly or indirectly, for any damage or loss caused or alleged to be caused by or in connection with the use of or reliance on any content, goods, or services mentioned in the article.

Shorting BTC - Sell stop via futures.BTC is showing opportunities to execute risk-adjusted short positions through futures or DMA CFDs (avoid STP brokers). No matter if BTC bounces to the upside, we could also benefit from such situation, and we can place pending orders in order to take advantage of the most likely scenario on a quantitative and qualitative level: a mid-term downtrend.
Operation:
R/R ratio: 1/2.42 (risky)
Risk mgmt: 0.65% of our portfolio risked.
Wealth mgmt: We will average probably at 15 000 with the same R/R ratio.
Timeline: 2-4 months.
Exchange: OKX.
Financial engineering: futures.
Sell stop 1: 16 950.
Stop loss 1: 19 800.
Take profit 1: 10 050.
Sell stop, stop loss, and take profit 2: We will check it in the future.

Ethereum Dumps as the FOMC Meeting NearsEthereum tumbled over the weekend giving up several key levels of support. We have fallen quite far from recent highs just below $1800. We saw support at $1547, then $1424 for a bit. But antoher wave of selling took us further down to $1341, and we have just broken lower. We should see support at $1235. This was the upper bound of the ranging during the period where crypto was desperately trying to seek value at lows. The Kovach OBV is still bearish, suggesting we are not likely to see any bull momentum return any time soon.

Bitcoin Slammed as Investors Prepare for the Fed Rate HikeBitcoin got slammed as investors brace for another rate hike this week. All risk-on assets are selling off with Dow futures falling 200 points, and the S&P 500 testing relative lows. Bitcoin gave up the $20K's, finding support at $19.5K for a bit. Last night support gave and we tumbled further to support at $18.6K. We are currently seeing support here confirmed by a green triangle on the KRI, but it's also looking quite weak. Additionally, there is a lack of a pivot, suggesing that investors are still not enticed to buy back at these levels. If the selloff continues, then $17.6K is the next target. If we are able to pivot we will likely see strong resistance at $19.5K or $20K.

~$11 ATOM before relief bounce?Picture paints a thousand words, if ATOM breaks the neck line of $13.3, down to $11.45 which is also the 0.5 fib retrace before expecting any bounce.

Cosmos Double Top and 1hr bearish divergenceThoughts on ATOM?
Cosmos still has a Double Top and 1hr bearish divergence in play

Potential Cup and handle formingIf it breaks where the fib retrace is at 0.236 then up we go, get rejected, down we go, wait for confirmation

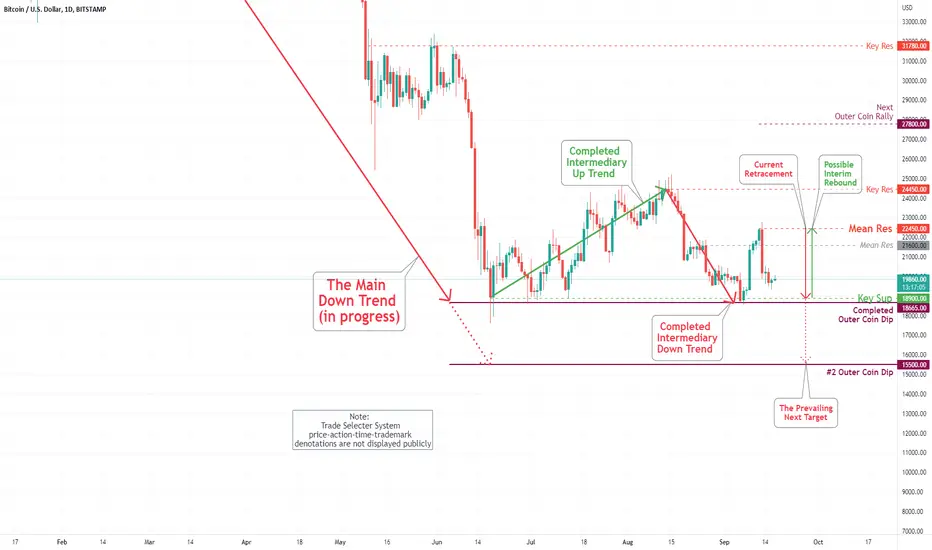
Bitcoin (BTC/USD) Daily Chart Analysis For September 16, 2022Technical Analysis and Outlook:
Bitcoin prices completed a rebound to our Mean Res $21,600 and some more as specified on ''Daily Chart Analysis For September 9''. Currently, the crypto is in the process of revisiting our Key Sup $18,900 and completed Outer Coin Dip $18,665 with the possibility of extending to the prevailing move to #2 Outer Coin Dip. There is a slight chance for a breakout to our Mean Res $22,450.
Perfect possible Double Top into the Cosmo?ATOM/USD
Bearish Case
- Double Top can be seen (white line)
- 1hr and 8hr RSI shows a exaggerated bearish divergence
- BTC is retracing, eventually ATOM will follow to in this bear market
Target Zone
- $13.41 (neck line of the bottom of double top)
- $12.81 (0.618 fib retrace)
- $11.60 (0.5 fib retrace & start of double top)
Bullish Case
- May break higher 8hr Histogram showing reversal
Thoughts?


Possible Bear Flag for ETHPossibility of a bear flag continuation for ETH, price target would be approx. $1400 if it is to hit.
Will the Eth merge send those to sell the news after buying the rumour?
Thoughts?

Possible Double Top for LUNALUNA/USD
Bearish Case
- Double Top formed and retested at $6.42 (0.236 fib retrace)
- Exaggerated Bearish Divergence on the 1hr
- Testing to break down of the ascending support line
- MACD on the 4hr looks to be turning bearish
Target Zone
- $4.888 (0.5 fib retrace)
- $4.202 (0.618 fib retrace)
- $1.99 (full retrace) given it is a double top
Bullish Case
- Stays within the supporting trend line and breaks the ascending triangle
Thoughts?

Shorting BTC againIn our last Bitcoin analysis with our TTW (trend-time-weight) system, we clearly positioned our portfolios for a very likely steady decline in the value of BTC with a target of $20K.
Now that we are here, BTC is in a stage 4 (bearish), entering the 210 MA average on the weekly chart (the reference for a bearish market in the mid and long run). Under no circumstances should we find buying opportunities right now if an active trading approach is implemented, only if a passive approach is sought.
Since early summer, BTC has been at a support which, if breached to the downside, the token could reach $11K-$9K levels. The RSI on the weekly chart is clearly bearish, at minus 34, and the MACD is clearly showing a downtrend that we could take advantage of with a quantitative trend-following strategy.
The probability of a trend reversal is actually very small in percentage terms, because the trend should first go through a stage 1, and then stage 2, but now it is still in stage 4, and it is quite a long way off (6-12 months, at least).
In terms of all our chartist, space-temporal, fundamental, economic and manipulative analysis, the most likely scenario is a downtrend to around $11,000 in the next few months.
Of course, we never know the future, and we are also prepared for a bullish pullback even if it is a very unlikely scenario, but professionally I would not see BTC as an interesting buy until the token reaches a value of around $30 000.
Strategy:
- Sell Stop: 16.500.
- 1st Stop Loss (0.25% of our portfolio value): 20.100.
- 2nd Stop Loss (0.5% of the value of our portfolio): 22.000
- 1st Take Profit (50% out): 11.000
- 2nd Take Profit (50% out): 9.000
- Margin requirements, swaps, spreads, execution model..: Depending on the derivatives exchange you use.

ABC correction for BNB $260 or $242BNB to head to previous support if we get rejected from this area, possible target areas are $260 and $242 as levels of support

Will Litecoin Find Support?Litecoin gave up the $60's, extending as high as $66.94, before crashing back down to support again in the $50's. We broke through several key levels after global markets sold off following red hot US inflation data, which impacted nearly every market including crypto. Litecoin is currently finding support at $55.84, but appears to be hanging on by a thread. If this level gives, then we will have support again in the lower $50 handle at $51.92 namely.
