BLURUSDT Forming Descending TriangleBLURUSDT is currently forming a descending triangle pattern, a structure that often signals a potential breakout — either bearish or bullish depending on key support levels. In this case, strong buying pressure and good volume hint at a bullish reversal from this consolidation phase. If price breaks above the descending trendline resistance, traders could see an upward move of 70% to 80%+, especially given BLUR's recent accumulation behavior and increased market interest.
The fundamentals behind BLUR, a token powering the Blur NFT marketplace, are also contributing to its market traction. As interest in NFT infrastructure and marketplace tokens grows again, BLUR appears to be regaining investor confidence. This renewed momentum aligns with the technical structure that shows tightening price action and lower volatility — often a precursor to significant movement.
Traders and analysts will be watching the breakout levels very closely. A sustained move above the upper boundary of the triangle, accompanied by rising volume, would provide a strong confirmation of the bullish scenario. With current on-chain activity and increasing social engagement, BLUR may surprise the market with its next impulse wave.
✅ Show your support by hitting the like button and
✅ Leaving a comment below! (What is You opinion about this Coin)
Your feedback and engagement keep me inspired to share more insightful market analysis with you!
BLURUSDT
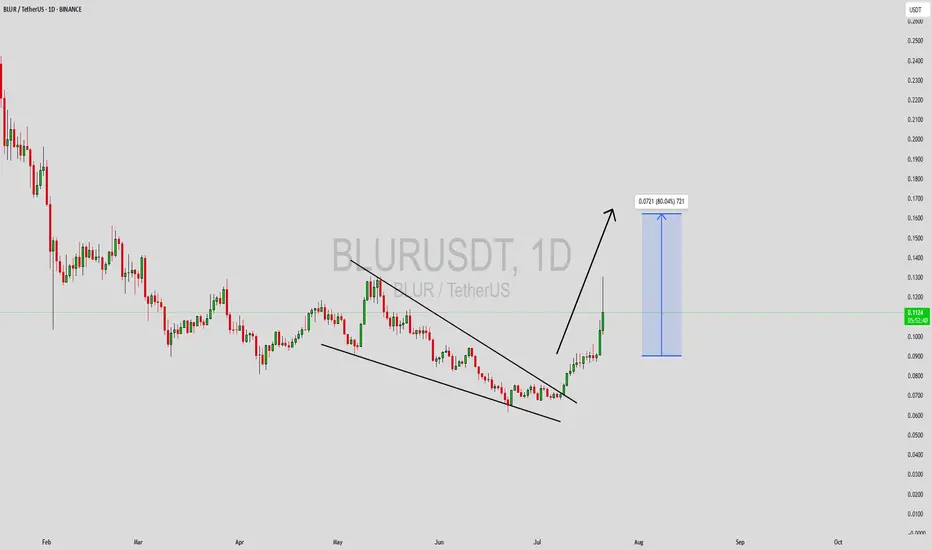
BLURUSDT Forming Bullish WaveBLURUSDT is currently shaping up a promising bullish wave that’s catching the eye of both swing traders and long-term crypto investors. With a strong surge in trading volume, this pattern indicates that fresh buying momentum is entering the market. Traders are watching closely for confirmation that BLUR can sustain this upward move, potentially delivering an impressive 80% to 90% gain if momentum continues to build over the next few weeks.
The BLUR token, known for its role in the decentralized NFT marketplace ecosystem, has been gaining traction as new developments and integrations add value to its use case. This increased investor interest is translating into healthy market activity and supports the idea that BLURUSDT could maintain its upward trajectory. The growing NFT sector remains one of the hottest trends in crypto, and BLUR stands to benefit as it continues to expand its user base and ecosystem.
From a technical analysis perspective, the bullish wave pattern suggests a strong push toward higher resistance levels if buyers can defend key support zones. Watching for consolidation and a series of higher lows will be essential for traders looking to ride the next leg up. If the crypto market remains favorable and Bitcoin stays stable, BLUR could hit its projected targets with relative ease.
✅ Show your support by hitting the like button and
✅ Leaving a comment below! (What is You opinion about this Coin)
Your feedback and engagement keep me inspired to share more insightful market analysis with you!

BLUR IS Super Bullish (2D)It seems that the price is moving within a diametric pattern, and based on the 3D timeframe, along with the break of the trendline, wave E appears to be completed. The price is now entering wave F of this diametric, which is a bullish wave and could extend up to the red zone.
A key level has also been reclaimed, which further strengthens the bullish outlook.
Targets are marked on the chart.
The analysis will be invalidated if a daily candle closes below the invalidation level.
For risk management, please don't forget stop loss and capital management
Comment if you have any questions
Thank You

BLURUSDT 2DBLUR ~ 2D Analysis
#BLUR If you still have a Conviction on this coin. Maybe this support you can consider to start buying back with a minimum target of 15%+

Trading opportunity for BLURUSDTBased on technical factors there is a Buy position in :
📊 BLURUSDT
🔵 Buy Now
🪫Stop loss 0.2655
🔋Target 0.3170
📏 R/R 2
💸RISK : 1%
We hope it is profitable for you ❤️
Please support our activity with your likes👍 and comments📝

Trading opportunity for BLURUSDTBased on technical factors there is a Buy position in :
📊 BLURUSDT
🔵 Buy Now
🪫Stop loss 0.2710
🔋Target 0.2950
📏 R/R 2
💸RISK : 1%
We hope it is profitable for you ❤️
Please support our activity with your likes👍 and comments📝

TradeCityPro | APEUSDT Calm in the NFT Market👋 Welcome to TradeCityPro Channel!
Let’s analyze one of the most well-known coins in the NFT space, which instantly reminds us of the NFT market whenever mentioned.
🌐 Overview Bitcoin
As usual, before starting the analysis, let’s take a look at Bitcoin on the 1-hour timeframe, where it seems the 92722 support has been faked. On the 4-hour timeframe, a good engulfing candle is forming near the year-end, which could be a positive sign.
Today's daily candle is very important. If it closes with good volume, we might consider a risky entry while keeping an eye on the market. If Bitcoin dominance rises, we might see Bitcoin's upward movement toward 115K, and if dominance falls, the altcoin market could offer better opportunities!
📊 Weekly Timeframe
In the weekly timeframe, we can see APE has risen from its last support at 0.557, finally showing signs of life and activity, which is promising for the NFT market, although more active projects like BLUR exist.
After being rejected from 1.883, the resistance level shifts to 2.335, which could mark the breakout point of the weekly box. Breaking this level could act as a trigger for buying, with a stop loss at 0.892.
If 0.892 breaks, it’s logical to set your stop loss below 0.557. Even if you are holding from before, it makes sense to exit your position and cash out below this level.
📈 Daily Timeframe
On the daily timeframe, after the break of 0.894, it was possible to buy with either a Risky stop loss at 0.67 , Secure stop loss at 0.545
If this trade was taken, it would have been reasonable to exit the initial investment at 1.943. If not, it’s better to currently do nothing and let the stop loss hit.
For re-entry, I’d likely wait for 1.943 or 1.269 to break while watching for capital inflow into the NFT market. Personally, I’d focus on other coins in the NFT space with newer features.
During the upward movement, volume increased, and during the correction, volume decreased, which is a positive sign for the bullish trend. Unlike some coins that returned to their daily boxes, APE hasn’t, which makes it slightly more bullish.
⏱ 4-Hour Timeframe
In the 4-hour timeframe, after the drop and rejection from 1.903, sellers are currently active, and the coin is within a box that defines its next move.
📈 Long Position Trigger
The strategy is clear—wait for a break of 1.280 with increased volume to open a long position. Be mindful of market conditions and manage risk with smaller position sizes. The current 4-hour candle looks promising.
📉 Short Position Trigger
After breaking 1.174, a short position can be opened with a target of 1.024, but use a tight stop loss. Once you hit your desired risk-to-reward ratio, manage the position or take profits quickly.
If stopped out, take a temporary break from the market.
📝 Final Thoughts
Stay calm, trade wisely, and let's capture the market's best opportunities!
This analysis reflects our opinions and is not financial advice.
Share your thoughts in the comments, and don’t forget to share this analysis with your friends! ❤️

blurI hope this area is green, and if it can't hold, we should come and check further down the lines.

BLUR 1D. New Opportunities: My Updated Spot and Futures 12/16/24We’ve already hit previous targets for our futures position, and now I’m considering re-entering both spot and futures trades.
During the correction, the support level at $0.2920 was once again held, signaling strong bullish sentiment among buyers. This strength likely indicates further price growth ahead.
Here are my updated targets: $0.5827, $0.7328, $0.8341.
My forecasts aren’t rules — they’re my personal strategy and trading journal. What you do is your decision!
DYOR.

BLURUSD - W PatternLooking for the W pattern to enter the bull curve and pump continues to the prior ATH
Bullish soon on this NFT coin

#BLUR/USDT#BLUR
The price is moving in a bearish channel on the 12-hour frame and is largely sticking to it
We have a green support area at 0.3280 that is expected to be bounced from due to its strength
We have a trend to hold above the Moving Average 100, which is strong support for the rise
We have very strong oversold resistance on the RSI indicator to support the rise with an uptrend that has been broken
Entry price is 0.3337
The first target is 0.3784
The second target is 0.4096
The third goal is 0.4482

BLURUSD - Down Channel BreakoutA breakout of this daily down channel is a bullish situation for BLUR
I expect a retest of the upper channel line sort of forming an inverted H&S which I have shown with the bars pattern. Then a Moonshot upwards.

Blur USDT 45% potential Spot tradeBLUR/USDT exhibits a 45% potential upside in the spot market, contingent on a breakout from current resistance levels and sustained buying momentum. Positive news around the Blur platform or rising NFT market activity could act as strong catalysts for this price surge.

#BLUR entry range (0.1443 - 0.1508 ) SL .4H close below (0.1399)#BLUR
entry range (0.1443 - 0.1508 )
SL .4H close below (0.1399)
#BLUR
#BLURUSDT
#BLURUSD
#swingtrade
#shortterminvestment
#ALTCOIN
#Cryptotading
#cryptoinvesting
#investment
##trading
#cryptocurrencytrading
#bitcoininvestments
#Investing_Coins
#Investingcoins
#Crypto_investing
#Cryptoinvesting
**** #Manta ,#OMNI, #DYM, #AI, #IO, #XAI , #ACE #NFP #RAD #WLD #ORDI #BLUR ****
#bitcoin
#BTC
#BTCUSDT
BINANCE:BLURUSDT

#BLUR 1D: Retest or Rally – Setup Inside! 11/25/24The Blur token (BLUR) is the primary cryptocurrency of the Blur Network, a platform designed to provide private and secure transactions with a strong focus on user privacy.
Here’s how I see it: ready for a retest and then a move higher. It might even go higher without a retest.
Setup on the chart.
DYOR.

Blur USDT Spot trade 15% potential BLUR/USDT is showing signs of a potential 15% rally based on recent price action. The chart indicates a consolidation phase nearing a breakout point. Traders should watch for key resistance levels to be breached, and confirmation from volume and momentum indicators like RSI could signal the beginning of the pump. Keep an eye on support levels to manage risk in case of any pullbacks. 📈 #BLUR #Crypto #SpotTrade

BLUR ANALYSIS🚀#BLUR Analysis : Pattern Formation
🔮As we can see in the chart of #BLUR that there is a formation of Inverse Head And Shoulder Pattern and it's a bullish pattern. Also we can see a breakout here. Around 30-40% bullish move is pending in #BLUR
🔰Current Price: $0.2370
🎯 Target Price: $0.3310
⚡️What to do ?
👀Keep an eye on #BLUR price action. We can trade according to the chart and make some profits⚡️⚡️
#BLUR #Cryptocurrency #TechnicalAnalysis #DYOR

BLUR - 3D bullish divergence I will keep it simple for this one. There is a bullish divergence forming od D3 for BLUR, both on RSI and AO. The same divergence formed on CRV a few days ago, and CRV pumped 20% in a day shortly after, making it one of the best performers of the day/week.
The fact that both RSI and AO are forming the same divergence is a plus In addition they are forming on very high time frames, which is usually a good sign it just means it might take a bit longer to play out.
Entered at 0.157, which is also a big support level.
Target is range high at 0.22ish
Happy trading

Is it an application chain or a new staking trap? ---- BLURSuch as RST protocol, BTC Layer-2, BLAST, etc., more and more activities of staking to obtain points are appearing in the market. However, after participants obtain the airdrop, they will find that the value brought by the airdrop is often difficult to cover the depreciation of the token during the lock-up period. From a protocol perspective, we believe that staking with application scenarios such as EigenLayer are meaningful. But staking for airdrop points is just locked farming.
Recently, BLAST conducted a TGE and airdropped tokens. Compared with BLAST, DYDX, which also upgraded the protocol to an application chain, did not introduce new tokens and did not lay out airdrop traps. The upgrade is just for a better user experience. After BLAST promoted interest-earning assets in the early stage, it almost focused on the airdrop expectations brought by the staking, which is the same as many BTC Layer-2.
So, money comes, money leaves. When BLAST conducted a TGE on June 26, a large amount of unlocked BLUR turned into selling pressure. Of course, maybe BLAST Pro is on the way, and you only need to stake BLAST to get new points.
Back to our indicators. We can see that the TSB indicator performs almost perfectly on BLUR. Take away both the rising and the falling gains. BLUR is still in a bearish trend at the moment and has seen a clear decline with heavy trading volume after the TGE, which will act as short-term resistance.
Introduction to indicators:
Trend Sentinel Barrier (TSB) is a trend indicator, using AI algorithm to calculate the cumulative trading volume of bulls and bears, identify trend direction and opportunities, and calculate short-term average cost in combination with changes of turnover ratio in multi-period trends, so as to grasp the profit from the trend more effectively without being cheated.
KDMM (KD Momentum Matrix) is not only a momentum indicator, but also a short-term indicator. It divides the movement of the candle into long and short term trends, as well as bullish and bearish momentum. It identifies the points where the bullish and bearish momentum increases and weakens, and effectively capture profits.
Disclaimer: Nothing in the script constitutes investment advice. The script objectively expounded the market situation and should not be construed as an offer to sell or an invitation to buy any cryptocurrencies.
Any decisions made based on the information contained in the script are your sole responsibility. Any investments made or to be made shall be with your independent analyses based on your financial situation and objectives.

#BLUR/USDT#BLUR
The price is moving in a bearish channel on a 4-hour frame and is holding it strongly and is about to break it upward
We have a bounce from the green support area at 0.2300
We have a tendency to stabilize above the Moving Average 100
We have a downtrend on the RSI indicator that is about to break higher and supports the rise
Entry price is 0.2500
The first target is 0.2967
The second target is 0.3300
The third target is 0.3700

BLUR is still bearishThis analysis is an update of the analysis you see below in the "Related Ideas" section
In the previous analysis, we identified a falling triangle for BLUR
The E wave of this triangle has just finished and the main drop for the new pattern can start around here.
Considering that our triangle is a counter, the upcoming drop looks very heavy.
By maintaining the specified supply, it can move towards the targets.
Closing a daily candle above the invalidation level will violate the analysis
invalidation level : 0.4662
For risk management, please don't forget stop loss and capital management
When we reach the first target, save some profit and then change the stop to entry
Comment if you have any questions
Thank You

BLURUSD - Falling WedgeThe down period for BLURUSD has allowed a falling wedge to form
Along with a strong support level being hit in green circle this is a candidate for a reversal point
Blur has performed really well in the NFT space and I expect this trend to continue.
See if a bull move comes once the dashed green line is hit.

BLUR/USDT Bullish Horizon from demand? What next 👀🚀💎 Paradisers, turn your attention to #BLURUSDT as it exhibits a promising potential for a bullish reversal from the demand level at $0.4413. Should it sustain momentum here, there's a strong likelihood of initiating a bullish advance, with aims to breach the supply zone and target our outlined strong resistance area.
💎 Notably, #BLUR has recently escaped a descending channel, signaling the beginning of a bullish trend. It is currently regathering strength at the demand level, which serves as a supportive base, enhanced by its position above the EMA—a factor that bolsters our optimism for an impending ascent following brief EMA interactions.
💎 Detailed analysis of the VRVP indicates substantial volume at this level, enhancing the probability of continued upward movement. However, vigilance is essential: if the price fails to maintain this level and falls below the demand, our attention will shift towards a bullish recovery from the next key demand and FVG area at $0.3632. Breaking below this level could challenge the bullish perspective, potentially leading to extended price declines.
💎 As always, employing wise trading strategies and establishing precise stop-loss measures are imperative. Stay vigilant and keep an eye on further market developments and insights.
MyCryptoParadise
iFeel the success🌴
