[4h] BTC forming bullish flag at ATHBitcoin will likely form bullish structure here at ATH as we near a breakout. A bull flag or a falling wedge will create significant momentum and push BTC towards 125k+ on initial wave. Cycle top remains ~150k.
BLX

a possible massacre.what if i told you that bitcoin could drop 50% before june is over?
i know that probably sounds extreme. maybe even a little unbelievable. and that's okay; most people react that way when faced with a scenario they weren't prepared for.
i’m not here to scare you, and i’m not trying to make a bold claim just to get attention. i’m here to share a message that comes from a rare, proprietary sell signal in our system; something that doesn’t trigger often, but when it does, we pay very close attention.
i believe there’s a real possibility bitcoin drops below 50k by the end of june.
---
here’s the technical stuff to anyone interested:
since the bottom in november 2022, bitcoin moved up in a clear five-wave pattern, peaking around january 2025. from there, it seems to be forming what’s known as an expanded flat correction. this is a three-wave structure (3-3-5) that often tricks the crowd before the next major move begins.
ironically, this potential drop doesn't change the bigger picture at all. i still believe the long-term target sits between 750k and 1m by year-end. but markets don’t move in straight lines; sometimes, they shake out everyone who’s too confident, right before taking off.
consider this a heads-up,
not a certainty,
but one worth preparing for.
---
ps. the stop-loss on my btc long sits at the target of this idea. if i'm right about this, my stop will get hit, and it will open the door to a new entry.
---
🌙

$BTC back to $59-62kAs you can see from the chart, BTC is rejecting from the range highs which sets up the next (and final) leg lower before we continue the bull run.
Despite the bounce over the last few weeks, all we've done is retested the area which we broke down from back in February.
Now this sets up a large move lower down to the lower support levels at GETTEX:59K -$62k.
After we tag those levels, we'll continue our next move higher into 2026-2027.

The Perfect Bounce- Quick update
- IYKYK.
- Everything is in graph, no need a long speech.
Happy Tr4Ding !

Bitcoin are you Worried ?Everything is in chart.
- Like i said many times, more you look from far, more it's easy to predict the future.
- This Monthly Chart combinated with indicators show you how BTC moved in 2016-2017 BullRun so keep eyes open and you will find the way for 2020-2021.
- We cannot compare a Bullrun from 400$ to 20,000$ with a Bullrun From 4000$ to 3XX,XXX+$, the chart will be exponential. We are now playing with big numbers.
- imo right now we are in fake bear market stage, this stage happened also in 2016-2017 pre-bullrun ( but Numbers were smallers...), whales are just trying to create fear and remove retails investors.
- Actual stage could be a Consolidation Phase, if Whales see there's a lack of interest, they will push BTC up, or we could get a quick fast Trap to 20,000$ if Whales feel Retails not fear enough (Not sell their BTC).
- 100 000$ Target is still very preservative, past this stage it will be the FOMO Stage to go Higher!
TheKing is dead??? Long live TheKing!! :D
Happy Tr4Ding !

Market Update - This Stock Market Analysis Aligns With Bitcoin..What if I told you that the stock market’s pattern could actually reveal what’s coming next for Bitcoin—would you stick around and watch the entire video? That’s exactly what I’m diving into here. I didn’t force this analysis to fit; somehow, over the past week, it just lined up this way.
In this video, I break down exactly why the next market move could be more severe than anything we’ve seen in our lifetime—yet it’s not the end of the world. In fact, if approached correctly, this could be the opportunity of a lifetime. The rebound that follows could be massive.
I’ve always had a gut feeling about this, but now the patterns are speaking loud and clear. This is the reason I created AriasWave—and this is exactly where we are right now.
This also aligns with my latest Euro analysis linked below in related ideas.

bitcoin enters a hyper-parabolic state to 753kgm,
this was initially a private post,
but i've decided to open it up to the public, for the people.
---
interest rates are collapsing. not slowly. not in a controlled, measured descent. this is a freefall. the kind that rewrites economic history.
monetary debasement is inevitable. quantitative easing will accelerate, liquidity will flood the system, and the us dollar will plunge. this isn’t speculation. this is math.
and when that happens, the gates open. the largest alt season in history is not a possibility. it is an inevitability. this will be the kind of move that people will talk about for decades. portfolios multiplied beyond reason. valuations pushed to levels most can only dream of.
the everything bubble will expand beyond comprehension. people will call it unsustainable. they will call it madness. but madness is where the greatest opportunities are born.
most won’t be ready. they will hesitate. they will overthink. they will sell too early,
watching in disbelief as the market leaves them behind.
we will not.
🌙
---
tp - 753k

BITCOIN - Short Trade Entry - Minor Wave ii Looks Complete...The video idea for this chart is linked below. The current thesis is that minor wave ii has recently completed, confirmed by a retest and rejection of the previous key level at 81,222. Additionally, a brief touch of the 0.618 retracement level supports this view, along with the overall wave structure, suggesting that wave ii is complete and we are now in the early stages of wave iii to the downside.
This third wave may start off slowly due to initial market uncertainty, but as sentiment clears, price action typically aligns with the dominant trend—which, in this case, is down.
While it may be a bit premature to lower the stop until we break below 75,786 (the start of Wave E), that level is quite far, and it may be more prudent to keep the stop at recent highs for now. Ultimately, your stop placement should reflect your comfort level with the wave count and risk tolerance.
If the analysis holds, the rejection at 81,222 becomes a logical stop-loss level for a fresh short position. The target remains unchanged at 61,000.

BITCOIN - Short Trade Idea Update - Wave ii Looks Complete...In this video, I break down what I woke up to this morning regarding the wave structure.
With wave ii appearing to be complete, I’m looking to add to my short position and adjust my stop level down to 81,223—creating another potential entry point for the short trade.
Recognizing and understanding these developing patterns is essential if you want to stay in the game.

BITCOIN - Short Trade Idea - Targeting $61K Area...This idea is explained in the video linked below.
The price action speaks for itself, and it’s hard to ignore what looks like the end of the recent correction. A break below $81,222 would confirm this view.
Short Entry: $81,222
Stop Level: $84,715
Target: $61,000

BITCOIN - Price Could Be Heading Towards 60K...After multiple rejections at higher price levels, the most recent major rejection—followed by a break of the lows—suggests that the corrective move we've seen since the end of February may have concluded.
In this video, I outline the key reasons why a larger upside move no longer appears likely.
With the potential end of the corrective wave combinations now in sight, I'm shifting to a bearish outlook, targeting a potential move down to $61K. To validate this view, we need to see a break below $81,222, confirming the start of a deeper breakdown.
As it stands, I can no longer support a short-term bullish scenario unless we see a strong break above $84,715. However, given the recent sharp move to the downside, this seems unlikely and may, in fact, mark the beginning of a larger downward trend.

BITCOIN - Long Trade Price Action Update...In this video, I break down the latest price action while incorporating some AriasWave analysis along the way.
There's nothing unusual happening—just psychological reactions testing your patience.
Welcome to the world of trading lol, where you can be riding high one moment and facing losses the next, shifting between excitement and frustration.
Today, I dive into the psychology of trading—what drives a trader’s mindset, the balance between logic and mental discipline, and how mastering both can help grow your bank account. Everything begins in the mind, whether it’s knowledge or habit.
I remain bullish, and while the external picture hasn’t changed much, what about your internal one?

BITCOIN - Long Trade Update - Third-of-a-Third Wave Incoming...In this video, I share an update on the developments I've observed since yesterday as we prepare for a move higher in a third-of-a-third wave.
As price movements become smaller and sharper at lower degrees, identifying the correct count becomes more challenging.
That’s why I always consider bearish alternatives and play devil’s advocate. However, at the moment, I don’t see any conflicting signals, so it’s just a matter of waiting for the next upward thrust to begin from here.

BITCOIN - Long Trade Idea - We have Wave 3 Confirmation...We have had confirmation of Wave 3 In Progress.
I will be initially looking to target the .786 retracement back to the highs.
Check out the related videos down below for the full coverage of this trade.
Stay tuned for more updates.
Target $102,886
Stop: $81,274

BITCOIN - Long Trade Idea Update - We Could See One More Low...In this video, I discuss why Bitcoin may still make another low before the Wave 2 correction is fully complete.
Upon closer examination of Wave iv in the previous Wave 5 correction, it appears the level where Wave iv ended was slightly miscalculated.
Technically, Bitcoin should have dipped below the perceived low, but either its strength has prevented this, or the ongoing correction is nearing completion.
The key level to watch is $82,445—if Bitcoin breaks above this, we should continue higher.
However, it’s more likely that we first dip below $81,274 before experiencing a strong upward move.
Pay close attention when Bitcoin makes another low, as the reversal could be sharp, potentially piercing through $82,445, which would confirm the trend shift.
If we make a new low then I would suggest price would turn back up after tagging $81,071.

BITCOIN - Wave C In Progress - Wave 2 Ended At 81,274...According to the latest count, Wave 2 of Wave C appears to have completed at the recent lows. I’ll be posting a video soon to explain my analysis.
From here, we should see a steady price increase.
There's no target yet—we need a confirmed break above 88,788 for more certainty—but this count offers an opportunity to enter near the lows for those willing to take the trade.
Stay tuned for the video!

BITCOIN - Wave 3 of Wave C In Progress - Wave 2 Breakdown...In this video, I break down why I posted the earlier chart (linked below).
After studying this pattern for hours, I finally decoded the Wave 2 correction for Wave C—just in time to take a long trade at support.
A solid protective stop is around $81,274, while a break above $82,759 offers partial confirmation.
The key confirmation level, however, is $88,788. Since that’s still quite far, AriasWave allows for early entries if the analysis proves accurate. Given the large 1-2 formation, I anticipate price moving close to all-time highs, but I’ll keep you updated along the way.

BITCOIN - Small Long Trade Within Wave iii Zig-Zag...In this video, I break down a straightforward long trade based on an internal corrective zig-zag pattern.
This setup demonstrates how to capitalize on short-term trades with a solid risk-reward ratio, securing profits before looking for a re-entry opportunity.
The trade aligns with the anticipation of Bitcoin approaching its recent highs, potentially forming a double top. Currently, the trade has a protective stop at $83,169 and a target of $89,176.

BITCOIN - The Bearish Scenario - Sign's of a Possible Top...In this video, I explore the possibility that Bitcoin may have already hit a temporary peak.
My perspective comes from initially building a bullish case—only to uncover subtle flaws that I chose to set aside.
But as I meticulously documented my observations, those cracks in the bullish argument became impossible to ignore. When I switched to a bearish wave count, some thing began to align, shedding light on areas of the chart that previously seemed uncertain.
These market waves are intricate, requiring patience and a fresh perspective to decipher where we truly stand in the broader pattern.
Only after stepping back and allowing time for meaningful price action does the picture start to come into focus.
I also touch on Ethereum's pattern and the Dow Jones.

BITCOIN - Key Buying Area 74K - 76K Range At Wave iv Low...In this video, I break down a potential scenario that could initiate a major surge in Wave v of Wave 5.
If this is the final move, it should be strong—possibly even sharper than Wave iii.
I outline the key buying zone, which represents the lowest point price may reach before reversing into a powerful impulsive move.
My plan is to go long within the $74K–$76K range, adding to the position as momentum builds.
Ideally, I’m targeting $120K, as it aligns with the length of Wave iii.
Based on my analysis, the low for Wave iv is likely around March 31st, with $73,880 acting as key support. Stay tuned for more updates!

BITCOIN - Wave Count Update For Long Trade Idea...A slight shift in the overall interpretation of this structure.
We're still watching for a break above 93K for confirmation, but for those who trade with leverage, this analysis could provide an edge.
If it plays out as expected, we may see a fairly tight stop.
A decisive move higher is needed soon to confidently validate this setup.

BITCOIN - Long Trade Idea - Possible Move Higher Incoming...This video follows up on the chart I posted last night, where I suggested that Bitcoin could break past its all-time highs and potentially double in value from its current levels.
This analysis is based on the AriasWave methodology, which offers a clearer perspective compared to the often-confusing Elliott Wave approach.
Check out the related idea below for the original chart, and in this video, I update that analysis with key levels to watch and potential risks to consider.

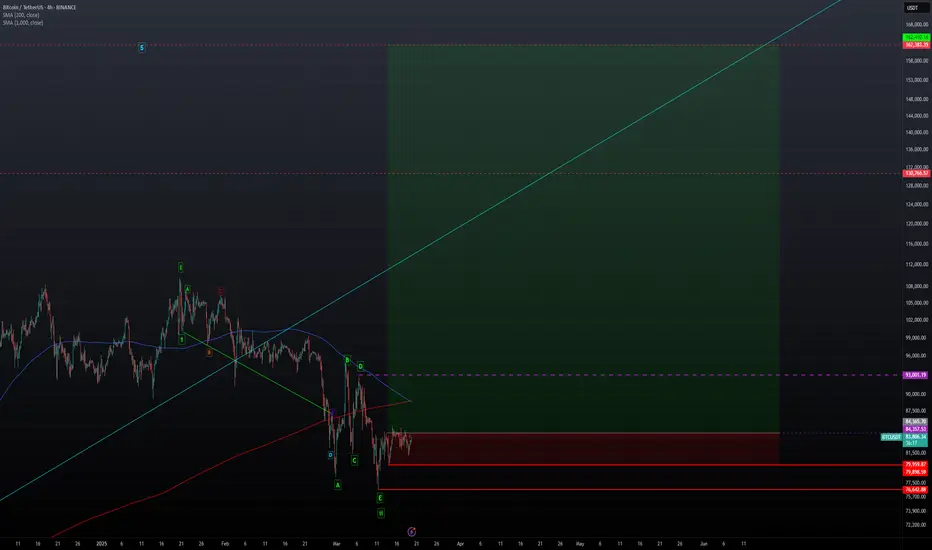
BITCOIN - Long Trade Idea - Last Chance For A Big Move Higher...I see a potential scenario where Bitcoin could move higher in Wave iii of Wave 5. If this pattern holds, Wave 5 would extend. For confirmation, we need to see the price break above 93K. However, if Wave ii ended at 76,642, there’s a chance we’re witnessing a 1-2, 1-2 setup that could push through this level. A strong follow-through would open the door for a move to at least 130K, equal to the length of Wave i, or possibly a 1.618 extension to 162K—roughly doubling from current levels.
Despite the broader bearish sentiment, this setup can't be ignored, as our priority is profit. If the price confirms, I’ll post a video update soon. Key support stands at 79,959, with critical support at 76,642.