Ranging around abyss.Nice Sunday.
Today, I developed another view with more data,
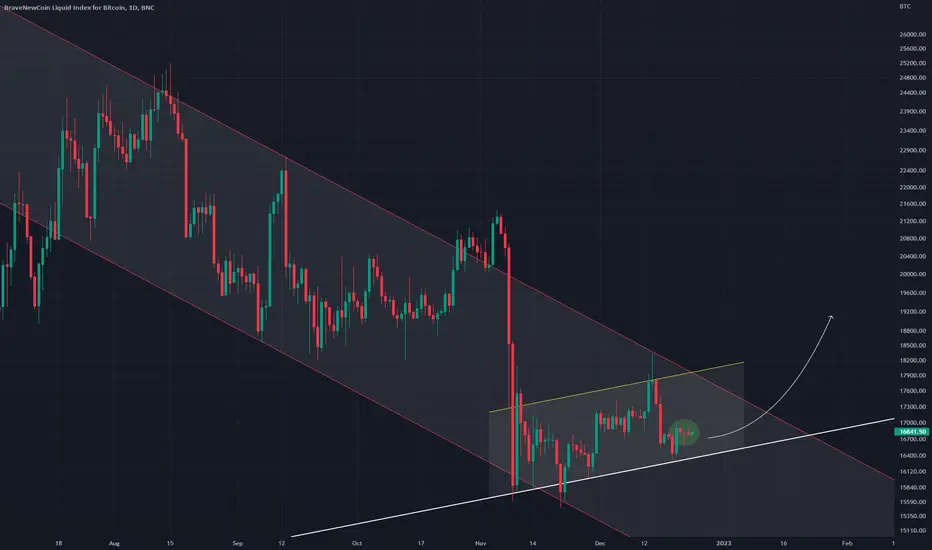
at daily Index time frame .
Bitcoins actually ranging between 2 Fib rings,
very important for next trend decision.
I am mentioning this territories about month and maybe
result is very near. RSI and MACD are in conflict,
while altcoins start follow BTC upside move.
This usually happened at the end of waves,
as we are in from of 4th.
We can confirm, RSI is historically overbought,
and MACD runs also into symetrical triange resistance,
made by All time high.
Would this trigger start of 5th wave around February,
or this is different from 2008 stock market crash ?
Very good question that nobody can answer.
So I will monitor what will happen in a next weeks.
Always with care and ready,
Emvo.
*This is not any financial advice.
BLX

A Booom ahhh, cognitive count Strong B happens when A is three waved because it feels like completion of a zig zag and an end to correction, herding behavior
Normally the herd can't identify the A and they buy a long term position and In case of btc a flat can probably have the same effect, cognitively
I will not be surprised to see btc at a new low because structure based wave count has that on the table then B, of course for my level of skill however I think we are in the B of a zig zag and B might end higher than ath, flat for flat?!!
To know why the first flat is a wrong one check the related idea
Patience is virtue of kings
If you know a very good book for golden mean and Elliott wave count then introduce me ...


We are very close to the bottom.The FTX bankrupcy shocked everybody and with that being written down into history we are quite near or have already had the final capitulation.
Here I'd like to make the distinction between hitting the bottom and trend reversal, a trend reversal usually takes time to print a reversal pattern of some sort, it might be an Adam&Eve, or Ascending Triangle, or Rounding Bottom, with the exception of a very hard to catch 'V shaped' reversal.
In terms of timing I've put on the Fib Time Zone tool(Love tradingview!) and interestingly we are at 1.618 in which pretty much every previous bottom lands.
Please note that as for the time being we still haven't got into any trade, we are monitoring shorter time frames for an entry. (yes we are timing the market and we are good on it)
Just sharing this information to you guys and keep your precious money safe for the next bull run, Take care until next time!
###NOT FINANCIAL ADVICE###

AW Bitcoin Analysis - The Definitive Conclusion Chart...Please take a moment to imagine such a scenario in which these waves could play out.
It might have something to do with US Dollar strength and higher interest rates.
On a positive note, we all know what comes after Wave 2.
Would you rather use the waves to determine future price action or a lovely hopium chart full of rainbow ribbons and death crosses, I mean moving averages.
Of course, this is just a logical way of looking at a chart but logic flies out the window when you have your Lambo lenses on.
It may not go that low or it might go lower. No one can really know what the state of the world will be during that time.
Asset prices may have declined significantly priced in worthless FIAT.
Social unrest, war, famine, pandemics and supply chain failure.
We don't really know but we do know that what goes up must come down, even if that means it will go up harder later.
Please see all related wave analysis videos linked below.
Remember to use Disciplined Money Management Principles to ensure longevity as a trader.
If you don't know the long term pattern shouldn't you be doing your research instead of just following the crowd?
Just remember: I am not a financial adviser; I suggest using this only as a guide. Always do your own research.

AW Bitcoin Analysis - The Definitive Conclusion For Bitcoin...If I had a Bitcoin for every troll that has trashed my bearish view before 2022 I would of sold it already.
In this video I talk about the waves as I always do except this will be like rubbing salt in the wound for some.
Or maybe even like rubbing sulphuric acid into the wound for others.
Emotions aside it's time to get real and pay attention to the possibilities.
This analysis is based on probabilities, but I think it's probably going to happen.
I am going to post a chart idea after this that gives you an artist's depiction of what that may look like.
A beautiful head and shoulders pattern is what I envision in my creative mind.
Ok so I can't draw well but I did create AriasWave which is a modern version of technical analysis.
Elliott Wave died many moons ago but some people decided to profit from it and it wasn't traders lol
Remember to use Disciplined Money Management Principles to ensure longevity as a trader.
If you don't know the long term pattern shouldn't you be doing your research instead of just following the crowd?
Just remember: I am not a financial adviser; I suggest using this only as a guide. Always do your own research.

BTCUSD weekly (04/01/2023)Happy New Year to all traders!
I have been waiting for a while and accumulating for these purchase points in Bitcoin, here I leave you a new comparative analysis of the weekly BLX on a logarithmic scale together with the Bitcoin Logarithmic Curves and the Rainbow Price Chart.
On this occasion, the purchase points with the highest historical profitability in BTC have been analyzed with various indicators:
- 200MA hold or brief break
- PA on a macro scale with very high pressure points
-RSI touching the lower bands
(all of them as minimums of the previous cycles)
-BLGC the logarithmic curves in minima
-
BRPC maximum sales accumulation points
In my opinion, I think we are facing the best buying opportunities, perhaps with the best point at 15k or around a few days ago. I am sure that the true BTC and Blockchain maximalists are taking action in these areas.
A strong greeting and I wish you a wonderful year!
----------------------------
¡Feliz año nuevo a todos los traders!
Llevo tiempo esperando y acumulando para estos puntos de compra en Bitcoin, aquí les dejo un nuevo análisis comparativo del BLX semanal en escala logarítmica junto con las Curvas Logarítmicas de Bitcoin y el Rainbow Price Chart.
En esta ocasión,
Se han analizado los puntos de compra con mayor rentabilidad histórica en BTC con diversos indicadores:
- 200MA espera o breve descanso
- PA en escala macro con puntos de presión muy altos
-RSI tocando las bandas inferiores
(todos ellos como mínimos de los ciclos anteriores)
-BLGC las curvas logarítmicas en mínimos
-Puntos máximos de acumulación de ventas BRPC
En mi opinión, creo que estamos ante las mejores oportunidades de compra, quizás con el mejor punto en 15k o hace unos días. Estoy seguro de que los verdaderos maximalistas de BTC y Blockchain están tomando medidas en estas áreas.
Un fuerte saludo y les deseo un maravilloso año!

USDT.D and BTC correlationUSDT.D is about to start its downtrend, signaling BTC is about to start its bull market, as they are inversely correlated.
Before that happens, there is a possibility of one more leg up for USDT.D, which would mean one more leg down for BTC.

Bitcoin Reversal Hopes BLX trend line in solid white that needs to hodl for price to reverse to the upside
If this structure breaks down and it is no longer a higher low price may continue downward within the channel
Hopes
Long btcLooking at the up and down the limits of price action in the past we can create boundaries and forecast the momentum of future moves.

Strong support for bitcoinAttention! Incredibly long text!
A huge cluster of pending orders to buy Bitcoin will not allow the price to drop to the $13,000 area expected by everyone.
In addition, these conditions will allow the market maker to move the market to the $32,000-$38,000 region in order to use a trap for marginal bears and their subsequent liquidation.

Bitcoin is ready for a rallyThe ratio of itcoin to the money supply index is at its bottom. This is a good place to start a new path.

btc (alternative) macro case.good afternoon.
---
firstly,
this is an alternative to my primary case -
go check that one out if you're new here.
primary - via:
---
secondly,
the current correction we're in can be classified as the grand cycle wave 4.
wave 2 was sharp, therefore wave 4 is complex, as per the law of alternation.
a complex correction can take the shape of many different things.
this right here is a prime candidate if the flat fails in the months ahead.
---
if btc continues to flag out down here,
we will see a similar situation to what happened back in 2018 -
where compression will continue until the rug is pulled.
---
>lot of longs in the markets still, who are happily willing to push the price down heavily if a wave of liquidations was to be triggered.
>i do believe we'll hit 5k in this bear market, maybe even lower - just not sure which path we take for now, (but i've narrowed it down to the two main cases as of today).
✌

what if?what if the grand cycle wave 3 has been put in?
---
well, that would give us a downside target on btc for wave 4 at 5.8k.
sounds wild right?

BTCUSD - RSI RecoveryRecurring RSI pattern that shows a higher low double bottom pattern
This is shown in white rectangles
A strong reversal sign

Bitcoin price of $330,000 by end of 2025 scenario 2Using the BLX chart on the 2 days to show Bitcoin as a scenario 2 possibility for Bitcoin reaching this $330k value by April instead of the end of year 2025. there are certain parameters used to make this assertion. On the first bear market of 2014 from the bottom to the next higher low was about 220 days and then the bull started for the next cycle. The next was in the 2018 Bear where we had the first low at $3200 and then the next higher low at $3900 which represents about 454 days before the next bull cycle kicked in where Bitcoin hit a high of $69k in 2021. If we take this double increase difference and add it to this next cycle we will see a possible 800 days from the first low to the next higher low and we get our possible April date for the Bitcoin peak in 2025. I am using a fractal plus the Beambands as an indicator for this possible target price which coincides at top of beamband in 2025.

btc 12-16 [evening update]ahoy!
---
good evening my people's.
today was a pretty fun day lol, a bit unexpected, but deep down i saw it coming.
---
recently talked about this particular scenario via:
👇
btc ended up delaying, building as much liquidity as possible before it broke, and took everything from the unsuspected market participants.
---
here we are though, down here with some pretty serious buy signals.
my upside target is as conservative as it gets, 19k.
this dip could potentially be setting us up for a move to 34k, so i would be very careful shorting it.
check out my video from tonight for more context.
🏴☠️

12-15 btc [evening update] ~good evening,,,
---
starting to like what i'm seeing across the board,
today's dip in the stonk market pretty much solidified something very important into my mind.
i'm going to talk more about it in my evening video,
so do check that out if this is something that interests you.
---
over the next few days, i think btc's going to create a trap wave,
once the trap wave is completed, an expansion to 19k is expected.
---
you know what comes after.
✌

btc 12-14 [evening update]good evening,,,
---
really weak rejection today - almost non existent compared to the trials which spx went through lol.
>a sign of strength imo.
---
a sign of strength doesn't mean we can't take out the lows though,
so that's what i'm bringing to the table today.
we grind up into december 23~28th,
then pivot down to take out the lows.
most people will panic sell down there,
but if you know it's the real bottom, you'll be buying.
---
not financial advice or anything,
just some art to hang on your wall.

btc 12-13 [alternative]quick intraday update here ~
---
there's a very real alternative here
this scenario is not very probable, but i gotta talk about it just in case.
---
very possible we have created a triple 1-2 in the local region
which would absolutely send btc if true.
the ultimate target is between 25~29k, but i'm not 100% sure it goes there yet.
>anything is possible though, don't discount it
>and also, don't bet the bank - know when you're right, and know when you're wrong.
>stop loss is your friend.

btc 12-13 update ~what a trap wave lol.
---
this morning opened up two paths imo,
the first one is labeled in red.
it's possible to use the previous chop from november to finish a simple zig-zag here,
if this is the case, we will raid the november lows before trying to move up again.
👇
the second one is labeled in green.
implying that 5 waves up is close to being finished through a leading diagonal,
and we're about to correct down in 3 waves before seeing strong continuation to the upside.
---
regardless of what happens from here,
i do believe we're going to be consolidating over the next few weeks at the bare minimum.

es 12-12 updategood afternoon,
slight change to my overall trajectory.
still bullish, but we're going to have to build a bit more structure imo before going back to ath.
----
eyeing a move up into december 23rd on es1! to roughly 4160 {maybe a tad higher on a short squeeze}.
will give an update after.
✌

btc 12-12 update ~good afternoon homies,
---
slight change to the overall trajectory as of yesterdays push down.
the local divergence has created a bit of a hint as to what may come next.
---
i'm looking for a local uptrend into december 23rd to roughly 19~20k,
will give an update once we get there.
✌
