btc 7-21 update (bull-ish projection)in my last post i discussed my bear case,
this right here is the "bull-ish" case.
bull-ish, because the upward move will be straight chop.
alts will perform very well in this environment though, so that's a bonus 💰
---
for this particular scenario to play out,
after rejecting 25~26k within the next 7 days, bitcoin will have to see a controlled move down into august which comes down in 3 waves.
it cannot go deeper than 50% of the recent move up from 17k.
>if structure is held until the middle of next month, we can anticipate higher prices into the months ahead into the mid 30k range.
>if price gets rejected in the projected zone, we can look for a decline to about 6k - where a long term bottom will be created.
>halving in 2024 will initiate the next bullish cycle, and bitcorn will go into the hundreds of thousands.
---
both of these scenarios are possible, and we won't know which one is at play until price action confirms it.
patience is 🔑.
---
ps. i continue hanging out in cash for the time being until more confirmation is given.
BLX

btc 7-21 update (bearish projection)good evening,
thought i'd go ahead and share my two primary cases, to catch everyone up with my thoughts.
---
this right here is my primary projection for bitcoin.
it implies that a local top will be created within the next 7 days, followed by a sharp move down into august \ september.
>downside target on this particular projection is between 13~14k.
>once this downside target is in, i think bitcoin can see a significant squeeze up into the 40k region, (maybe even higher)
>followed by one more bear phase, which bottoms out between 10~6k in late 2023.
>halving in 2024 will send bitcoin into the hundreds of thousands; i'm very bullish long term. quite neutral until a bottom is in just swinging all these bear moves in the mid-term.
---
(view next post for the bullish projection)

btc 7-20 update~good evening,
---
in my video last night, i talked about this upper 25k target, and what would happen if we reached it.
---
as of today, it looks very probable that we Will reach it (through what may be a diagonal).
---
to keep it simple --> 25~26k--->13k.

the time has come.the time has come for me to pull the trigger on a short.
---
majority of the market has finally flipped bullish (as recently predicted).
when they were bearish, i got bullish,
and when they get bullish - i get bearish.
ez
--
24.3~24.6k is the window of opportunity.
not entirely sure how low we're going go just yet, but i will know after seeing what the pull back looks like.
-
~not financial advice, don't follow my footsteps.

btc 7-11 update ~good morning ☀
bitty feels pretty heavy. it is highly probable that this current move is coming down in 5 waves.
it would make the most sense as well.
flushing out all the late longs into the full moon (2 days from now).
---
i'm eyeing that lower 19k range for a local bottom, but it's subject to go lower if the cpi data comes back worse than expected.
upside target is still at 24k, and i do believe we get there by july 30th.
after which, 12k.

btc 7-19 update ~good morning o/
---
not much to update, but i figured i'd give you an update on my thoughts.
----
spx500 still has a lot of room to run,
dxy (us dollar) still has a bit more downside before the next leg up
which means btc could technically see an expansion.
----
expansion targets = 24~27k
how high it goes will rely heavy on the us markets.

btc 7-18 update ~good morning my peoples o/
first off, i'd just like to say,
if you caught that long - you da man.
secondly, i moved 100% to cash about 2 hours ago.
thirdly, my upside target was hit from last nights post:
check it out if you haven't:
(if you watched my video update yesterday, you knew about this short squeeze, and you knew exactly how high it was going to go).
-----
let's talk about the data.
as of me writing this, there was a massive long position opened near the absolute top of this move,
you know how it goes.
fomoers fomo,
then get liquidated -> creating a downward spiral.
- open interest is sky rocketing into this push up (bearish).
- got these 8H dots showing up, signaling significant bearish divergence behind the scenes;
here was the last few times this signal has appeared.
you can be the judge of this picture:
- daily hidden bearish divergence, which is quite prevalent as of now.
it can get over exaggerated, as price pushes into the extremes.
invalidation of the hidden bear sits at 32k - that is also the level of my bearish invalidation.
- we are approaching the daily ichimoku cloud, which has posed as significant resistance in the past.
- most of the shorts have been liquidated, but there are a few stragglers remaining.
- risk is to the downside for mm, but they could prolong this bull trap awhile longer to get as much liquidity as possible on the way down.
-----
overall, my bias has shifted as of this moment - i do wholeheartedly believe we will see new lows.
the move down will be far more aggressive than the last one, and it's going to come unexpectedly - like a category 5 hurricane.
july 28~30th is the only window you need to know about
that is when the market theoretically will pivot, and can take everything from everyone who does not know.
-----
ps. this move can easily get over-extended to around 25~26k - that would be the absolute extreme.
-----
shared on 7-11 (same upside target for now)

btc 7-17 (alternative path)good afternoon, this is the alternative path.
as of this morning, btc has entered into another quartervois - creating a second potential trajectory.
---
if this general area up here is held as support, it could be categorized as a flat.
if the flat maintains structure, we could see a short squeeze, as there was quite a bit of shorts opened over night.
could squeeze all the way up to 23k before pivoting down into the anticipated x-wave.
---
primary scenario:

btc 7-17 update ~good morning,
if you watched my last few videos, you'll know where my minds at.
👇
👇
👇
---
i continue to see an increase in price into the end of this month,
to be more precise, into july 30th.
we will likely see a fairly large dip into august.
depending on how it comes down will be the most important.
---
market is currently at a significant crossroad, and what comes next will be highly reliant on how we pullback into august.
---
---
---
check out my two primary projections into the next few months via:
bull-
bear-

Production cost.this red wave indicates the production(mining) cost per bitcoin.
zooming out all the way, we can see that bitcoin has never in history went beneath the big red wave.
could this time be different?

pi cycle bottom.This indicator right here, "Pi Cycle Bitcoin High/Low" has called out every historical cycle top and bottom in bitcoins history.
Last night, it flashed "Pi Cycle Bottom".
Could this mean a bottom is in?
😏

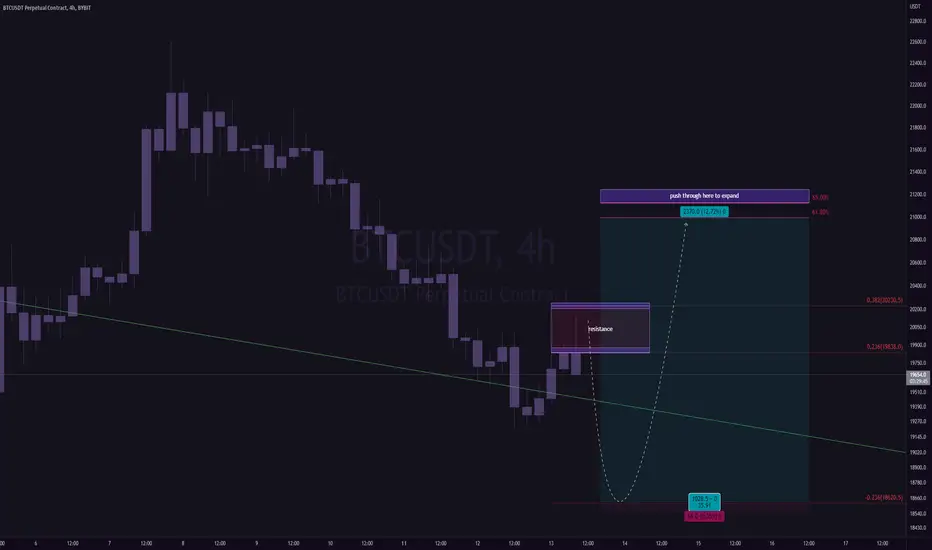
btc 7-16 update pt.2good afternoon o/
previous idea was invalidated; going to try this one more time.
---
as of this moment, the local structure does look like a clean 5 waves up.
i'm going to be looking for 3 waves down after this fifth wave is completed.
likely going to back-test 20k before it attempts to expand higher into the weeks ahead.
---
ps. it's possible the fifth wave sees an extension, in which case it can go higher before we get my pull back.
shorts are risky, pullbacks are for buying.
---
have a great weekend 💸

btc 7-16 update ~good morning,
little overnight bounce; came a few pips earlier than what i had expected.
this bounce has risen the downside target where btc will likely find a bottom.
20k range is now the 🔑 going into tomorrow, if it holds - upward expansion is to be expected.
can wick deeper into my green box to grab liquidity.
---
upside target raised slightly higher as well.
---
ps. it's still unknown weather the current move is corrective, or it's the beginning of a much larger move to the upside. will have a better idea before this month is over

btc 7-15 update ~good evening o/
---
btc has rejected the area which i had my eyes on yesterday.
it's looking pretty good for continuation to the upside after this local retracement.
watching the local point of control in this general area just beneath 20k for a bottom to be made.
(could take a few days to get there).
---
overall, looking for an expansion to 22~24k in the week ahead.

btc 7-14 update ~good afternoon o/
----
i get this vibe, that btc wants to raid the lows.
it might not, but if it did it would be a prime long setup for what is to come.
-----
last night i shared two scenarios, i currently favor the bull.
love it or hate it, but this is my current opinion about the market.
-----
if we do get this deep raid, it would be the perfect bear trap. we'd also likely see a significant short squeeze out of this range. (20%+ in a single day if all goes as planned)
✌

"the bull-ish case".i'll be 100% honest with you,
both of these cases are bullish.
once this correction is completed, btc will go into the hundreds of thousands, if not millions into the years ahead.
the real challenge, is figuring out the path it takes to complete the current primary corrective wave.
---
this case implies that bitcoin has completed a simple zig-zag (labeled as wave w)
which would mean that we're in a phase of accumulation right now, getting ready for a move up into the x wave.
---
the next 2 weeks in the market will give us a very conclusive picture as to what comes next.
by the end of this month i'll be able to eliminate one of these scenarios, and play the one which is remaining.
patience is 🔑.
---
the upside target for this x wave sits anywhere between 34~42k, but it would most likely take awhile to get there - in a very corrective \ choppy manner.
the final push down would go to about 6k into late 2023 (which would be my primary target for this particular scenario).

"the bear-ish case".good morning my peoples.
i've analyzed this count in twenty different ways, and i've narrowed it down to two.
i wanted to share the two trajectories which currently hold the highest probability in my honest professional opinion.
(view next post for case #2).
----
the first case is called "the miner + hashrate capitulation event".
in the recent years, each major low has been greeted with miner + hash-rate capitulation, as displayed down below:
we are currently entering an area in the market which is putting significant pressure on the bitcoin miners.
if the price goes any lower than 17.6k, a lot of miners will be forced to shut down their operations, and potentially begin to liquidate some of their assets to continue being able to pay for their operations.
if i'm not mistaken, it roughly costs 17.6k to mine one btc, so if btc goes below this number - miners would technically be losing money per btc mined (in electricity costs, etc).
most of the cycle lows have challenged the miners, and just about every time, we have seen them capitulate which caused an accelerated move to the downside.
----
is this time different?
nope. if anything, this time there's more miners than ever before in history,
so if btc so chooses to go down this path (which i think is inevitable, it's more a matter of when, rather than if) - then i think we're going to see one hell of a capitulation event.
----
the target for this particular scenario = 10k.
though, corrections come in three waves - so this would only be the first wave.
i've shared my primary macro outlook in a recent video, this is the count for it:

btc 7-13 update ~morning o/
--
might see one more leg down into that middle 18,000 area
the price action from down there will be key.
-if we come up in 5 waves, this will open a door to higher prices
-if we come up in 3 waves, the bounce will be short lived and further sell pressure will be initiated.
swinging the bounce(if i get filled), may hold longer if it feels right.
majority is always what?majority is always wrong m8,
remember that.
---
good morning my peoples,
i talked to you about the bull, the bear, and the ugly.
today i wanna talk to you about how i'm playing this current move, and my reasoning behind it.
---
i'm bullish into the next 2 weeks; specifically until july 30th.
i don't care about cpi data, nor the us dolla, or what the media says - don't come here talking about any of that lol.
my strategy, is to inverse the majority - and if you're coming here talking about anything related to what i have mentioned above - then you are the one i am inversing 😈
---
bitcorn upside target = 25k.

"that wasn't love, that was just hope".as you all know, the cpi report is coming out in 2 days.
if that data fails to beat the current market expectations, i do wholeheartedly believe the markets will see an accelerated move to the downside.
it will be lead by long liquidations, miner capitulation, and extreme panic.
IF this happens, my target sits in a window between 12\13k.
it doesn't have to happen right now, so this is not me saying that it will,
but if it did, be ready for it.
👇
ps. 24k is still on the table if the cpi data beats expectations :].
cash is 👑

Bitcoin is right where is supposed to be!Looking at the history of bitcoin, the data shows this is nothing new and it's most likely the bottom. Buying has historical made you you look and feel like champion.
There is nothing guaranteed and there is Alloway's risk, without risk there is no reward.
Always invest responsible.

btc 7-10 update pt.2good evening,
been thinking a bit more about this local count, and i've come up with one more potential trajectory.
---
if we see a weak three wave bounce from my original downside target (view my last post for more context)
👇
then we'll likely see a slightly deeper retracement to 19.3k.
---
both scenarios lead to the same upside target of roughly 24k.
just need to focus on how it moves up after bouncing in the days ahead.
---
will throw an update when either of these outcomes are confirmed.

btc 7-10 update ~good afternoon my peoples,
in my last few posts, i talked about the possibility of seeing 23~24k before seeing a big pivot downwards.
here's how i think we can potentially get there.
---
as of this moment, shorts are out-weighing the longs.
1h hidden bullish divergence is present
1\3h stochastics have entered into oversold.
btc has come down in what looks to be 3 waves:
demand wicks are present, and there is an 11k long block acting as support.
---
cpi data in 3 days is a total wild card.
if that data beats expectations, we will see a significant short squeeze in the days ahead.
the full moon will too support a significant rally - potentially higher than my current expectations.
if that data fails to beat expectations, then i don't think we will see the local highs taken out, and btc along with the rest of the market will move straight down to the targets i have been discussing recently.
---
ps. i am still looking for lower prices after this push up
👇
