"The Bear Case"Real quick,
If the top is indeed in(which i'm not saying it is), I would expect a decline to around 10k on Bitcoin (could go as low as 3k).
The path that it takes to get down there is still unclear, but it will become very clear as more data presents itself.
---
I'll be 100% honest with you all, i can care less about which direction the market goes. I make money in either direction, and have 0 attachment to either side.
There is an infinite amount of possibilities in the market, and this is just one of thousands.
Don't use this post to make any kind of financial decision, for I am not a financial advisor, and this is not financial advice.
Do your own research, make your own decisions, and approach the market with your own unique strategy.
Just because i am bearish right now, does not mean that you too should be bearish.
This is merely a theory, based on a hundred different factors that are currently at play in the world.
🥂
BLX

a bearish glancetaking a look at this whole picture from a bearish perspective, just to entertain the idea.
looks fairly clean to me, the whole vibe of this downward move.
it wants to continue in my opinion.
the 4h hidden bear, the triple lower highs, quadruple delta divergence, stacked order book on the sell side; the weak alts.
all of it.
this might be just a little pitstop for a re-distribution phase before further mark down.
---
i'm not saying this is what's going to happen, just entertaining the possibility.
✌

BTC BLX WEEKLY 052022Previous wave 4 bottom of 2013 is around fib 0.5 of wave 2 in relation to time. If we compare to current wave count, then there’s a possibility of bottoming somewhere end of May or between May to August?

btc 5-19 update ~good afternoon peoples,
btc isn't looking so hot (yet again).
was hoping for enough momentum to come into the market for the move up which i talked about yesterday, but the momentum never came.
currently seeing about 7 bearish signals on numerous timeframes, which indicate short term downside in the days ahead.
---
still looking for that move up, but it'll come a bit later than expected.

btc 5-18 update ~btc isn't looking the greatest on this fine morning,
but i think a fairly nice bounce is right on the horizon.
---
looking for a pivot from the local golden zone to around 33~34k in the weeks ahead.
little 3-3-3 (wxy), to play out the 4th leg in our ending diagonal.

Alternative Short TermThis is an alternative theory from my previous theories today. What's going to happen? No one knows.

A fractal I noticedI noticed this fractal is similar to the initial break down. Maybe it'll play out. I don't know. It's what I think would play out if we correct 80% from all time high.

Possible Long Term Structure. 1M 50ma = orange line
1M 25ma = blue line
1M 100ma = red line
Possible long term structure. The faster BTC tops the smaller the price. We will see what happens. Just a guess based on the structure of MA's, and the average correction around 80%. It doesn't seem like the monthly 50ma will hold forever.

Getting tuberculosis for a target of $ 10,000I think bitcoin can reach the bottom of the channel, which is 10 thousand dollars

"the bull case for btc"i'd just like to start this off by saying,
there is a guy who bought eth at $100 back in the day,
the other day he sold off his entire position, and stated "i have had enough with this ****** bear market". (lol)
this is the kinda signs i look for before we have an imminent reversal to the upside.
-----
all of the anal-cysts who were calling for btc 100k back in the day, are now calling for btc at 20k.
the bulls have turned into growling bears,
and the bears are swimming in tendies.
everyone and their uncle wants bitcoin at 20k,
the rich dad poor dad guy is saying hes gonna go all in at 17k,
michael saylor is sweating, contemplating his decision making skills.
the og bull are capitulating,
and there is terror on the streets.
-------
this is when i come out and say,
when the majority of the market want something to happen,
the market tends to throw a big middle finger at them, and does the exact opposite.
i'm entertaining the idea that the bottom is in, and no further downside will take place.
(possible raid of the local lows to take out the long stops, but no 20k will be seen in 2022).
the immediate upside target sits at 130k for the fifth wave, and it will come quicker than you'll have the chance to even blink.
one day you'll awaken and see bitcoin up 10k, and the next day will be another 10k.
before you know it, it's christmas eve - everyone (including santa) is talking about bitcoin going to 500k, and that's when the real top will be in.
🥂
ps. your boy called the top,
and he's about to call the bottom.
leaving a few posts down below, feel free to feast on them.
big cheers to you if you've made it this far 😎
ps. i am very long.

btc 5-16 update ~good evening peoples,
i don't really have much to say.
the plan remains the same; downside target sits between 22~23k.
was able to find 7 points of confluence which align in that zone - they will act like a magnet until that target is met.
the reaction from that zone will be the key to predicting what comes next.
cash is king during these times 👑

dead bull bounce.a "dead-cat" bounce is a temporary recovery in share price after a substantial fall, caused by speculators averaging down on their losing positions.
but a wise man once said, "the market can stay irrational longer than they can stay solvent".
----
there's a lot of leveraged longs in this market right now - for every 1 short there are 15 longs.
eventually, high leveraged longs (who weren't willing to take a loss along the way) will run out of money \ won't be able to average down on their losing positions anymore - this will cause an exaggerated wave of liquidations in the crypto space.
i foresee this capitulatory event approaching in the near horizon.
----
primary wave 4 target = $22,000

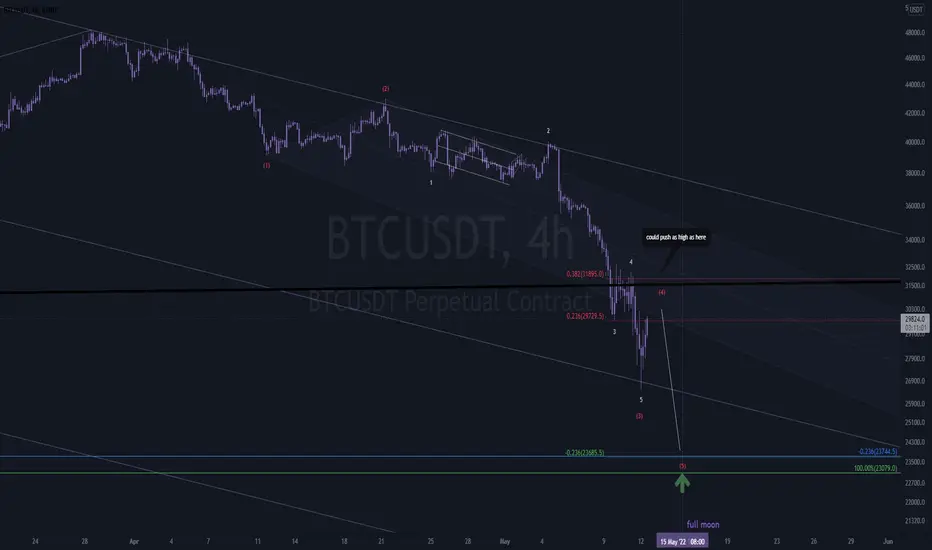
"the bottom"good afternoon ladies and gentlemen,
btc is about to mark a significant bottom.
this bottom will be talked about in the books for many years to come.
a lot of people have pretty much panic sold, and quit;
but we the wolves awaited the full moon which comes into the sky on the 15th.
once the moon appears, you will hear the howls across the lands.
and we the wolves,
shall prosper.
---
long 22~23k
💰

BTC rising wedge to $65k+ then down to $9k-$16k?This is a longer term projection based on the price action that's taken place combined with what I'm seeing from ichimoku + some of the indicators I use.
In this interpretation of the chart, we're currently in this rising wedge pattern trying to find a bottom. I think there's likely to be one more retest of the bottom of the structure before a larger move higher begins. I think if that bottom support holds, that it's likely that we start a run between now and June and could retest the top of the rising wedge and/or push slightly above it in that timeframe. If that happened, it would take price to $65k+, where I think we'd ultimately reject, and which would setup a fall lower.
After that, towards the back half of 2022, I think it's likely we see a very quick bear market which retraces sharply down to that $9k-16k price target in the gray box.
Let' see how it plays out from here. Note: this is a longer term projection and a lot would have to play out between now and then for this to come true. If the bottom of the structure holds over the next couple of weeks and we start a move higher, that's the first indication this idea is playing out. Then we need to see price reject at the top of the structure before June 20th or so.
I'll update this idea as price action continues to play out.

"The flippening"The end for one,
is just a new beginning for another.
----
I'm looking for a pivot up on May 15th.
Highest probability target I can come up with sits between 23,984.4 ~ 22,983.80.
There is a big level underneath it at 19,982.70 which can be wicked.
----
bullish going into the summer.

bitcorn 😎good evening,
looks like the attempt at the short squeeze has failed, and it was almost expected.
---
>btc broke down below a key algorithmic weekly channel.
>playing out a sequence of bearish impulses to the downside.
few key levels to keep an eye on:
24~25k (monthly 55ema)
24k = -0.236 of wave 5 of the impulse going down.
23k = 100% extension of the larger move down from 68k
21k = michael saylor gets a margin call
19k = 123.60% extension of the larger move
14.6k = 1.618% extension, aka expansion target.
where it stops is beyond me, but i can theorize \ try at ever level with a very tight stop.
ps. there is a full moon on 5\15, a historical indication of a local bottom \ bullish reversal.
ps.2. despite the 60% decline since november, people still seem to be bullish (myself included lol), which makes me think there's more pain to come. when despair sets in, the bottom will be near.
✌

BTC : Price Range This is just BTC channel analysis to see where we exactly are...
The current channel since 2019 on Weekly timeframe
.
and if we still on this track
the cheapest price we can get is channel support (If it falls)
and the target can be the upper channel trend line
.
my past analysis worst case was like 18000 but that case we must fall off from this current channel
.
Trade safe and fun

btc 5-11 update ~good morning o/
(or late night)
if the cpi data comes back positive today,
i think there's a very high likelihood of us seeing a massive short squeeze.
55k would be the upside target, on a full on expanded flat.
shared this scenario a few days ago view, check out the original thread 👇
ps. it can absolutely go the other way as well, so don't throw in more than you are willing to risk.
~not financial advice, just a drawing 😎

Bitcoin (Macro) Elliott Wave Theory Analysis.Good afternoon peoples;
Thought I'd share my macro outlook on Bitcoin with you all.
This particular count has been one of the biggest challenges I've ever faced in these markets, but after a few years of experience - I feel I've finally tackled it.
-----
To keep things real simple, the chart says it all.
I think we're going to see 22k by around July,
after which btc will run to 126k.
126k will mark a significant cycle top, and a very large correction will take place after (which could last a few years).
I'm not going to talk too much about that right now since that's way in the future, but I will absolutely bring it up when the time comes.
-----
The market is by no means linear, so my view is subject to change as more data presents itself in the months ahead.
If any significant changes take place, you know I'll be the first to give you an update about it.
I've no bias in this market, I don't read\watch the news; all of my projections are strictly based on the methods that were taught to me by a very talented technical trader.
I have no idea what will cause these large moves either, nor does it matter to me right now.
The chart paints a very beautiful picture, and it is based off this picture which I base all of my trades on,
nothing else.
-----
Grand Cycle Wave 3 = $126k
Grand Cycle Wave 4 = $10k
Grand Cycle Wave 5 = $1.6M
💰

btc 5-10 update ~good morning o/
nice little relief rally for da bulls
but i'm afraid that's all this really is,
a wave 4 bounce.
could go as high as 34k before seeing another leg down to around 27.2k (where i will become a buyer).
----
what i have projected on my chart,
is the highest probability path i could see for bitcoin from here,
to complete the larger corrective phase.
PS. if it could push above 34k, then there could potentially be something else going on (view my post from yesterday for more context)

Bitcoin / Gold (BLX/XAU) Chart - 50/200 MA Death Cross nearingOn the Bitcoin / Gold chart a warning signal flashed on April 16th!
We are nearing a 50/200 MA DEATH CROSS which will occur on May 4th on the 3-day chart!
50/200 MA death cross are quite rare, especially on the 3-day chart.
The Bitcoin price drops on average approximately 50% (measured from the day the warning signal of the death cross indicator flashes - to the bottom)!
Disclaimer!
We (Asset-Ethology) are not a financial adviser. For educational purpose only!
You can use the information from the post to make your own trading decisions.
Trading is risky, and it is not suitable for everyone. Only you can be responsible for your trading.

Bitcoin BTC/USD BLX Short-Term AnalysisShort-term analysis of #Bitcoin on the H6 timeframe:
For several months #BTC was trading inside a bear flag which has finally broken to the downside.
However, Bitcoin remains strong and the bearish breakout was not as harsh as expected.
BTC is currently trading inside a bullish wedge which has in general a probability for a breakout to the upside of approximately 67%.
There are several reason why I think that in this case the probability for a bullish outbreak is high in this case:
- Stochastic RSI is turning bullish and is moving above the 20 level
(note: the StochRSI also looks quite bullish on the 2D TF!)
- Bullish crossover on the Wave Trend oscillator
- on the H4/H6 timeframes we can see a strong bullish divergence on the MACD
- the #Crypto Fear & Greed index is at very low levels and holds its support 20
In addition to this we can see that the bullish momentum on the DXY seems to be exhausted on the H6 timeframe which means that there will be a short-term correction in the DXY.
A correction of the DXY is a further bullish signal for crypto as well as for stock markets.
Take profit targets:
TP1@ $40600
TP2@ $42690
(note: strong resistance between $43k - $45k)
Disclaimer!
We (Asset-Ethology) are not a financial adviser. For educational purpose only!
You can use the information from the post to make your own trading decisions.
Trading is risky, and it is not suitable for everyone. Only you can be responsible for your trading.
