ALTS | TOP Altcoins for 2025Altcoins are forever growing and expanding, but it's important to look at coins that have a future BEYOND the first month of trading.
Note that these will not be NEW alts, no microcaps, but rather alts that are worth considering in a portfolio.
Let's first run through the several distinct types of altcoins, each with unique characteristics and purposes. With that, I will list some of the top altcoins to consider for 2025 in that category:
Security Tokens
These represent ownership in a traditional asset, such as shares in a company. They are subject to securities regulations and offer fractional ownership.
Currently, the ones I'm watching are tZERO and SPiCEVC. The whole idea behind tZERO is to make trading digital securities just as easy and seamless as trading stocks on conventional markets. This makes it a game-changer for both investors and companies looking to tokenize their assets. SPiCE VC is a venture capital fund that’s making waves in the blockchain world by offering tokenized access to its portfolio. If you're not familiar with it, SPiCE VC is one of the pioneers in the security token space, and it gives investors the chance to gain exposure to a range of tokenized assets.
The SPiCE token itself represents a share in the fund’s future profits, making it a really interesting option for those who want to diversify their investments without going through the traditional venture capital route.
Payment Tokens
Designed to function as a digital currency, these aim to facilitate peer-to-peer transactions and act as a medium of exchange. Bitcoin is the original example, and many altcoins attempt to improve upon its features such as transaction speed or scalability.
1) XRP | BITSTAMP:XRPUSD
I'm no fan of XRP, but the potential collaboration with Bank of America could prove to be good for the price.
2) BNB | BINANCE:BNBUSDT
Initially created to pay for fees on the Binance exchange, now used in various applications and transactions.
Stablecoins
These aim to minimize price volatility by pegging their value to a stable asset, most commonly a fiat currency like the US dollar. This peg can be maintained through various mechanisms, such as holding reserves of the pegged asset (fiat-backed)/ using algorithms to manage supply (algorithmic stablecoins)
1) USD Coin (USDC) | CRYPTOCAP:USDC
Issued by Circle, USDC is known for its strong regulatory compliance and transparency. Circle is a regulated financial institution that holds reserves of US dollars and other highly liquid assets in segregated accounts at regulated financial institutions.
2) Tether (USDT) | CRYPTOCAP:USDT
Issued by Tether Limited, USDT is the largest stablecoin by market capitalization.
Utility Tokens
These provide access to a specific product or service within a blockchain-based ecosystem. They are not designed as investments but rather as a means of accessing functionality within a network or platform.
1) ETH | COINBASE:ETHUSD
Ethereum keeps growing, and its still the king of ALTs.
2) SOL | MEXC:SOLAUSDT
Sol could be regarded as a major competitor to ETH, and at the current moment still has a bright future.
3) TON | OKX:TONUSDT
Developed to offer payment services using technology created by Telegram, Toncoin could see growth in 2025.
4) ARB | BINANCE:ARBUSDT
Arbitrum is a Layer-2 scaling solution for the Ethereum blockchain, designed to improve transaction speed and reduce costs and could grow in 2025 and beyond.
5) AVAX | BINANCE:AVAXUSDT
Focusing on high performance and scalability, Avalanche supports the creation of custom blockchain networks and decentralized application.
Meme Coins
These cryptocurrencies often originate as jokes or based on internet memes and trends. They typically lack underlying utility or technological innovation and their value is driven primarily by community hype and social media sentiment.
1) DOGE | BINANCE:DOGEUSDT
Dogecoin is a classic, and still shows much room for growth both in upside potential (price) as well as adoption.
2) PEPE | BINANCE:PEPEUSDT
Pepe has grown to an impressive market cap, and seems to be one of the meme's that are here to stay. (At least for a while).
3) WIF | CRYPTO:WIFUSD
Dogwifhat is a little scary, fairly recently released and still has to retest opening levels. However, there is a large hype surrounding it and the general market seems to be optimistic about its future.
_______________________
Note that these are just SOME of the great options. I'll do a dedicated post on promising microcaps soon.
BNB

BNB is about to get doubleBNB is staying above the all time high support on weekly time frame, and its on the way to $1400 in the next few months IMO.

BNB Near ATH: New Highs on the Horizon?CRYPTOCAP:BNB is currently trading above a key support zone and the rising trendline.
It is just below its all-time high (ATH) levels, and we are anticipating the possibility of a new ATH from the current levels. Keep a close watch for further bullish momentum.
DYOR, NFA

BNB/USDT weekly analysis.The chart shows two rounded bottoms, which resemble an inverted head and shoulders pattern.
This pattern is typically a bullish reversal indicator, suggesting upward price movement.
The horizontal line marks a long-standing resistance level.
A breakout above this resistance would indicate strong bullish momentum, as seen in the recent price rise.
The projected move (indicated by the upward arrow) suggests a target price near $1,100.
This aligns with the measured move of approximately 75.54% calculated from the pattern’s neckline to its lowest point.
BNB is trading at $710.74 with a positive momentum of +2.51% for the current period.
This setup indicates strong bullish sentiment in the market. However, traders should consider a possible retest of the breakout zone (around $600) and manage risk with a stop-loss below the neckline to avoid an unexpected reversal.
Let me know if you’d like further assistance or adjustments!
DYOR. NFA

BNBUSD: 1 year Rising Wedge is about to break upwards to $1,500.BNBUSD is neutral on its 1D technical outlook (RSI = 52.057, MACD = -0.160, ADX = 20.933) which along with the bullish 1W chart (RSI = 59.785) it outlines the long term bullish potential. With the Support of the 1W MA50, a bullish breakout is expected as the Rising Wedge pattern of 2024 is about to come to an end. The similarities with the 2018-2021 Cycle are evident, where a Rising Wedge was again present for the whole year of 2020. When it brokeout in 2021, an insane rally took place. If it is of the same strength as 2024, then we will stay bullish until it completes a +255% rise (TP = 1,500).
## If you like our free content follow our profile to get more daily ideas. ##
## Comments and likes are greatly appreciated. ##

BNB | ALTCOINS | BNB Still BULLISH - Here's WHYIt can be concerning to see the price lose 5%-10% in the daily timeframe. However, this is not uncommon during a bullish cycle.
In this quick update, I explain why the price is still very evidently in a bullish cycel, despite corrections in the daily.
BTC and ETH update, find it here:
_______________
BINANCE:BNBUSDT

Breaking: COCO Poised for 50% Surge Amidst Falling Wedge PatternCOCO Coin ( NASDAQ:COCO ), a community-driven token built on the BNB network, has been making waves since its launch in 2024. The project, symbolized by the iconic Viral Frog, emphasizes organic, community-led growth and boasts robust fundamentals. Following a sharp retracement of nearly 50% from its all-time high on January 2, 2025, COCO now presents an intriguing opportunity for investors as it forms a bullish falling wedge pattern.
Technical Analysis
As of the time of writing, NASDAQ:COCO has gained 4%, trading within a bullish engulfing pattern. The daily price chart reveals a falling wedge pattern, a classic bullish reversal signal. Notably, yesterday’s candlestick broke through the upper boundary of the wedge, signaling a potential upward trend.
The Relative Strength Index (RSI) is currently at 56.68, indicating a neutral zone that provides ample room for further price growth. With the RSI neither overbought nor oversold, NASDAQ:COCO ’s price action aligns with the potential for a 50% surge. Furthermore, the trading volume in the last 24 hours stands at $1,661,011, reflecting strong market activity despite a recent 32.30% decline.
Token Overview
COCO Coin’s foundation is built on transparency and security. The project raised $24.37 million through contributions between June 29 and August 2, 2024. Demonstrating its commitment to fairness, the team refunded all contributions by August 7, 2024, and airdropped new tokens at a 1:10 ratio. Liquidity was added on August 5, 2024, and permanently locked by August 12, 2024. Additionally, COCO’s smart contracts have been audited by Certik, ensuring investor confidence.
The project’s user base has grown rapidly, with over 170,000 token holders since its launch. Daily trading volumes range between $1 million and $3 million, showcasing strong liquidity and market interest. COCO’s decentralized application (DApp) further enhances its ecosystem, offering a secure and user-friendly platform for its community.
Market Performance and Metrics
- All-Time High: $0.002686 (January 2, 2025)
- Current Price: 34.28% below the ATH
- All-Time Low: $0.0006904 (September 28, 2024)
- Market Cap: $60,148,126
- Fully Diluted Valuation: $60,148,126
Despite its retracement, COCO’s price has increased by 11.30% over the past week, outperforming both the global cryptocurrency market (+1.10%) and its BNB Chain peers.
Future Prospects
COCO’s roadmap outlines ambitious plans, including marketing campaigns and strategic partnerships in Q3 2024, new feature launches in Q4 2024, and ecosystem expansion in Q1 2025. These initiatives aim to solidify COCO’s position within the BNB Chain ecosystem and attract further user participation.
The project’s market-making team ensures liquidity and price stability, minimizing volatility and fostering a conducive environment for active trading. With a strong community-driven model and a focus on user engagement, NASDAQ:COCO is well-positioned for sustained growth.
Conclusion
COCO Coin presents a compelling opportunity for investors, driven by its robust fundamentals and promising technical setup. The breakout from the falling wedge pattern, coupled with a favorable RSI and strong community backing, suggests that NASDAQ:COCO could achieve a 50% surge in the near term. As the project continues to execute its roadmap and expand its ecosystem, it remains a noteworthy contender in the BNB Chain landscape
BnB is on the wayBnb usdt Daily analysis
Time frame 4hours
Target 900$
Close Target is upperside of the band
We hear a lot of news about major crypto companies collaborating, as well as corporate acquisitions and filling the coffers with valuable cryptocurrencies.
But there is no volume in the market.
We are not seeing the growth that we expect to hear after all this good news.😒
What is the reason?
The answer is one word.
👉Strategic patience. 👈
Wait, this is the beginning. The rockets are refueling for a long, long launch.🚀🚀🚀

Analyzing Symmetrical Triangle Breakouts: A Bearish Setup for USUS30, representing the Dow Jones Industrial Average index, is currently trading at 42,500 with a target price of 41,500, indicating a bearish outlook. The price action is forming a symmetrical triangle pattern, a technical setup that reflects market indecision as it consolidates within converging trendlines. This pattern typically precedes a breakout, which could occur in either direction, though in this case, traders are anticipating a bearish breakout. A decisive move below the triangle's lower trendline would confirm the breakout, signaling a continuation of the downward trend. Once the breakout is validated, the price is expected to head toward the target of 41,500, offering a potential opportunity for short positions. Confirmation of the breakout is essential to avoid false signals, and traders should watch for strong momentum and volume supporting the move. This setup highlights the importance of monitoring key technical levels to capitalize on market movements.

BNB TO DUMP TO $460BNB ready to dump 🤔
I'm not a huge fan of pattern trading as it is very subjective, however when something is as obvious as this then it can't be ignored. BNB currently is in a very clear rising wedge pattern which only increases it's odds of playing out the way we expect it to. This is due to mass buyer confidence.
If we get more rejection from the ATH area of $750 and bearish bias continues on BTC then i do believe we'll see an aggressive break out here on BNB to the downside.
When compared to the likes of Solana which have similar functions and capabilities BNB is overpriced so this could also be a fundamental reason it could dump, to reset the value of BNB which would also in tern be good for BNB as it could increase it's user base as more people would be inclined to use it's chain for meme coins for example if they chain becomes all round cheaper.
Let's see how BNB continues to play out as it follow up the rising wedge pattern and squeezes into the final section. The squeeze will also allow a build of of liquidity and volume which will increase the volatility when price does break from this pattern.
If by some miracle we have a BTC pump, a large pump that is. Then we could see BNB break to the upside, but even if that does happen i believe it would only be temporary.

Is Rich Quack ($QUACK) Dead? A Deep DiveRich Quack ($QUACK), a Binance Smart Chain (BSC) memecoin, has been the subject of intense speculation and debate. After its meteoric rise of 1182% in November 2021, the token has seen a steep decline, losing about 92% of its value over the past two years. This downturn has led many traders and investors to question its viability. However, history often repeats itself in the volatile crypto market, and $QUACK could be gearing up for a major resurgence.
About Rich Quack
Rich Quack is a community-driven memecoin launched in 2021, boasting over 149,000 holders globally. Its ethos is rooted in making crypto fun, accessible, and rewarding. While its name satirizes the "get-rich-quick" mentality, the project emphasizes hard work, innovation, and community-driven efforts as the true paths to wealth creation.
What began as a humorous token has evolved into a dynamic ecosystem aimed at empowering individuals through collective action. Rich Quack’s mission is to flip the script on traditional wealth creation by combining financial education, humor, and an engaged community.
Key Metrics**
- Market Cap: $34.9 million (Ranked #1029 on CoinGecko)
- Fully Diluted Valuation (FDV): $78.7 million
- Circulating Supply: 44 Quadrillion tokens
- All-Time High: $0.0000000071546 (November 7, 2021)
- All-Time Low: $0.0000000000101202 (October 6, 2021)
- Daily Trading Volume: $649,272 (a 30.20% decrease over the last 24 hours)
Rich Quack’s trading volume and market activity suggest waning interest. However, its large holder base and low current valuation make it a prime candidate for speculative rallies.
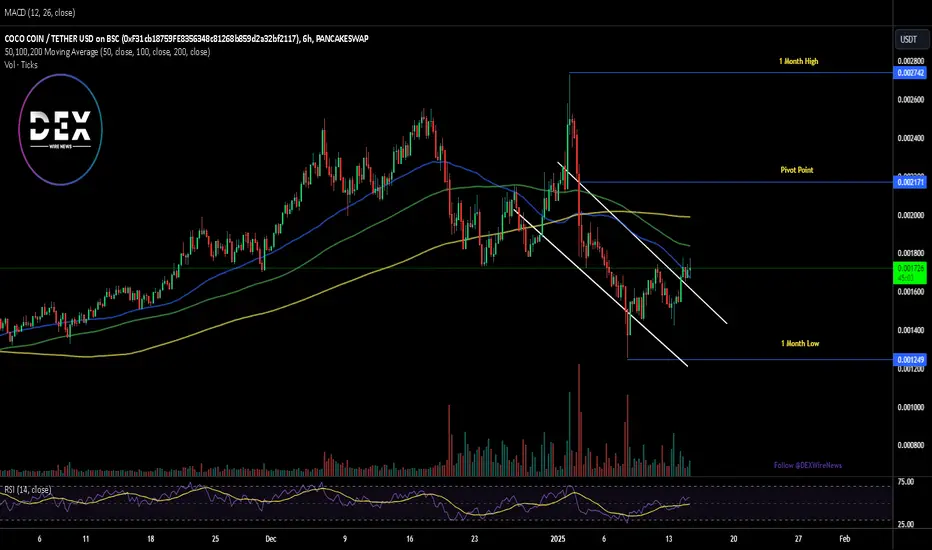
Technical Analysis
At the time of writing, $QUACK is trading within a weaker consolidation trend, down 0.5% on the day. The price is approaching a critical support zone near its one-month low. This level could serve as a significant buy zone, attracting traders and investors looking for potential breakout opportunities.
Key Technical Indicators
1. Support Level: Just beneath the one-month low, acting as a safety net for buyers.
2. Resistance Level: Near-term resistance lies within the upper consolidation range, which could act as a hurdle during upward momentum.
3. Trend Pattern: Currently, $QUACK is in a weaker consolidation trend, but a breakout could trigger a rally.
The absence of extreme selling pressure indicates that the token might stabilize soon. For traders, this presents a low-risk entry point with potential high rewards if the market turns bullish.
Potential Catalysts
1. Major Exchange Listings: Securing a listing on Binance or Coinbase could exponentially increase $QUACK’s trading volume and market cap.
2. Community Engagement: With over 149,000 holders, Rich Quack’s active community can drive organic growth and market activity.
3. Market Sentiment: A shift in the broader market’s sentiment toward BSC memecoins could reignite interest in $QUACK.
Conclusion
Rich Quack’s journey from a satirical memecoin to a community-driven ecosystem showcases its resilience and adaptability. Despite its significant decline from the 2021 highs, $QUACK remains a contender for future rallies. Its strong community, innovative approach, and untapped potential in major exchange listings position it as a token to watch.
While the current market conditions suggest caution, the adage “every fall must surely rise” holds weight in the crypto world. For traders and investors willing to take a calculated risk, $QUACK offers an intriguing opportunity for potential gains.

Analyzing AUDJPY Breakout: A Bullish Opportunity The forex pair AUDJPY is currently trading at 99.000, with a target price set at 100.000. This suggests an anticipated price movement of 100 pips, signaling a potential gain if the trade goes as planned. The price action indicates an ascending triangle pattern, a bullish continuation pattern often associated with upward price momentum. A breakout above the triangle's resistance level has already occurred, confirming the bullish bias. This breakout implies that buyers are in control, increasing the likelihood of reaching the target. The ascending triangle reflects higher lows, showing consistent buying pressure. Traders often view this as a strong technical indicator for upward movement. Risk management is crucial, as market conditions can shift unexpectedly. Monitoring the pair's price action and related economic events is essential. The breakout provides a clear trading opportunity aligned with technical analysis.

LOE Something's cooking here...Alright guys, after I gave you VEXT the last time and a 12x within a blink of an eye, this time here another gem which is worth to be observed more. But this one is kinda tricky...
We can find a hint where this coin could go in the future or probably very fast in this bullrun:
On March 29th-30th 2024 the currency of the Play-And-Earn fantasy game "Legends of Elysium" (LOE) made an All-time high of $9.15 after the first private sale round to VCs and early investors before the token launched on various central exchanges (CEX) and decentral exchange (DEX) swaps. The data before April just popped up recently on Coinmarketcap, although it could've been just a candle wick for a brief moment of time. It wasn't visible before November / December 2024 when I checked. In Coingecko and in charts here on TradingView like e.g. of Gate.io, MEXC or Bitget it's also not visible.
So it's probably nothing... Or is it? Well, the marketcap right now sits at around $220k and the FDV is $3.2M which is kinda promising. Reaching a $1 B marketcap could be in the cards (pun intended). The developer team is constantly updating the game and announces always news like the new Battlefield Mode which was implemented recently.
Chartwise the RSI is making constant higher lows since almost a year which could indicate a massive bullish divergence on the daily and weekly. Furthermore LOE is forming a double bottom since October which also could be an indicator for incoming of new buyers and the stability of the coin.
So who wants to bet this thing will pop off?

$BNB/USDT is trading within an ascending triangle pattern, showi$BNB/USDT is trading within an ascending triangle pattern, showing strong bullish potential as it approaches the resistance zone near 720 - 750 USDT.
The price is holding well above the key support/demand zone around 590 - 620 USDT, which has consistently provided a solid base for the uptrend.
The Stochastic RSI is rebounding from oversold levels, indicating a potential shift in momentum toward the upside.
DYOR, NFA

BNB's situationBINANCE:BNBUSDT
It reached its own resistance zone again, which is also very prestigious.
The probability of breaking this resistance area is very high.
Above this resistance area we will enter long bnb✅
⚠️ Disclaimer:
This is not financial advice. Always manage your risks and trade responsibly.
👉 Follow me for daily updates,
💬 Comment and like to share your thoughts,
📌 And check the link in my bio for even more resources!
Let’s navigate the markets together—join the journey today! 💹✨

FLOW Long - Altcoin PumperyGift me a sub if this idea works out ;) Yummy looking short ratio as well as this untouched level makes me feel pretty confident on this fella.

Bullish divergence on BNB- Bullish divergence between the trend and the RSI.
- Very good long opportunity right now.
- Good ratio.
----------------------------------------------------------------------------------------------
Goal : 2 000 000$ from 2 000$
Wallet last update : 4100$
Wallet today : 4800$
----------------------------------------------------------------------------------------------

BNB-USDT 4h chart reviewHello everyone, let's look at the 4H BNB to USDT chart, in this situation we can see how the price has moved sideways from the uptrend line, and what's more, we can see how the price is staying on the local downtrend line.
Let's start, however, by defining the goals for the near future that the price must face:
T1 = $714
T2 = $730
T3 = $743
T4 = $756
Now let's move on to the stop-loss in case the market continues to decline:
SL1 = $703
SL2 = $686
SL3 = $672
SL4 = $658
SL5 = $638

BNB's up trend explainedBINANCE:BTCUSDT
✅ The BNB currency is moving in an ascending channel on the daily timeframe in the short term, which has a good bullish guard, and we expect it to move towards the following targets in the mid term:
760, 793, 900, 1000
✅ The BNB currency has a slow movement speed but holds up well in corrections, which makes it a low investment risk 👌
⚠️ Disclaimer:
This is not financial advice. Always manage your risks and trade responsibly.
👉 Follow me for daily updates,
💬 Comment and like to share your thoughts,
📌 And check the link in my bio for even more resources!
Let’s navigate the markets together—join the journey today! 💹✨

Trading opportunity for BNBUSDTBased on technical factors there is a Sell position in :
📊 BNBUSDT
🔴 Sell Now
🪫Stop loss 708.00
🔋Target 685.00
📏 R/R 2
💸RISK : 1%
We hope it is profitable for you ❤️
Please support our activity with your likes👍 and comments📝

XRP ShortThe last two shorts I've taken on this coin have given me profit to walk away with before stopping me from taking the bigger swing I am looking for. I am happy to keep shorting until my target is met. This coin may have a future, but not right now IMO.
In short, I haven't lost yet.
This is just chop. Dubai isn't sending this to the moon and more adoption pumps are coming on the way down
I will stick to my narrative until the market says otherwise
Stay safe in this bear market and enjoy it. We won't get one like this for a very long time, if ever.
PS. Leave your immaturity to yourself, you won't get a response from me just because you don't agree or you're upset that I'm speaking the truth and won't be invested like you want to so I can lose along with 90% of the market.

BNB SWING LONGSwing Long BNB Opened:
⠀
The 2021 all-time high is the most critical level for me to watch. Historically, this level has acted as a strong support and resistance zone. Additionally, the price recently tapped the first 4H order block, showing a solid reaction from a 4H perspective.
⠀
My trade strategy is grounded in sentiment (ATR) and general average price. Currently, all indicators have flipped green, even though the price hasn’t yet broken the previous internal swing high (1D perspective).
⠀
Key Levels:
2021 All-Time High, as strong support especially with the current 4H reaction from it
Current ATH, This level will be my 75% TP, since its bove 3R (which is my minimum required R per trade, also This level holds liquidity and offers potential for price discovery above, where i will take the 25% (1.2 dev)
Last Internal daily Swing High, Breaking this level could create upward momentum tp reach the minimum target of the ATH.
The daily ATR sentiment confirms a bullish bias with a green signal,. (Main criteria for system)
⠀
Trade Details:
Stop-Loss: Below the lowest wick from the 4H OB test. This area also aligns with the 4H 24/42 EMA, meeting my SL criteria.
Targets, 75% of the position will be exited at the current ATH. The remaining 25% will aim for the 20% deviation zone above the all time high, ($829.23 on Phemex linear charts).
⠀
This trade offers a potential R of 4.2, with a maximum of 5.1R in total on average.
⠀
Comparative Analysis:
Looking at the weekly BNB chart versus the daily BTC chart, I noticed similarities in structural behavior. While the timeframes differ, the fractal nature of the market validates this comparison.
⠀
Both charts show clear break-of-structure patterns with higher-low formations. On the BTC weekly chart, three BOS moves have occurred since the last low, mirroring 2 break of structures on the BNB chart. BNB is approaching its ATH without significant rejections, which I interpret as a sign of strength.

BNB Analysis: Key Levels to Watch for the Next Move 24.12.31Hello, this is Greedy All-Day.
Today's analysis focuses on BNB.
Review of the Previous Analysis
Let’s start by reviewing the previous analysis.
In the last analysis, I mentioned that if the red box resistance trendline is broken to the upside, there is a high probability of the price rising to the next supply zone.
The price initially faced resistance at the 720 level (first resistance), retraced slightly, but eventually broke through and rose to the upper boundary of the blue box supply zone at 731.
The resistance occurred at the green box high within the blue box.
Subsequently, the price failed to break the high, leading to a corrective phase.
BNB Chart from a Buy Perspective
From the daily chart, the resistance trendline has been drawn, extending from previous highs.
For new buy entries, it would be safer to wait for a breakout above the 738 level (red box).
Currently, with Bitcoin in a corrective phase and altcoins also struggling, entering at uncertain levels should be avoided.
If the price breaks above 738, a retest of the high—similar to what happened in the yellow box on the left—could occur, with a potential rise at least to the blue box supply zone.
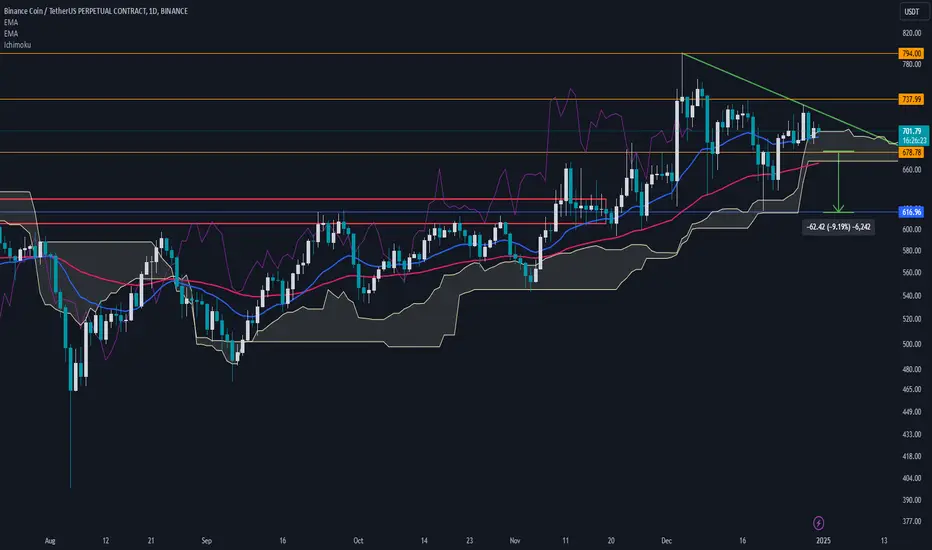
BNB Chart from a Sell Perspective
Since the bullish candle on December 23, 2024, the price has consistently held above the 678.78 level.
If the red box is broken to the downside, the price could either create a long lower wick, as seen in the yellow box, or experience a complete fill, resulting in a significant decline.
Additional Evidence
The yellow box and the current high are similar, with a one-way drop previously resulting in a test of the 617 support level.
As of now, the 617 level, which acted as resistance from June 2024 to November 2024, has turned into support.
If the price drops, there’s a possibility of a 10% correction, with a one-way decline toward 617.
Conclusion
BNB is currently at a critical juncture. While there are opportunities for both upward and downward moves, waiting for confirmed breakouts or breakdowns will be key to minimizing risk and maximizing profit potential.