BNB/USDT 4H Chart: Rising Channel with Fractal Vibes!Hey traders! Binance Coin is showing some promising action that’s got me on the edge of my seat!
We’ve got a clear rising channel in play, with BNBUSDT moving beautifully in sync with a fractal line pattern shown above the chart — mirroring past price behavior like a roadmap! BNBUSDT is currently trading at $650 , I think price will continue bouncing between the channel’s support at $620-$600 and move upwards to the key resistance target at $700-$720 . A breakout above this resistance could send BNB soaring to new highs, potentially targeting $800 or beyond!
However, if BNB fails to break through, we might see a pullback to the channel support at $620-$600 .
Key Levels to Watch:
Resistance: $700-$720
Support: $620-$600
Breakout Target: $800+
Breakdown Risk: $600
Is BNB about to blast through $720, or will it retreat below support? Let’s hear your thoughts below!
Bnbanalysis

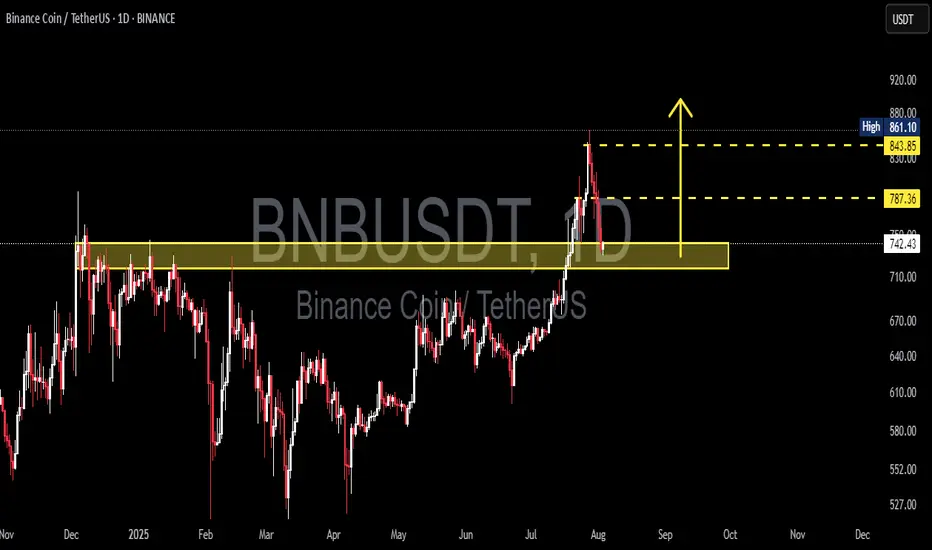
BNBUSDT Critical Retest in Progress📊 Comprehensive Analysis:
BNB/USDT has finally managed to break out of a major consolidation range that lasted over 6 months, with the key resistance zone between $730 and $750 acting as a strong ceiling since late 2024.
The breakout in late July 2025 was supported by a noticeable increase in volume, signaling strong accumulation and a possible shift from a ranging market to a bullish trend.
Now, the price is revisiting this previous resistance — a crucial retest zone that will likely determine whether this move is sustainable or a potential bull trap.
---
🔍 Key Price Levels Identified:
🟡 Retest Support Zone (Previous Resistance):
$730 – $750 → A critical area that must hold to maintain the bullish market structure.
🟡 Minor Resistance:
$787.36 → Recently rejected, this is the next short-term barrier that bulls must break.
🟡 Major Resistance (Swing High):
$843.85 → Key historical level before reaching the recent local high.
🔵 Recent Local High (Potential Double Top or Breakout):
$861.10 → A break above this level could open the doors to fresh highs.
---
✅ Bullish Scenario:
If BNB holds above the $742.36 level and prints a strong bullish reversal candle (e.g., pin bar or bullish engulfing), the retest can be considered successful.
Next upside targets:
🎯 $787.36 → Immediate resistance
🎯 $843.85 → Key swing high
🎯 $861.10 → Local high
🎯 $900 psychological level → If momentum and volume persist
Look for decreasing volume during retracement and surging volume on breakout to confirm bullish continuation.
---
❌ Bearish Scenario:
If the price fails to hold above $742.36 and breaks down below $730, this may confirm a false breakout (bull trap).
Downside targets could include:
⚠️ $710 – $690 → Minor demand zone
⚠️ $660 – $640 → Historical support within the previous range
A bearish confirmation would come from a lower high formation followed by a strong bearish breakdown candle with increasing volume.
---
📈 Chart Pattern & Price Structure:
The breakout indicates a bullish continuation pattern.
Potential formation of a Bullish Flag or an Ascending Channel, if support holds and consolidation continues above $740.
No major signs of distribution yet — the structure remains healthy and bullish.
---
🧠 Strategic Summary:
> The market has shown strong bullish intent, but it is now at a critical retest phase. Holding this zone could ignite the next leg up. Failure to do so, however, may signal a reversal or deeper correction.
For swing traders, the $730–$750 zone is a golden pocket for potential entries with tight risk management. For conservative traders, a confirmed breakout above $787–$843 offers a safer opportunity.
#BNBUSDT #BNBAnalysis #CryptoBreakout #Altcoins #TechnicalAnalysis #PriceAction #SupportResistance #BullishScenario #BearishScenario #CryptoTrading #BinanceCoin #SwingTrading
BNB WEEKLYHello friends🙌
🔊We are here with BNB analysis:
A long-term analysis that can be viewed as an investment, but in the long term, with patience and capital management...
You can see that after weeks of price suffering, a good upward move has now been formed by buyers, which has also caused a new ceiling to be set. Considering the market decline and the decline of most currencies, you can see that BNB is well supported and its price has suffered.
⚠Now, with the arrival of buyers, you can enter a long-term buy trade with capital management.
🔥Follow us for more signals🔥
*Trade safely with us*

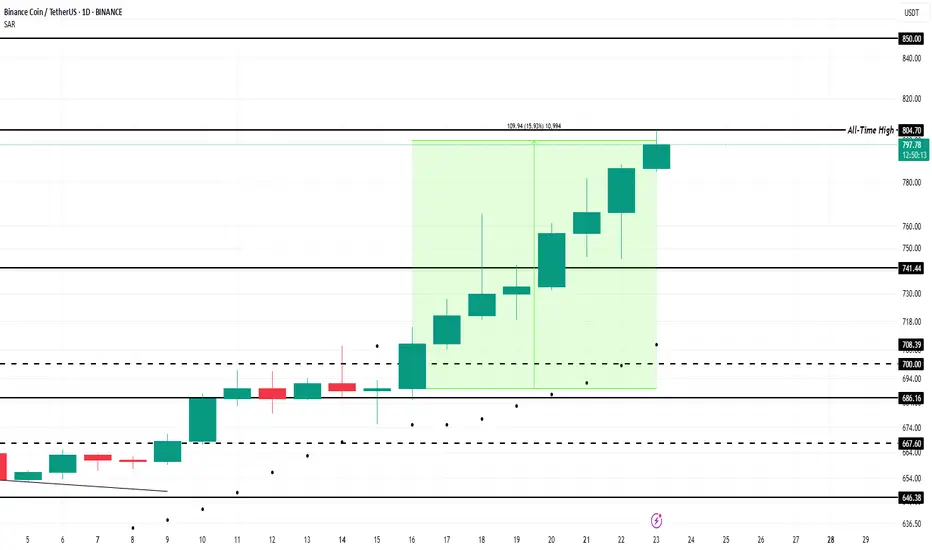
BNB Price Forms New All-Time High Above $800; Ends 7-Month WaitBINANCE:BNBUSDT price reached $804 today after a 16% increase over the past week, marking a new ATH . The altcoin has successfully ended a long period of consolidation and now stands at $799.
Its recent price movements indicate strong upward momentum, suggesting the potential for further gains. For nearly seven weeks, BINANCE:BNBUSDT has seen consistent accumulation . This trend is reflected in the exchange net position change, which shows growing investor interest in the altcoin
The bullish market sentiment is helping BINANCE:BNBUSDT break through key resistance levels. If this momentum continues, BNB could reach the $850 mark , a psychological milestone for the altcoin. This level could attract more investors and provide further price support, pushing BNB higher in the coming days.
However, should BNB holders decide to secure profits , the altcoin could face a price pullback. If selling pressure intensifies, BINANCE:BNBUSDT may slip below its current support level of $741 , which would invalidate the bullish outlook. A drop to this level would suggest a shift in sentiment, likely leading to a market correction.
Skeptic | BNB Surge: Rocket Triggers for Spot & FuturesHey everyone, it’s Skeptic! 😎 Is BNB ready to rocket? I’m diving into a pro-level breakdown of Binance Coin (BNB), a top 5 crypto with a $92.9B market cap, now trending on CoinMarketCap with surging momentum. This analysis unpacks recent upgrades, ecosystem strength, and technical triggers for spot and futures trading, grounded in cycle-based strategies. Trade with no FOMO, no hype, just reason.
Recent Performance & Key Events
Binance Coin ( BNB ), trading at $ 660 with a $92.9 billion market cap, ranks among the top 5 cryptocurrencies globally. The Maxwell hard fork in recent weeks slashed block times to 0.75 seconds, boosting network speed and efficiency, adding $8 billion to the Binance Chain’s market cap. BNB powers the Binance ecosystem, supporting staking, NFTs, and DeFi projects. Despite regulatory scrutiny, ongoing platform expansion and token burn mechanisms sustain BNB’s utility and investor interest. Let’s dive into the technical setup for actionable trades. 📊
Technical Analysis: Cycle-Based Breakdown
The Weekly timeframe is range-bound, so lower timeframes drive price action. Let’s break it down:
Daily Timeframe
On the Daily, we had a primary uptrend within an upward channel, which broke downward. I cloned the channel and placed it below, and price has reacted well to the midline, still holding there. A midline break could drive price to the channel floor at $536.47. However, a V-pattern stands out as one of the strongest patterns. Why? It shows sellers broke support and consolidated below, but buyers overwhelmed them, pushing price back above support instantly. This signals immense buying pressure, liquidating shorts despite heavy selling—big respect to buyers! lol
💬 For spot trading , wait for BTC.D to turn bearish, as rising BTC.D means liquidity flows to Bitcoin, making altcoin buys less attractive. BNB/BTC turning uptrend is another confirmation—currently, BNB/BTC is bearish, so focus on Bitcoin for now. Check pair/BTC ratios to spot coins outperforming Bitcoin.
Key Insight: Volume and BTC.D/BNB/BTC confirmation are critical for spot buys to avoid low-liquidity traps.
4-Hour Timeframe (Futures Triggers)
On the 4-hour, for longs:
Trigger: Break of resistance at $ 664.69 , confirming the V-pattern. Validate with a volume surge on breakout and RSI entering overbought.
Short Trigger: If support at $ 637.46 breaks again, go short, as buyers may lack strength after exhausting their effort in the prior defense. Volume confirmation is essential.
Pro Tip: ALWAYS use volume to confirm positions. Without a volume spike, fakeout risk is high. Stick to 1%–2% risk per trade to protect capital.
Final Vibe Check
This BNB breakdown delivers precise triggers: long at $664.69 (futures with V-pattern confirmation), short at $637.46 (futures). With a range-bound Weekly and Daily V-pattern, volume and BTC.D/BNB/BTC signals are your edge. BNB’s Maxwell fork and ecosystem strength fuel its potential, but regulatory risks demand tight stops. Want more cycle setups or another pair? Drop it in the comments! If this analysis sharpened your game, hit that boost—it fuels my mission! 😊 Stay disciplined, fam! ✌️
💬 Let’s Talk!
Which BNB trigger are you eyeing? Share your thoughts in the comments, and let’s crush it together!

BNBUSDT Forming Bullish PennantBNBUSDT is showing an impressive breakout pattern that’s catching the attention of crypto investors and traders alike. Binance Coin has consistently proven itself as a top altcoin, and this breakout signals a strong shift in momentum that could push prices higher by 10% to 20% in the short term. The current surge in trading volume supports this bullish scenario, indicating that both retail traders and institutional players are positioning themselves for potential upside gains.
This breakout is not just a technical event — it’s underpinned by BNB’s robust fundamentals. Binance Coin remains one of the most utility-driven tokens in the crypto market, with use cases ranging from transaction fee discounts on the Binance Exchange to staking, launchpad participation, and even DeFi projects. As Binance continues to expand its ecosystem, the demand for BNB is likely to grow, adding fuel to this breakout rally.
For traders, the key is to watch for price stability above the breakout level and look for confirmation signals that the move is backed by sustainable momentum. Managing risk with clear stop-losses and profit targets will be crucial as the market reacts to broader trends and any news from the Binance ecosystem. With the current sentiment positive and buyers stepping in aggressively, BNB could be poised for another leg higher in its long-term uptrend.
✅ Show your support by hitting the like button and
✅ Leaving a comment below! (What is You opinion about this Coin)
Your feedback and engagement keep me inspired to share more insightful market analysis with you!

BNB to Make History Before 2026 BeginsCRYPTOCAP:BNB is setting up for something big. Price is holding strong above the rising support line, with the 50 EMA acting as dynamic support.
It's consolidating just below the all-time high — a classic sign of strength. Structure looks solid, momentum is building, and the chart favors bulls.
Mark my words — BNB will not only retest its ATH, but break it and go beyond before the year ends.
DYOR, NFA

BNB/USDT Trade Setup: Bullish Trend, Discount Entry & Fibonacci 📈 BNB/USDT Trade Setup Breakdown 💰🔥
Currently watching BNB / USDT closely... and it's looking interesting! 🧐
BNB has been in a steady, bullish trend with consistent retracements into equilibrium of previous price ranges — offering repeated opportunities to buy at a discount. 📉💸
My bias remains bullish — I'm looking to continue with the trend.
Price has pulled back into my optimal entry zone, you could get long now or wait for a deeper pullback, depending on your personal entry criteria. 🎯
🛡️ Stop-loss goes just below the previous swing low, maintaining tight risk control.
In this video, I break down:
🔹 How I use Fibonacci + Fibonacci extension for precise entries and target zones
🔹 My custom Risk/Reward tool, a variation of the Fib extension.
🔹 Key zones I’m watching, and how I’m managing this setup.
⚠️ Not financial advice. Always do your own research and manage risk accordingly.
💬 Your opinions or feedback? Let me know in the comments 👇

BNBUSDT | Watching the Blue BoxesBNBUSDT is setting up a possible move, and I’ll be watching for an upward break inside the blue boxes .
No need to jump the gun. If price breaks out with volume and confirms on a lower timeframe, that’s where opportunity begins .
“I will not insist on my short idea. If the levels suddenly break upwards and do not give a downward break in the low time frame, I will not evaluate it. If they break upwards with volume and give a retest, I will look long.”
Let others guess. You wait with purpose.
📌I keep my charts clean and simple because I believe clarity leads to better decisions.
📌My approach is built on years of experience and a solid track record. I don’t claim to know it all but I’m confident in my ability to spot high-probability setups.
📌If you would like to learn how to use the heatmap, cumulative volume delta and volume footprint techniques that I use below to determine very accurate demand regions, you can send me a private message. I help anyone who wants it completely free of charge.
🔑I have a long list of my proven technique below:
🎯 ZENUSDT.P: Patience & Profitability | %230 Reaction from the Sniper Entry
🐶 DOGEUSDT.P: Next Move
🎨 RENDERUSDT.P: Opportunity of the Month
💎 ETHUSDT.P: Where to Retrace
🟢 BNBUSDT.P: Potential Surge
📊 BTC Dominance: Reaction Zone
🌊 WAVESUSDT.P: Demand Zone Potential
🟣 UNIUSDT.P: Long-Term Trade
🔵 XRPUSDT.P: Entry Zones
🔗 LINKUSDT.P: Follow The River
📈 BTCUSDT.P: Two Key Demand Zones
🟩 POLUSDT: Bullish Momentum
🌟 PENDLEUSDT.P: Where Opportunity Meets Precision
🔥 BTCUSDT.P: Liquidation of Highly Leveraged Longs
🌊 SOLUSDT.P: SOL's Dip - Your Opportunity
🐸 1000PEPEUSDT.P: Prime Bounce Zone Unlocked
🚀 ETHUSDT.P: Set to Explode - Don't Miss This Game Changer
🤖 IQUSDT: Smart Plan
⚡️ PONDUSDT: A Trade Not Taken Is Better Than a Losing One
💼 STMXUSDT: 2 Buying Areas
🐢 TURBOUSDT: Buy Zones and Buyer Presence
🌍 ICPUSDT.P: Massive Upside Potential | Check the Trade Update For Seeing Results
🟠 IDEXUSDT: Spot Buy Area | %26 Profit if You Trade with MSB
📌 USUALUSDT: Buyers Are Active + %70 Profit in Total
🌟 FORTHUSDT: Sniper Entry +%26 Reaction
🐳 QKCUSDT: Sniper Entry +%57 Reaction
📊 BTC.D: Retest of Key Area Highly Likely
📊 XNOUSDT %80 Reaction with a Simple Blue Box!
📊 BELUSDT Amazing %120 Reaction!
📊 Simple Red Box, Extraordinary Results
I stopped adding to the list because it's kinda tiring to add 5-10 charts in every move but you can check my profile and see that it goes on..

BNB TIME TO BUY?Hello friends
Due to the change in structure and the entry of buyers and the breakdown of the downtrend, we can buy in steps within the specified ranges and move with it to the specified targets, of course with capital and risk management...
*Trade safely with us*

BNB Bulls Must Defend This LevelBNB is currently trading near a key support and resistance zone, a historically significant area that has acted as both supply and demand over the past few years. After reaching its all-time high (ATH) near $793, price has been gradually correcting, and is now approaching a critical point.
The 50-week EMA (Exponential Moving Average) is acting as dynamic support, and so far has played a strong role in providing bounce zones during corrections. This EMA is currently being tested once again, and price action around it will be crucial.
Just below this lies a major horizontal support zone around $415–$430, which previously served as a breakout base in 2023. If this area holds, BNB could see a rebound attempt.

BNBUSDT | Key Support & Resistance Zones – Trade With PrecisionThe blue box that I gave as resistance 5 days ago gave 8% profit right from the blue box.
Now I think Red Lines has to should be carefully used for shorts.
🔹 %80 Daily Volume Spike – This means we are dealing with a highly active setup, making it one of the most crucial trades of the day. Smart traders focus on high-volume movers, and that’s exactly why we’re here.
Now, I still stand by my analysis and expect the lower blue box below to act as strong support.
🔴 Short Scenario (Red Line Rejections):
✔️ If price rejects from the red lines with LTF breakdowns, I will look for short opportunities.
✔️ CDV & Volume Footprint Confirmations – We need sellers to step in aggressively before considering entries.
✔️ The market respects precision, not emotions. No confirmation = no trade.
🟢 Long Scenario (Regaining Red Lines):
✔️ If price breaks above the red lines with strong volume and successfully retests them as support, I will switch to a long bias.
✔️ LTF Confirmations Are Key – Without a proper reclaim, there’s no reason to rush longs.
Why My Levels Matter
This isn’t just a random setup—my levels are based on deep market insights that most traders don't even understand. That’s why my success rate speaks for itself.
The market is not a guessing game—it’s a battlefield where only the well-prepared win. I provide the roadmap, it’s up to you to execute.
📌I keep my charts clean and simple because I believe clarity leads to better decisions.
📌My approach is built on years of experience and a solid track record. I don’t claim to know it all but I’m confident in my ability to spot high-probability setups.
📌If you would like to learn how to use the heatmap, cumulative volume delta and volume footprint techniques that I use below to determine very accurate demand regions, you can send me a private message. I help anyone who wants it completely free of charge.
🔑I have a long list of my proven technique below:
🎯 ZENUSDT.P: Patience & Profitability | %230 Reaction from the Sniper Entry
🐶 DOGEUSDT.P: Next Move
🎨 RENDERUSDT.P: Opportunity of the Month
💎 ETHUSDT.P: Where to Retrace
🟢 BNBUSDT.P: Potential Surge
📊 BTC Dominance: Reaction Zone
🌊 WAVESUSDT.P: Demand Zone Potential
🟣 UNIUSDT.P: Long-Term Trade
🔵 XRPUSDT.P: Entry Zones
🔗 LINKUSDT.P: Follow The River
📈 BTCUSDT.P: Two Key Demand Zones
🟩 POLUSDT: Bullish Momentum
🌟 PENDLEUSDT.P: Where Opportunity Meets Precision
🔥 BTCUSDT.P: Liquidation of Highly Leveraged Longs
🌊 SOLUSDT.P: SOL's Dip - Your Opportunity
🐸 1000PEPEUSDT.P: Prime Bounce Zone Unlocked
🚀 ETHUSDT.P: Set to Explode - Don't Miss This Game Changer
🤖 IQUSDT: Smart Plan
⚡️ PONDUSDT: A Trade Not Taken Is Better Than a Losing One
💼 STMXUSDT: 2 Buying Areas
🐢 TURBOUSDT: Buy Zones and Buyer Presence
🌍 ICPUSDT.P: Massive Upside Potential | Check the Trade Update For Seeing Results
🟠 IDEXUSDT: Spot Buy Area | %26 Profit if You Trade with MSB
📌 USUALUSDT: Buyers Are Active + %70 Profit in Total
🌟 FORTHUSDT: Sniper Entry +%26 Reaction
🐳 QKCUSDT: Sniper Entry +%57 Reaction
📊 BTC.D: Retest of Key Area Highly Likely
📊 XNOUSDT %80 Reaction with a Simple Blue Box!
📊 BELUSDT Amazing %120 Reaction!
I stopped adding to the list because it's kinda tiring to add 5-10 charts in every move but you can check my profile and see that it goes on..

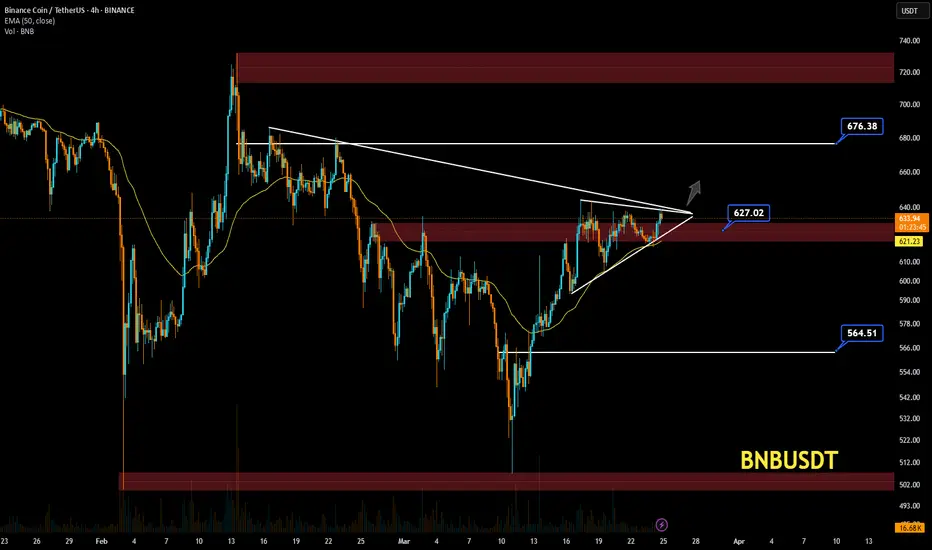
BNBUSD BNBUSD Price Action Analysis – 4H Timeframe 📊🔥
Market Structure:
The chart shows a symmetrical triangle pattern forming, with the price approaching a breakout. 📈🔺
Supply and demand zones are marked with red boxes, indicating key levels for reaction. 🟥
The price is currently testing the $627.02 resistance level. 🚀
Trend Analysis:
A Higher Low (HL) was recently formed at $564.51, maintaining the bullish trend. 🔼
The 50 EMA at $621.21 acts as a strong dynamic support. 📉
Increasing volume suggests a potential breakout. 📊
Key Levels:
Resistance:
The $627.02 - $630 area is a critical supply zone. If broken, the next target would be $676.38. 🎯
A breakout above this level could confirm strong bullish momentum. 🟢
Support:
The $621.21 level, aligning with the 50 EMA, serves as a key support. 📉
If this level breaks, a potential decline toward $564.51 is possible. ⚠️
Possible Scenarios:
🔹 Bullish Case: A confirmed breakout above $627 could push the price toward $676. 🚀
🔹 Bearish Case: Rejection from resistance and a break below $621 may lead to a drop to $564. ❌
📌 Conclusion:
Watching for breakout confirmation before making any decisions. 🔎
Key levels: $627 (resistance) and $621 (support). 📍
Volume and price action will determine the next move. 📊
BNB/USDT UPDAEHello friends
With the price drop, we now see that the sellers are gradually failing and the buyers have succeeded in supporting the price.
Now we can buy in stages and with capital management and move towards the specified goals.
*Trade safely with us*
$BNB Price Travel $888 Price Level Area and see more chart CRYPTOCAP:BNB OVERVIEW
ENTRY AREA IS $613 AND STOPLOSS $500 BELOW, LAST TRAVEL $888 PRICE LEVEL IN 2025
Bubblemaps Launches Token Generation Event on BNB Chain, Sets Fundraising Goal of $800K
According to an announcement from Binance, the event, which is exclusively hosted on the BNB chain via PancakeSwap, will run from 8:00 AM UTC to 10:59 AM UTC.
The TGE offers investors the opportunity to acquire 40 million BMT tokens priced at $0.02 each as the project team tries to raise $800,000 in BNB to fund further developments. This event would distribute 4% of Bubblemaps’ total supply of 1 billion tokens in return to participants.s
The project team noted that each wallet’s contribution would determine its share, which is proportional to the total BNB deposited. There is a participation cap of 3 BNB per wallet to ensure fair distribution.
Binance’s Pascal Hardfork to Enhance BNB Chain – Key Features and Price Impact Table of Contents Announcements / Trading Analysis
Binance’s Pascal Hardfork to Enhance BNB Chain – Key Features and Price Impact BNB.
Binance’s Pascal Hardfork to Enhance BNB Chain – Key Features and Price Impact
What the Pascal Hardfork Brings to BNB Chain
BNB Price Action and Market Predictions
BNB Chain’s Future Upgrades
Conclusion
March 11, 2025 – Binance’s BNB Chain has scheduled the Pascal Hardfork for March 20, bringing significant upgrades, including Ethereum compatibility on the mainnet. This move aligns with BNB Chain’s broader 2025 roadmap to enhance scalability, transaction efficiency, and decentralized governance.
The Ethereum EIP-7702 implementation enables gasless transactions, batch approvals, and multi-signature support, making it easier for users to interact with decentralized applications (dApps) on BNB Chain. The upgrade also activates BEP-439, which improves transaction security through BLS12-381 curve verification.
What the Pascal Hardfork Brings to BNB Chain
BNB Chain developers have emphasized the importance of this upgrade for Ethereum Virtual Machine (EVM) compatibility, helping bridge the gap between Binance and Ethereum ecosystems. Key benefits include:
Enhanced User Experience – dApps can now pay gas fees on behalf of users.
Stronger Security – BLS12-381 verification ensures secure smart contract execution.
Faster Transactions – The Pascal Hardfork sets the stage for future updates that will reduce block time.
Community Governance – The “Vote to List” and “Vote to Delist” mechanisms allow BNB stakers to decide which tokens stay on the BNB Smart Chain.
The upgrade requires node operators, validators, and exchanges to update to v1.5.7, or risk desynchronization from the network.
BNB Price Action and Market Predictions
As of writing, BNB trades at $564.56, fluctuating within the $550–$575 range.
Analysts observe structural shifts, with key resistance and support levels shaping the next price movement:
Bearish scenario – If BNB fails to hold $550, it may decline further to $525 or even $500.
Bullish scenario – Holding above $550 could push BNB to $600, with a potential breakout to $650.
BNB’s previous high at $725 indicates strong resistance, and a rejection from $575 may confirm further downside. However, if momentum shifts, the upgrade could help BNB regain ground amid broader altcoin market movements.
A distinctive feature of this TGE is the immediate tradability of tokens post-subscription, eliminating traditional lock-up periods. Investors can trade BMT tokens immediately after the event on either Binance Wallet’s DEX or directly on PancakeSwap. This real-time liquidity is a bold play, designed to attract traders and investors eager for quick action.
#BTC☀ #BinanceAlphaAlert #BinanceSquareFamily #Write2Earn #SUBROOFFICIAL
Disclaimer: This article is for informational purposes only and does not constitute financial advice. Always conduct your own research before making any investment decisions.

#BNBUSDT forecast for a long move📉 LONG BYBIT:BNBUSDT.P $589.70
🛡 Stop Loss: $588.50
⏱ 1H Timeframe
📍 Overview:
➡️ BYBIT:BNBUSDT.P continues to move within an ascending channel, gradually recovering after a local correction.
➡️ P OC (Point of Control) at $588.10 indicates a high-interest zone, from which price has rebounded multiple times.
➡️ The key resistance zone is around $592.45 , where the first profit target is set.
➡️ Holding above the current level could trigger further upside movement towards $596.00, strengthening the bullish momentum.
⚡ Plan:
➡️ Considering a LONG entry at $589.70, with a Stop Loss at $588.50 .
➡️ A breakout above $592.45 will confirm buyer strength and pave the way for $596.00.
➡️ Increased volume at the current level suggests institutional interest, increasing the probability of scenario execution.
🎯 TP Targets:
💎 TP 1: $592.45
💎 TP 2: $596.00
📢 BYBIT:BNBUSDT.P maintains a bullish structure despite temporary pullbacks.
📢 Key focus should be on price action at $592.45 – a breakout here will solidify the bullish case.
📢 Monitoring volume dynamics is crucial – increased buying activity will reinforce the uptrend.
🚀 BYBIT:BNBUSDT.P remains strong – expecting a move towards $596.00 upon breakout of key levels!

How Far BNB Would Make In This BullRun??
As Per Harmonic crab Pattern, #BNB first target aligns at 975$, the 1.618 fib level, where crab's D leg is likely to end.
As for elliott wave macro count, we're currently running in 5th macro wave which ends near about 1100-1250$ region.
In going for micro wave count of macro wave 5, we've completed 4th corrective wave & now heading for 5th micro of 5th macro wave, that also aligns with macro wave 5.

BNB Near ATH: New Highs on the Horizon?CRYPTOCAP:BNB is currently trading above a key support zone and the rising trendline.
It is just below its all-time high (ATH) levels, and we are anticipating the possibility of a new ATH from the current levels. Keep a close watch for further bullish momentum.
DYOR, NFA

BNB TO DUMP TO $460BNB ready to dump 🤔
I'm not a huge fan of pattern trading as it is very subjective, however when something is as obvious as this then it can't be ignored. BNB currently is in a very clear rising wedge pattern which only increases it's odds of playing out the way we expect it to. This is due to mass buyer confidence.
If we get more rejection from the ATH area of $750 and bearish bias continues on BTC then i do believe we'll see an aggressive break out here on BNB to the downside.
When compared to the likes of Solana which have similar functions and capabilities BNB is overpriced so this could also be a fundamental reason it could dump, to reset the value of BNB which would also in tern be good for BNB as it could increase it's user base as more people would be inclined to use it's chain for meme coins for example if they chain becomes all round cheaper.
Let's see how BNB continues to play out as it follow up the rising wedge pattern and squeezes into the final section. The squeeze will also allow a build of of liquidity and volume which will increase the volatility when price does break from this pattern.
If by some miracle we have a BTC pump, a large pump that is. Then we could see BNB break to the upside, but even if that does happen i believe it would only be temporary.

BnbBnb usdt Daily analysis
Time frame daily
Risk rewards ratio >2
My last bnb analysis was reached target.
Now I set a new target and new entrance
We heard news that CZ wants to come back to Binance and it depends on Mr. TRUMP
Another news we heard about alt season
These are good news for altcoins and bnb coin.
If bnb can break the strong resistance area ( blue box on chart ), may be a good pump starts.


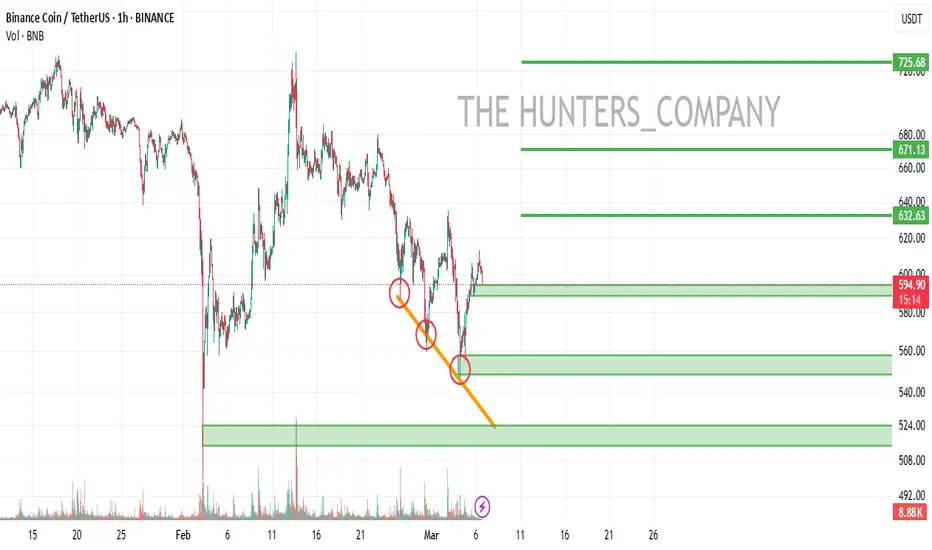
$BNB $BNBUSDT Daily Analysis After sweeping the daily highs in the weekly supply range, strong bearish momentum kicked in and we got daily bearish choch and a new supply to trade in if the price ever reaches to that zone.
My expectation is as drawn on the chart. Will look for sells if the price reaches to $600 levels

BNBUSDT Targeting 2021 All-Time High Amid CZ's Release!!BNBUSDT has successfully broken through key resistance levels and is gaining momentum towards the all-time high seen during the 2021 bull market. With Binance founder CZ set to be released today after serving 119 days in prison, this event may significantly impact BNB's price action.
Expecting a substantial upward movement, but as always, ensure you have your stop-loss in place to manage risk effectively.
BNBUSDT (1W Chart) Technical analysis
BNBUSDT Currently trading at $608
Buy level: Above $600
Stop loss: Below $500
TP1: $650
TP2: $720
TP3: $850
TP4: $1000
Max Leverage 3x
Follow Our Tradingview Account for More Technical Analysis Updates, | Like, Share and Comment Your thoughts
