BNXUSDT Breakout Imminent: High Volume Signals Potential 50-60%BNXUSDT is currently forming a strong breakout pattern, showing signs of bullish momentum. The trading volume is increasing, indicating that investors are actively participating in this move. With a solid structure and a breakout looking imminent, BNXUSDT could be set for a significant rally. Traders are closely watching this level, anticipating a strong price surge once the resistance is broken.
Technical analysis suggests that the price is consolidating just below a key breakout point. A successful breakout could trigger a sharp upward movement, with potential gains ranging from 50% to 60%+. The combination of strong volume and market interest further supports this bullish scenario. As the buying pressure builds up, BNXUSDT could soon enter a high-momentum phase, attracting more investors looking for profitable opportunities.
With the crypto market showing increased volatility and potential, BNXUSDT remains a promising asset to watch. Traders and investors are advised to keep an eye on this pair as it moves closer to its breakout zone. A confirmed breakout with sustained volume could validate the anticipated bullish run, offering traders a lucrative upside potential.
✅ Show your support by hitting the like button and
✅ Leaving a comment below! (What is your opinion about this coin)
Your feedback and engagement keep me inspired to share more insightful market analysis with you!
BNBBTC

#BNB/USDT#BNB
The price is moving within a descending channel on the 1-hour frame, adhering well to it, and is heading for a strong breakout and retest.
We are seeing a bounce from the lower boundary of the descending channel, which is support at 517.
We have a downtrend on the RSI indicator that is about to be broken and retested, supporting the upward trend.
We are looking for stability above the 100 moving average.
Entry price: 558
First target: 573
Second target: 591
Third target: 614

BNB/BTC : BNB Ready to Outperform Bitcoin?"Analyzing the BNBBTC weekly timeframe and the current market structure, I anticipate that BNB will outperform Bitcoin by a factor of two. In other words, if Bitcoin rallies 50%, we could see BNB doubling in value. Do you think BNB is positioned to reach $1,000?"
BNB New Update (1W)If you have been following our BNB analyses, you would know that we previously identified its pattern as a triangle.
The price reacted to the green zones from our previous analysis, but based on the weekly candles, it seems that wave E will be deeper.
We are looking for buy opportunities within the green zone, with a minimum target of $800.
This is our current outlook on BNB.
For risk management, please don't forget stop loss and capital management
Comment if you have any questions
Thank You

#BNB /USDT Ready to launch upwards#BNB
The price is moving in a descending channel on the 1-hour timeframe and sticking to it well
We have a bounce from the lower limit of the descending channel, this support is at 670
We have a downtrend on the RSI indicator that is about to break, which supports the rise
We have a trend to stabilize above the moving average 100
Entry price 682
First target 696
Second target 710
Third target 730

BNB | ALTCOINS | BNB Still BULLISH - Here's WHYIt can be concerning to see the price lose 5%-10% in the daily timeframe. However, this is not uncommon during a bullish cycle.
In this quick update, I explain why the price is still very evidently in a bullish cycel, despite corrections in the daily.
BTC and ETH update, find it here:
_______________
BINANCE:BNBUSDT

BNB TO DUMP TO $460BNB ready to dump 🤔
I'm not a huge fan of pattern trading as it is very subjective, however when something is as obvious as this then it can't be ignored. BNB currently is in a very clear rising wedge pattern which only increases it's odds of playing out the way we expect it to. This is due to mass buyer confidence.
If we get more rejection from the ATH area of $750 and bearish bias continues on BTC then i do believe we'll see an aggressive break out here on BNB to the downside.
When compared to the likes of Solana which have similar functions and capabilities BNB is overpriced so this could also be a fundamental reason it could dump, to reset the value of BNB which would also in tern be good for BNB as it could increase it's user base as more people would be inclined to use it's chain for meme coins for example if they chain becomes all round cheaper.
Let's see how BNB continues to play out as it follow up the rising wedge pattern and squeezes into the final section. The squeeze will also allow a build of of liquidity and volume which will increase the volatility when price does break from this pattern.
If by some miracle we have a BTC pump, a large pump that is. Then we could see BNB break to the upside, but even if that does happen i believe it would only be temporary.

BNB/USDT Weekly Chart Analysis.This chart BNB/USDT pair on the weekly timeframe with a clear inverted head and shoulders pattern
The left shoulder, head, and right shoulder structure is evident.
BNB successfully broke the neckline resistance (shaded area around $600-620).
The price surged after the breakout, reaching highs of ~$800 before cooling off slightly at $726.93.
The neckline could now act as strong support (~$600-620) if the price pulls back.
A successful retest would confirm further bullish momentum.
The black moving average line acted as dynamic support during the uptrend.
If BNB stays above the neckline and consolidates, potential upside targets include:
$800 (previous resistance area).
psychological levels of $900 and $1,000.
As long as BNB stays above the neckline, it will remain in an uptrend.
If the price bounces back, the neckline support area ($600–$620) is crucial for further upside.
A continuation of this breakout could lead to higher levels.
Disclaimer: This analysis is for informational purposes only and does not constitute financial advice. Always conduct your research and consult a financial advisor before making investment decisions.
For updates on other coins or personalized insights, feel free to reach out via DM.
@Peter_CSAdmin

BNB Shows Potential for GrowthAnalyzing Fibonacci levels and the current channel, further price increases seem likely in the coming days or weeks.

BNB Breaks 4-Year Range – Big Move Ahead!BNBUSDT Technical analysis update
BINANCE:BNBUSDT price has been trading within a rectangular range for the past 1,350 days. Today, the price broke out of the rectangle with high volume. A 100–200% move from the current level can be anticipated.
Buy zone : Below $770
Stop loss : $620
Target: 100-200%

BNB detailed analysis ⏰ detailed chart 📉📈My analysis on BINANCE:BNBUSD
Detailed chart 📉📈 provided
Every move I will update under this post 🤠
Make shure saved / follow updates on my post of BINANCE:BNBUSDT
Just boosting 🚀 give support 📌
Soon i will update complete idea 💡
🧵 👉

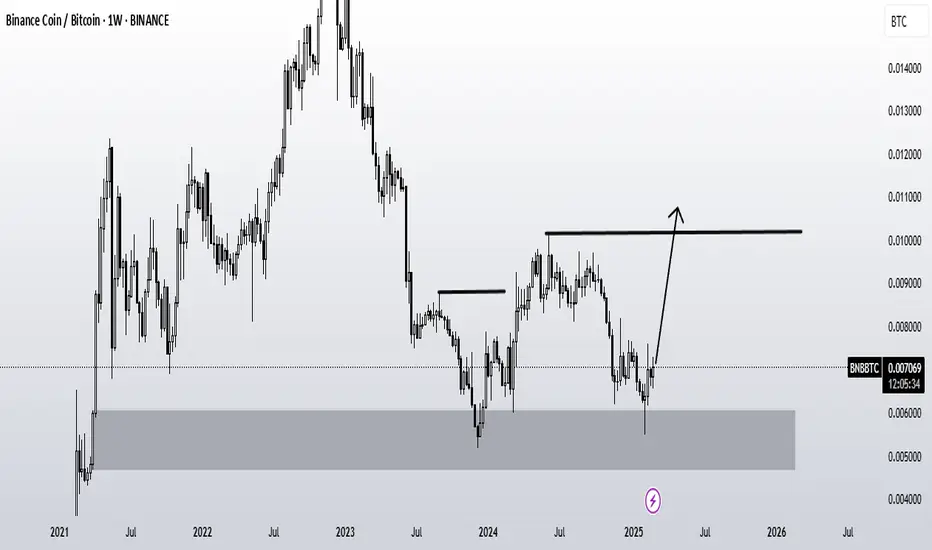
Borrow BTC and wait for a long on BNBBTCLet USDT as funds in margin account.
Borrow BTC from Kucoin and slowly open a position on BNBBTC. When finally BTC goes up, sell and return the borrowed BTC.
Calculation
Enter 0.0061
Target 0.0095
SL 0.0051
The eventual target is 60% or 11% loss.
Risks
- If BTC goes low before entering the position, you lose nothing(because the BTC is still intact)
- If BTC goes high before entering the position, that would probably help you entering into the position. But it also puts pressure on the original fund.
- If BNB doesn’t go up enough after entering the position, then it’s a loss of opportunity.
- If BNB never reaches the buying point, then you'll not have any profit or loss from anything. That would have opportunity loss

BNB will soon head to the moonThis analysis is an update of the analysis you see in the "Related publications" section
It seems a large triangle is nearing completion. If wave E reaches the green zone, it will be the best investment opportunity.
The target could be 4K and 9K.
Closing a weekly candle below the invalidation level would invalidate this view.
For risk management, please don't forget stop loss and capital management
Comment if you have any questions
Thank You


BNB/USDT Chart Update !!BNB/USDT 1-day chart shows a bullish setup, showing the price breaking out of a descending triangle pattern, which is typically a continuation signal. Here is a breakdown of the analysis:
BNB has recently broken the descending trendline of the triangle, indicating a bullish trend continuation. As indicated by the green line, the next target appears to be around the $713 resistance level.
The 50-day (red) and 200-day (green) moving averages are both located below the current price, providing strong support levels if a pullback occurs. This setup is favorable for the continuation of the bullish momentum.
The downward-facing upward trendline indicates additional support, which could protect the price from significant declines and maintain the bullish structure.
This setup is favorable for a long position, with a target around $713 and a stop-loss below the breakout level to manage risk effectively. Keep an eye on potential pullbacks to the trendline or moving averages for re-entry points if the bullish momentum stalls.
Disclaimer: This analysis is for informational purposes and is not financial advice. Always stay updated with market movements and adjust your trading strategies as needed.
You can DM us for information on any other coin.
@Peter_CSAdmin

BNB/USDT 1day chart analiysis. BNB is currently trading at around $584, moving within a tightening consolidation pattern. This pattern is bounded by a symmetrical triangle, with the upper trendline acting as resistance and the lower trendline as support.
The green line at approximately $713 represents a significant resistance level. A breakout above this level could indicate a strong bullish movement and potentially open up higher price targets.
The chart includes a red and green moving average, representing short-term and long-term trends, respectively. The price currently sits close to the red line, indicating that it’s approaching a critical point.
An upward arrow indicates a potential breakout scenario above the resistance level. This suggests that if BNB breaks out of the triangle pattern and crosses the $713 resistance level, it could continue its bullish momentum toward higher price zones.
In case of a rejection at resistance, the dotted green path suggests that
BNB might retrace to retest lower levels, potentially finding support around $520 or even lower within the triangle.
A breakout above $713 could trigger a bullish continuation, making BNB attractive for swing traders looking for upward momentum.
A failure to break the upper trendline may see BNB consolidating further within the triangle or dropping to lower support zones.
Disclaimer: This analysis is for informational purposes and is not financial advice. Always stay updated with market movements and adjust your trading strategies as needed.
You can DM us for information on any other coin.
@Peter_CSAdmin

BNBBTC Get ready for BNB's ride.BNBBTC is consolidating between the 1week MA50 and 1week MA100.
Once the 1week MA100 breaks, we expect the Cycle's massice rally to start, where BNB aggressively outperforms BTC in gains, similar to Jan - May 2021.
We expect a new All Time High April 2025.
Follow us, like the idea and leave a comment below!!

BNB/USDT LONG TRADE SETUP AND ANALIYSIS !!This BNB/USDT chart provides an update with a long trade setup.
Binance Coin (BNB) is currently trading around $578.1, and it is retreating slightly after touching the resistance zone.
Around $534.1, indicated by the following trendline, provides a potential bounce zone.
The target resistance level is around $711.4, which suggests bullish potential for this long trade.
The current price level of around $578.1 can be seen as an entry point for a long position, expecting the price to rise.
As protection against downside risk, support lies just below the level of around $507.1.
The green box highlights a target zone near $711.4, which offers a favorable risk-reward ratio if the price continues to move upwards.
The chart also indicates a potential breakout from the descending trendline, with the yellow moving average suggesting upward momentum.
The long setup expects the price to continue rising after this pullback, with the moving averages supporting the positive trend.
Disclaimer: This analysis is for informational purposes and is not financial advice. Always stay updated with market movements and adjust your trading strategies as needed.
You can DM us for information on any other altcoin.
@Peter_CSAdmin

BNB's Potential Surge: CZ's Release and Buyer Zone AnticipationThe recent developments surrounding CZ's release have sparked optimism across the market, potentially fueling a rise in BNB’s value. As seen in the chart, we are currently monitoring a key buyer zone (marked by the green box), which has been identified as a significant area of interest. If price action confirms this level, it could provide a strong entry point for buyers, aligning with the positive market sentiment following CZ's return.

ETH vs BTC vs SOL BNBETH was consistently lost value against BTC over multiple cycles, take a look also at SOLETH chart, you will see...
This trend, ETHBTC, is here to stay and ETH will remain just another coin?
My perspective: this cycle is decisive for ETH

BNB UppdateSo it looks like we have a good setup for some friday Bleeding in the crypto market.
looking to short Bnb inside the imbalance.

Blood on the leaves.BNB is breaking structure and has also hit the top of the 0.5 Fibonacci level. Back in July, after reaching that point, we went down to the 0 Fibonacci level and are now currently looking for a relief crash down to 0.27 and then 0.618.
We are also in the third wave down according to Elliott Wave Theory, completing the harshest wave. Last but not least, the structure is breaking out of a bear pennant. If you are familiar with price action and technical analysis, you can follow up and see that what I am articulating is accurate. Thanks for reading! :)

BNBUSDT BINANCE 1W-TIMEFRAME ANALYSIS💥BNBUSDT BINANCE 1W-TIMEFRAME ANALYSIS
💗Hello ladies and gentlemen
This is my new idea for 💥BNB BINANCE
I hope my idea is clear
Support me by like and share thank you
Stay Safe💯💲💲💲
Good luck💰😍
