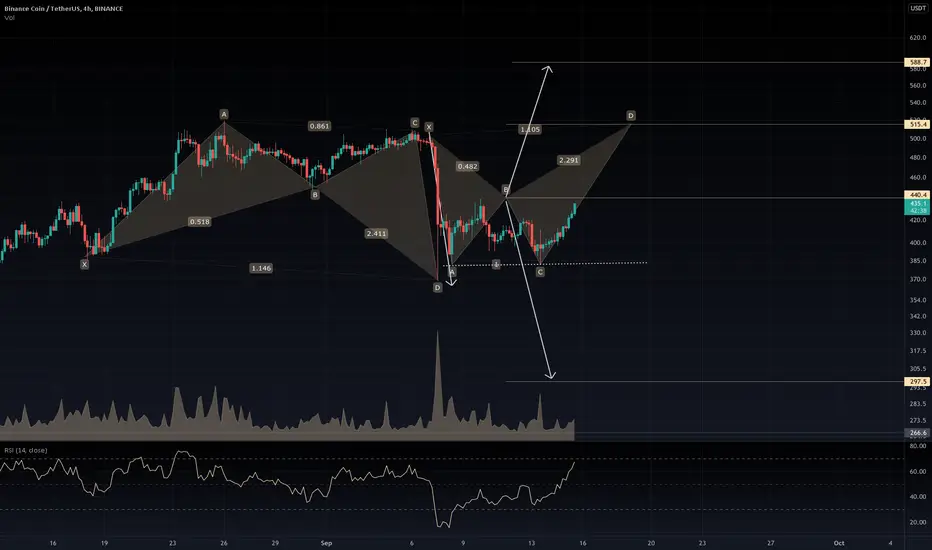
Cryptocurrencies, Crypto, Daily Chart, Trading Signal, BNB, AltsBNB is forming alternate bat pattern which will play out on the 4 hour timeframe
The $440 level is an important level for BNB to either run or fall
BNBBTC
UPDATE/BNB/LONGPOSITIONBINANCE:BNBUSDT
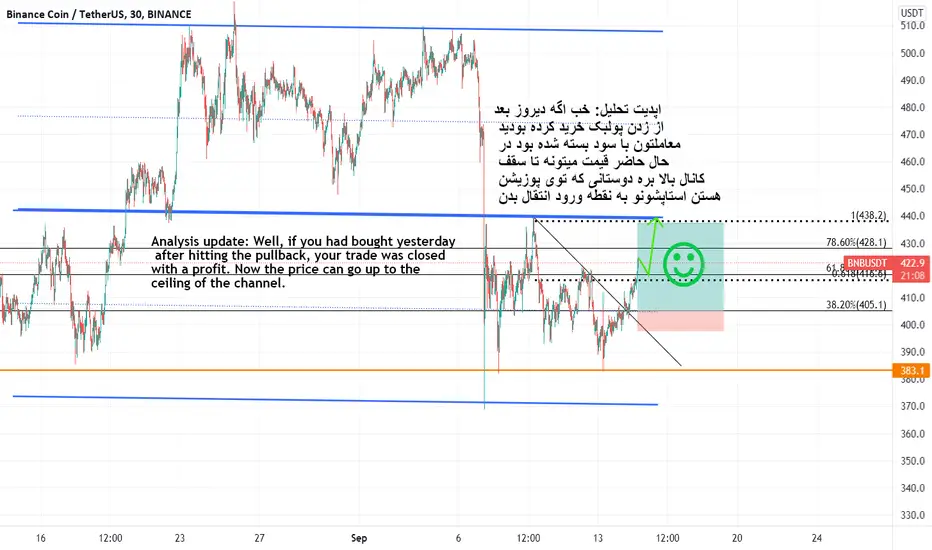
Analysis update: Well, if you had bought yesterday
after hitting the pullback, your trade was closed
with a profit. Now the price can go up to the
ceiling of the channel.
BNBUSD Are we going there? BNB has shown an affection for 0.618
This may morph into an affection for 1.618
As I have mentioned before BNB reminds me of early Bitcoin, based on price structure and price development

bnbusdt/bnblongpositionBINANCE:BNBUSDT
Open the long position
if the triangle breaks and
the price pulls back to the
resistance area.

BNB - when is the best time to buy 🤔❓❓In two of today's ideas, wrote about liquidations, and showed the best scenarios for buying from real-life examples in the past. If you are interested go to my page and take a look, it will be very useful, especially at this time.
When is the best time to buy bnb?
If the price makes a re-low several times and a trend line createsWrite in the comments all your questions and instruments analysis of which you want to see.
Friends, push the like button, write a comment, and share with your mates - that would be the best THANK YOU.
P.S. I personally will open entry if the price will show it according to my strategy.
Always make your analysis before a trade, a breakdown of this trend line will be the best point to buy.

BNB - when is the best time to buy?There is a lot riding on bitcoin in the market right now. Whether the market will go up or down remains to be seen. But the coin charts are now showing the formation of new uptrend structures.
- A big drop
- Liquidation
- Accumulation
- Compression
- Higher lows
The best entry point would be a continuation of squeezing, a break of a key level, a retest as support.
Friends, push the like button, write a comment, and share with your mates - that would be the best THANK YOU.
P.S. I personally will open entry if the price will show it according to my strategy.
Always make your analysis before a trade, a breakdown of this trend line will be the best point to buy.

bnbusdt/bnb long position/BINANCE:BNBUSDT
To open this position, wait for the red
trend line to be broken and then start buying.
Friends who have a high risk in trading will
enter the long position from now on.

BNB - time to sell? 😧😧So far, the whole market is not looking good for growth. Bitcoin and all altcoins are very likely to fall and collect liquidity below local lows.
What's on the BNB chart?
BNB is now near local support. Price has already tested this level several times, with each test weakening the level.
After a breakdown and retest of the level as resistance, the price is likely to correct to the lower liquidity zone.
Write in the comments all your questions and instruments analysis of which you want to see.
Friends, push the like button, write a comment, and share with your mates - that would be the best THANK YOU.
P.S. I personally will open entry if the price will show it according to my strategy.
Always make your analysis before a trade

BNB/USDT Ready for $1000 ( 140% from here ) ..?#BNB/USDT TA Update:-
$BNB currently trading at $416
Bounced back from strong support at $375
Now I am expecting first Target $500
And if Sustain and hold this $500 level then we can see Next Target will be $1000
But if break yellow line support then Exit.
Follow strictly this chart.
Never fall in emotions.
Entry:- $375-$415
Targets:- $500/$700/$1000
Stop Loss:- Below Yellow line.
Please click like button and Appreciate my hard work.
Must follow me for latest crypto real time updates.
Thank you.

bnbusdt/bnbshortBINANCE:BNBUSDT
Start the downward movement of the binance currency
Do not take a buying position


BNB- How our Levels worked During today's 'Storm'Massive dip today, probably well orchestrated too with billions of dollars lost in liquidations.
Let's take a step back and see how our levels works.
Look at our previous ideas below for comparison.
No love today,
the FXPROFESSOR

BNB USD [LONG] Exciting news about USD Smart Contract BlockchainAt the time of writing this I witnessed a rush and flood of people buying into Rex Token. I noticed 300 BNB per day go into this token. This is the new form of Hex coin where people do not want to miss it. It is a year long presale. At the time of writing this I saw that in the past two weeks after writing my first message all the TREX is sold out with only 2500 MREX left.
This is not an advertisement for Rex Token I am just amazed to see what has happened because the Trex was used 1 per metamask seed phrase account to 10x your tokens. There will be a DEX out selling these in awhile. There so much happening on the metaverse. Different bridges are now being developered to swap your tokens to different blockchains. It's really a big gold rush and it's really paying off. A lot of countries can do business now more easily. Imagine donating to EarthWallet.Bitcoin when there is an accident and it accepts 275 cryptocurrencies and then we build a jobboard at jobmonkey.x both domains of mine and you can get yours at UnstoppableDomains.com We can STAKE our USD and BNB and DOMAINS at UnstoppableDomains SOON. With BNB NOW.


Binance BNBUSDT - 3x Ascending channel on the weekly scale!- Binance Coin - BNB Rank #4 on CoinMarketCap.
- BNB is by far one of the most bullish altcoin out there!
- My impulse Elliott wave is telling me that there will be another pump very soon.
- 3x Parallel channel can act as a support / resistance in the future.
- For expected duration of the trade, probability, stop loss, profit target, entry price and risk to reward ratio ( RRR ) - please check my signature below ↓
- If you want to see more of these ideas, hit "Like" & "Follow"

inverted head and shoulder ? support and resistance for bnbif you like this call and analysis plz like and share and connect with me

bnb/usdBNB/usdt trade set up ready
BNB long - 472.476.480
Target- 500.510.520.530.540
Sl- 460
Happy trading
Thank you

BNB - bullish structure broken through 😲😲A bullish structure has formed on the bnb chart. The price is now trying to break the upper boundary of this structure. If the BnB breaks or tests the upper boundary as support, it would be a good buying opportunity.
Additionally, while bitcoin is in consolidation, it is a good time for altcoins to rise.
Write in the comments all your questions and instruments analysis of which you want to see.
Friends, push the like button, write a comment, and share with your mates - that would be the best THANK YOU.
P.S. I personally will open entry if the price will show it according to my strategy.
Always make your analysis before a trade

BNBUSD LONG 4H SCALEi think it can grow to the next level and after that it can grow again after consistency of price above the static level or can decrease to here again

$BNB, Willing to see if it can follow FTT Path..$BNB
Willing to see if it can follow the same path that FTT is showing..
Retesting/flipping ~0.01 sats level...
Volume still to appear but ATH just 20% away..
#BNB

BNB/USDT AnalysisBNB/USDT
We can see BNB try to bounce from current support level
📌 NEXT LEVEL FOR WATCHING ?
Around 508$-520$ (strong resistance)
price rejected from that level in late August which equal 0.61% Fibonacci resistance
Bulls should break and hold above that level if want more rise to next targets in chart
Support levels: around 430$ and 370$
If you have any questions feel free for ask
Best of wishes 🙏

Simple but smartAs we said, the support was valid and unfortunately it lost this valid support, so we expect the price to decrease.
Please follow me

$BNB Possible 4H Bullish Div $BNB could have a 4H bullish div on 4H chart if this candle close green.
Short term target 0.011
Long term target still the same.
