BNB ANALYSIS (4H)Hi, dear traders. how are you ? Today we have a viewpoint to BUY/SELL the BNB symbol.
For risk management, please don't forget stop loss and capital management
When we reach the first target, save some profit and then change the stop to entry
Comment if you have any questions
Thank You
BNBBTC

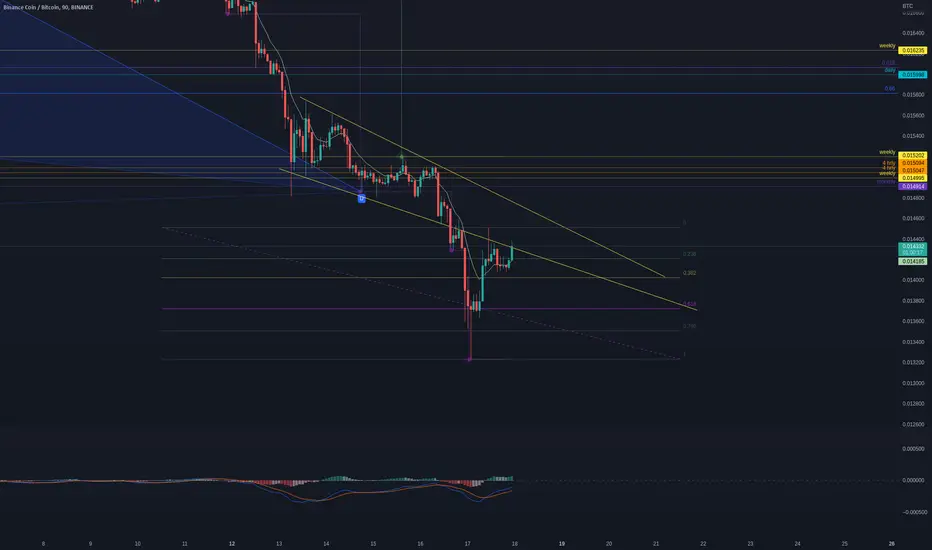
$BNB BEARISH FRACTAL (BNB/BTC)I think arbitrum, optimism, etc. will take a lot of BNB's dominance in terms of total crypto market capitalization. Also, with fud around BUSD and regulators seemingly targeting CZ / Binance, I expect Binance to underperform, though I think eventually when it is at a fairer value it may have another run. Coinbase also launching their own chain which means BSC/Binance has a lot more competition going forward. DeFi platforms like GMX also becoming much more mainstream which is yet another reason to be bearish imo.

BNBBTCHello Crypto Lovers,
Mars Signals team wishes you high profits.
This is a one-day-time frame analysis for BNBBTC
Here we have R2 and R1 as the resistance areas that express the price was not able to rise at different points. R3 used to be a support area. And S1 is a long-term support area in this chart containing the support of price even since the past. At the moment, we have the price fluctuating in S1 area in a rising trend and we expect it to resume its rise and reach R1. Then by having some rising signs there, we would wait for an increase. So if we receive some confirmation candles to rise, an increase would take place for the price to break R1 upward and even move toward R2 area in case it is supported and faces more fluctuation over R1. In case S1 area is lost, and the price is not supported at any point, more fall is predicted there for it to touch lower amounts. Please bear in mind to wait for some confirmation candles in order to make sure what will happen next and act precisely and well.
Warning: This is just a suggestion and we do not guarantee profits. We advise you to analyze the chart before opening any positions.
Wish you luck

BnbBtc Looks Pretty Solid For Breakout Seems like bnbbtc getting ready for another for breakout
Forming Falling Wedge In Daily Timeframe Incase Of Breakout Expecting 35 - 40% Bullish Move

BNBBTC - Fib Swing Low to Swing High Current probable reversal point BNBBTC, and possible breakout on BNBUSDT

Bnbbtc - possible flip resistance Flip resistance bnbbtc which could see a BNBUSDT rally. On mobile.

BNBUSDT [- Trend Trend via parallel channel. Make of it as you wish. Don't be emotional and remember cut your losses don't hold. Patience is Key. Focus on all charts. Look at BNBBCTC.. Focus :)

BNBBTC - Back in the Game? Clearly broke down on the falling wedge. A pullback, facing bottom of the wedge may bring BNBBTC back in the game! Looking good, see where this takes the price action. Nice pullback! Love it!
Binance coin (BNB) forming bullish Crab | A good buy opportunityHi friends, hope you are well and welcome to the new trade setup of Binance coin (BNB) with US Dollar pair.
Recently we caught more than 12% pump as below:
Now on a 4-hr time frame, BNB is about to complete a bullish Crab move for another bullish reversal move soon.
Note: Above idea is for educational purpose only. It is advised to diversify and strictly follow the stop loss, and don't get stuck with trade

"BNB Technical Analysis: Bullish Long-Term Trend & $2000 Target
According to the current market situation, BNB is being traded at approximately $300
and it has been fluctuating between $200-$300 for the past few months.
Looking at the weekly chart, $340 is a significant resistance level, and if the price falls below this level, there could be a further downtrend.
It is expected that BNB will reach a 0.5 Fib retracement level, which is around $160, but if the price fails to hold this level, the best opportunity to buy may be around $100.
A bull flag also forming in the high-time frame, indicating a bullish long-term trend, so it is recommended to accumulate #BNB for the long term.
The long-term target for BNB is $2000.
The support levels are $250 and $160, and the resistance level is $340.
This chart is for educational purposes only, and it is not financial advice.

BNB IS VERY BEARISH IN BIG TIME FRAMESHello, I hope you have been profitable and are doing well.
I checked the structure of the Binance Coin symbol and realized that the degree of correction is very large and can even last until the end of 2024.
What is clear to me is that we are now in wave D of this diametric. This wave is a diametric intermediate wave. It seems that we should have a correction for this symbol in at least 440 days.
I have no bias on any symbol and only analyze what the chart shows me.
Comment if you have any questions
I wish the best for you

Bnb Support and Resistance Area. going downBnb Support and Resistance Area. going down. A Big RISK. Fud will eat BUSD and Binance coin BNB

Binance coin (BNB) formed a bullish Gartley for upto 16.50% moveHi friends, hope you are well and welcome to the new trade setup of Binance coin (BNB) with US Dollar pair.
Previously we caught a very trade of BNB:
Now on a daily time frame, BNB has formed a bullish Gartley move for another price reversal.
Note: Above idea is for educational purpose only. It is advised to diversify and strictly follow the stop loss, and don't get stuck with trade

BNBUSDTBNB looks very interesting here, it's at a very crucial resistance. If we manage to break both of the resistances as shown in the chart it might do well.

BNB Bull Flag FormationWe're on the last leg down of the (E) wave. BNB is the coin of choice especially during bear markets and start of bull markets. More trading, more BNB staked to lower fees, more BNB bought. And it shows! I expect BNB to kiss the $300 level goodbye soon.
Well we're movin' on up
(Movin' on up)
To the east side
(Come on, movin' on up)
To a deluxe apartment in the sky
Movin' on up
(Movin' on up)
To the east side
(Come on, movin' on up)
We finally got a piece
Of the pie
Cheers!
Not Financial Advice. I'm just a monkey with a tradingview subscription.

The beginning of change to continue the mid- to long-term upwardHello?
Traders, welcome.
If you "Follow", you can always get new information quickly.
Please also click "Boost".
Have a nice day.
-------------------------------------
(BNBBTC 1W Chart)
It is losing momentum as it falls below the 0.013926-0.014115 range.
However, if the price is maintained above 0.009485, it can be said that it is maintaining an upward trend from a mid- to long-term perspective.
---------------------------------------
--------------------------------------
(BNBUSDT 1W Chart)
Strong support range: 179.2-243.5
Since the HA-High indicator is formed around 283.4, if the price is maintained above this point, it is highly likely to continue the mid- to long-term upward trend.
Therefore, whether it can rise above 332.4-353.3 is a key question.
The purple trend line is a trend line drawn on the 1M chart and indicates a long-term trend.
The long-term trend is looking to turn from down to up.
Therefore, as long as the price stays above 243.5 (and above 283.4 if possible) and does not fall below the downtrend line, we expect to establish a new long-term trend.
However, since the 1M chart's HA-High indicator is formed at 427.2, in order to continue the long-term uptrend, it must rise above 427.2 or shake up and down to make the 1M chart's HA-High indicator fall.
(1D chart)
The question is whether the price can hold above the +100 indicator, i.e. above 316.1.
The +100 indicator can be interpreted as the interpretation method for the +100 point of the CCI.
Therefore, if the price holds above the +100 indicator, it means that the short-term perspective has entered an uptrend.
In other words, you should be aware of volatility as it has entered the overbought zone.
The next period of volatility is around February 8th.
During this period of volatility, it is necessary to check whether the circle has broken through.
-------------------------------------------------- -------------------------------------------
** All descriptions are for reference only and do not guarantee profit or loss in investment.
** If you share this chart, you can use the indicators normally.
** The MRHAB-T indicator includes indicators that indicate points of support and resistance.
** Check the formulas for the MS-Signal, HA-Low, and HA-High indicators at ().
(Short-term Stop Loss can be said to be a point where profit or loss can be preserved or additional entry can be made by split trading. This is a short-term investment perspective.)
---------------------------------

BNB/USDT :: Breaking the resistance line .BNB/USDT :::
The price follows a slow upward trend and is currently reacting to the middle line of the channel, and if it can break the red resistance line, it will easily continue its path to the top of the channel .
<<<< The_Best_Trader_1991 >>>>

$BNB #BNB | LTF LONGEQ might be worked as a support level .
The bottom of the red box, liquidity zone and around 357.03 will be the points I will observe as resistance.
With the loss of 311.77 (1H) , the first bounce of the price will be around 305.21 .

BNB can continue to move upward until the next targetBNB, after breaking the support of the short-term uptrend line, the price hit the static support levels considered in the $282 range, and with a positive reaction to this area, the price increased again and tried to test the previous resistance break. The current resistance level is considered in the range of $317.8; if it is broken, the BNB can continue to move upward until the next target in the range of $353. Therefore, the current resistance of the short-term trend is very important. But if a negative reaction to this area is observed, and the support of the $292 range is broken again due to the range trend in the 4-hour timeframe, we can expect a test of the previous floor.

Bnbusdt long and shortMOMKENE
The live BNB price today is $304.72 USD with a 24-hour trading volume of $551,603,316 USD. We update our BNB to USD price in real-time. BNB is up 2.23% in the

Bnb Support and Resistance Area. A pure buying OpportunityBnb Support and Resistance Area. A pure Buying Opportunity
5 Resistance Areas

In the medium and long term, the 283.4 point is...Hello?
Traders, welcome.
If you "Follow", you can always get new information quickly.
Please also click "Boost".
Have a nice day.
-------------------------------------
(BNBBTC 1W chart)
If the price is maintained above the M-Signal on the 1M chart, it is expected to continue its upward trend from a long-term perspective.
Accordingly, it is important to keep the price above 0.013926-0.014115.
-------------------------------------
(BNBUSDT 1W Chart)
If it rises above 283.4 and maintains the price, it is likely to turn into an upward trend from a mid- to long-term investment perspective or long-term investment perspective.
Therefore, the 283.4 point is expected to be an important support and resistance point.
(1D chart)
It is expected to turn into a short-term uptrend by gaining support around 243.5 and rising.
In order to continue the short-term uptrend, it must rise above HA-High, so it is important whether the price can rise above 293.2 and sustain the price.
However, since an important support and resistance section is formed in the 297.5-316.1 section, it is expected that the upward trend will continue only when this section rises.
The movement in the period starting around January 10th and ending around January 22nd seems significant.
Therefore, the movements of the volatility period of January 9-11 should be observed.
-------------------------------------------------- -------------------------------------------
** All descriptions are for reference only and do not guarantee profit or loss in investment.
** If you share this chart, you can use the indicators normally.
** The MRHAB-T indicator includes indicators that indicate points of support and resistance.
** SR_R_C indicators are displayed as StochRSI (line), RSI (columns), and CCI (bgcolor).
** The CCI indicator is displayed in the overbought section (CCI > +100) and oversold section (CCI < -100).
(Short-term Stop Loss can be said to be a point where profit or loss can be preserved or additional entry can be made by split trading. This is a short-term investment perspective.)
---------------------------------

Breaking its symmetrical triangle patternBNB had a nice rally last week, breaking its symmetrical triangle pattern from above. The condition for breaking these resistances, which were considered in the range of 250-256 dollars, was that a strong bullish candle would cross these levels. Three days ago, these resistances were broken with a strong candle, and these ranges have now become strong support, which we can expect a positive reaction from these ranges if the price enters a corrective wave. BNB's short-term targets are in the $270-$280 range if the market remains in favorable conditions. The bottom line is that BNB is still bearish on the daily time frame, and the risk of a return to previous support remains. Price growth in the short term can only be bullish, and to stay bullish, the minimum resistance of the $280 range needs to be broken.
