BNB TIME TO BUY?Hello friends
Due to the change in structure and the entry of buyers and the breakdown of the downtrend, we can buy in steps within the specified ranges and move with it to the specified targets, of course with capital and risk management...
*Trade safely with us*
Bnbbtclong

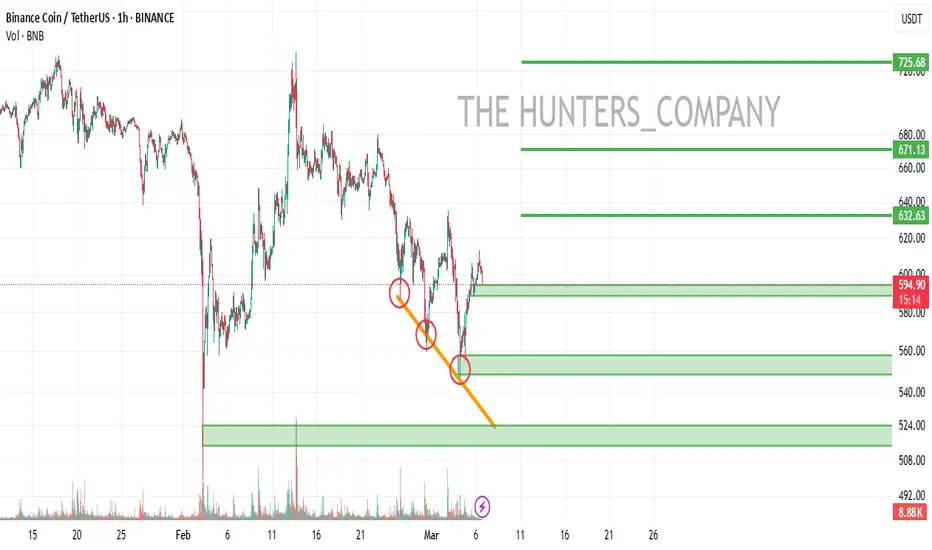
BNBUSDT | Key Support & Resistance Zones – Trade With PrecisionThe blue box that I gave as resistance 5 days ago gave 8% profit right from the blue box.
Now I think Red Lines has to should be carefully used for shorts.
🔹 %80 Daily Volume Spike – This means we are dealing with a highly active setup, making it one of the most crucial trades of the day. Smart traders focus on high-volume movers, and that’s exactly why we’re here.
Now, I still stand by my analysis and expect the lower blue box below to act as strong support.
🔴 Short Scenario (Red Line Rejections):
✔️ If price rejects from the red lines with LTF breakdowns, I will look for short opportunities.
✔️ CDV & Volume Footprint Confirmations – We need sellers to step in aggressively before considering entries.
✔️ The market respects precision, not emotions. No confirmation = no trade.
🟢 Long Scenario (Regaining Red Lines):
✔️ If price breaks above the red lines with strong volume and successfully retests them as support, I will switch to a long bias.
✔️ LTF Confirmations Are Key – Without a proper reclaim, there’s no reason to rush longs.
Why My Levels Matter
This isn’t just a random setup—my levels are based on deep market insights that most traders don't even understand. That’s why my success rate speaks for itself.
The market is not a guessing game—it’s a battlefield where only the well-prepared win. I provide the roadmap, it’s up to you to execute.
📌I keep my charts clean and simple because I believe clarity leads to better decisions.
📌My approach is built on years of experience and a solid track record. I don’t claim to know it all but I’m confident in my ability to spot high-probability setups.
📌If you would like to learn how to use the heatmap, cumulative volume delta and volume footprint techniques that I use below to determine very accurate demand regions, you can send me a private message. I help anyone who wants it completely free of charge.
🔑I have a long list of my proven technique below:
🎯 ZENUSDT.P: Patience & Profitability | %230 Reaction from the Sniper Entry
🐶 DOGEUSDT.P: Next Move
🎨 RENDERUSDT.P: Opportunity of the Month
💎 ETHUSDT.P: Where to Retrace
🟢 BNBUSDT.P: Potential Surge
📊 BTC Dominance: Reaction Zone
🌊 WAVESUSDT.P: Demand Zone Potential
🟣 UNIUSDT.P: Long-Term Trade
🔵 XRPUSDT.P: Entry Zones
🔗 LINKUSDT.P: Follow The River
📈 BTCUSDT.P: Two Key Demand Zones
🟩 POLUSDT: Bullish Momentum
🌟 PENDLEUSDT.P: Where Opportunity Meets Precision
🔥 BTCUSDT.P: Liquidation of Highly Leveraged Longs
🌊 SOLUSDT.P: SOL's Dip - Your Opportunity
🐸 1000PEPEUSDT.P: Prime Bounce Zone Unlocked
🚀 ETHUSDT.P: Set to Explode - Don't Miss This Game Changer
🤖 IQUSDT: Smart Plan
⚡️ PONDUSDT: A Trade Not Taken Is Better Than a Losing One
💼 STMXUSDT: 2 Buying Areas
🐢 TURBOUSDT: Buy Zones and Buyer Presence
🌍 ICPUSDT.P: Massive Upside Potential | Check the Trade Update For Seeing Results
🟠 IDEXUSDT: Spot Buy Area | %26 Profit if You Trade with MSB
📌 USUALUSDT: Buyers Are Active + %70 Profit in Total
🌟 FORTHUSDT: Sniper Entry +%26 Reaction
🐳 QKCUSDT: Sniper Entry +%57 Reaction
📊 BTC.D: Retest of Key Area Highly Likely
📊 XNOUSDT %80 Reaction with a Simple Blue Box!
📊 BELUSDT Amazing %120 Reaction!
I stopped adding to the list because it's kinda tiring to add 5-10 charts in every move but you can check my profile and see that it goes on..

BNB/USDT UPDAEHello friends
With the price drop, we now see that the sellers are gradually failing and the buyers have succeeded in supporting the price.
Now we can buy in stages and with capital management and move towards the specified goals.
*Trade safely with us*
#BNB/USDT#BNB
The price is moving within a descending channel on the 1-hour frame, adhering well to it, and is heading for a strong breakout and retest.
We are seeing a bounce from the lower boundary of the descending channel, which is support at 517.
We have a downtrend on the RSI indicator that is about to be broken and retested, supporting the upward trend.
We are looking for stability above the 100 moving average.
Entry price: 558
First target: 573
Second target: 591
Third target: 614

BNB/BTC : BNB Ready to Outperform Bitcoin?"Analyzing the BNBBTC weekly timeframe and the current market structure, I anticipate that BNB will outperform Bitcoin by a factor of two. In other words, if Bitcoin rallies 50%, we could see BNB doubling in value. Do you think BNB is positioned to reach $1,000?"
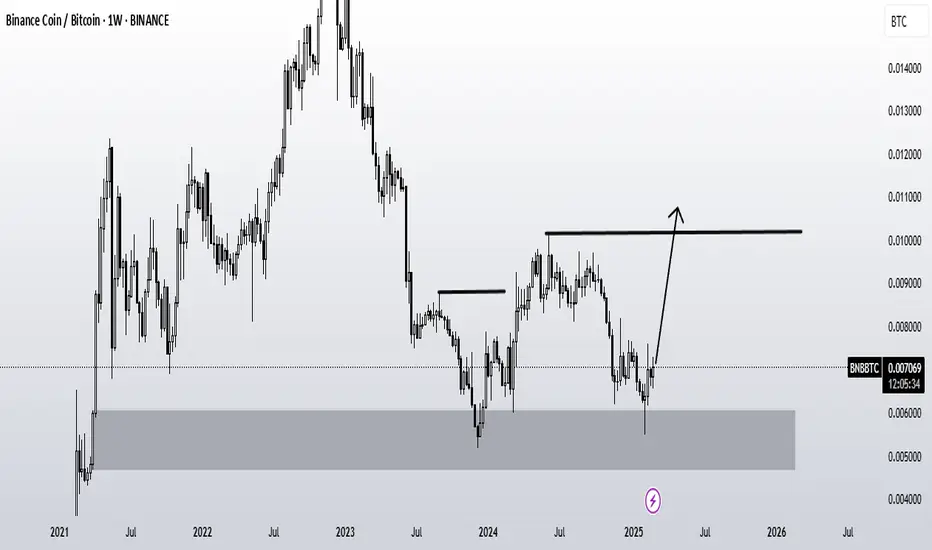
BNB's Potential Surge: CZ's Release and Buyer Zone AnticipationThe recent developments surrounding CZ's release have sparked optimism across the market, potentially fueling a rise in BNB’s value. As seen in the chart, we are currently monitoring a key buyer zone (marked by the green box), which has been identified as a significant area of interest. If price action confirms this level, it could provide a strong entry point for buyers, aligning with the positive market sentiment following CZ's return.

BNB: analaysis in D1📊Analysis by AhmadArz:
According to the flag pattern that we saw the best reactions in the past, we can expect the same analysis from the chart at this time.🧨
Just keep in mind that there is a 10% chance of a fake breakout on each side of this horizontal trend.🚨
🔗"Uncover new opportunities in the world of cryptocurrencies with AhmadArz.
💡Join us on TradingView and expand your investment knowledge with our five years of experience in financial markets."
🚀Please boost and💬 comment to share your thoughts with us!

#BNB BREAKOUT THIS BULLISH PENNANT PATTERN!#BNB retests the bullish pennant pattern. If we successfully retest this pattern, then we can expect a good bounce.
#Crypto

BNB: buy in middle renge📊Analysis by AhmadArz:
🔍Entry: 535.7
🛑Stop Loss: 519.7
🎯Take Profit: 548.9 -569.8
🔗"Uncover new opportunities in the world of cryptocurrencies with AhmadArz.
💡Join us on TradingView and expand your investment knowledge with our five years of experience in financial markets."
🚀Please boost and💬 comment to share your thoughts with us!

BNB/BTC - BNB: Trend Reversal◳◱ On the $BNB/ CRYPTOCAP:BTC chart, the Trend Reversal pattern suggests indications that the trend may be gaining or losing strength. Traders might observe resistance around 0.009008 | 0.009394 | 0.010214 and support near 0.008188 | 0.007754 | 0.006934. Entering trades at 0.008714 could be strategic, aiming for the next resistance level.
◰◲ General info :
▣ Name: BNB
▣ Rank: 4
▣ Exchanges: Binance, Kucoin, Gateio, Hitbtc
▣ Category/Sector: Financial - Smart Contract Platforms
▣ Overview: Binance Coin is digital asset native to the Binance blockchain and launched by the Binance online exchange.
◰◲ Technical Metrics :
▣ Mrkt Price: 0.008714 ₿
▣ 24HVol: 486.574 ₿
▣ 24H Chng: 0.542%
▣ 7-Days Chng: -6.78%
▣ 1-Month Chng: -0.26%
▣ 3-Months Chng: 75.21%
◲◰ Pivot Points - Levels :
◥ Resistance: 0.009008 | 0.009394 | 0.010214
◢ Support: 0.008188 | 0.007754 | 0.006934
◱◳ Indicators recommendation :
▣ Oscillators: NEUTRAL
▣ Moving Averages: STRONG_BUY
◰◲ Technical Indicators Summary : BUY
◲◰ Sharpe Ratios :
▣ Last 30D: 0.12
▣ Last 90D: 3.36
▣ Last 1-Y: 1.02
▣ Last 3-Y: 0.42
◲◰ Volatility :
▣ Last 30D: 0.69
▣ Last 90D: 0.74
▣ Last 1-Y: 0.53
▣ Last 3-Y: 0.77
◳◰ Market Sentiment Index :
▣ News sentiment score is 0.73 - Bullish
▣ Twitter sentiment score is 0.58 - Bullish
▣ Reddit sentiment score is 0.53 - Bullish
▣ In-depth BNBBTC technical analysis on Tradingview TA page
▣ What do you think of this analysis? Share your insights and let's discuss in the comments below. Your like, follow and support would be greatly appreciated!
◲ Disclaimer
Please note that the information and publications provided are for informational purposes only and should not be construed as financial, investment, trading, or any other type of advice or recommendation. We encourage you to conduct your own research and consult with a qualified professional before making any financial decisions. The use of the information provided is solely at your own risk.
▣ Welcome to the home of charting big: TradingView
Benefit from a ton of financial analysis features, instruments and data. Have a look around, and if you do choose to go with an upgraded plan, you'll get up to $30.
Discover it here - affiliate link -

BNB/BTC - BNB: Super Trend◳◱ On the $BNB/ CRYPTOCAP:BTC chart, the Super Trend pattern suggests a pause in volatility, potentially gearing up for a breakout. Traders might observe resistance around 0.008778 | 0.009141 | 0.009767 and support near 0.008152 | 0.007889 | 0.007263. Entering trades at 0.008612 could be strategic, aiming for the next resistance level.
◰◲ General info :
▣ Name: BNB
▣ Rank: 6
▣ Exchanges: Binance, Kucoin, Gateio, Hitbtc
▣ Category/Sector: Financial - Smart Contract Platforms
▣ Overview: Binance Coin is digital asset native to the Binance blockchain and launched by the Binance online exchange.
◰◲ Technical Metrics :
▣ Mrkt Price: 0.008612 ₿
▣ 24HVol: 556.270 ₿
▣ 24H Chng: -0.875%
▣ 7-Days Chng: 2.96%
▣ 1-Month Chng: 12.16%
▣ 3-Months Chng: 103.23%
◲◰ Pivot Points - Levels :
◥ Resistance: 0.008778 | 0.009141 | 0.009767
◢ Support: 0.008152 | 0.007889 | 0.007263
◱◳ Indicators recommendation :
▣ Oscillators: BUY
▣ Moving Averages: STRONG_BUY
◰◲ Technical Indicators Summary : STRONG_BUY
◲◰ Sharpe Ratios :
▣ Last 30D: 2.06
▣ Last 90D: 4.05
▣ Last 1-Y: 1.34
▣ Last 3-Y: 0.47
◲◰ Volatility :
▣ Last 30D: 0.93
▣ Last 90D: 0.72
▣ Last 1-Y: 0.53
▣ Last 3-Y: 0.78
◳◰ Market Sentiment Index :
▣ News sentiment score is 0.79 - V. Bullish
▣ Twitter sentiment score is 0.58 - Bullish
▣ Reddit sentiment score is 0.70 - Bullish
▣ In-depth BNBBTC technical analysis on Tradingview TA page
▣ What do you think of this analysis? Share your insights and let's discuss in the comments below. Your like, follow and support would be greatly appreciated!
◲ Disclaimer
Please note that the information and publications provided are for informational purposes only and should not be construed as financial, investment, trading, or any other type of advice or recommendation. We encourage you to conduct your own research and consult with a qualified professional before making any financial decisions. The use of the information provided is solely at your own risk.
▣ Welcome to the home of charting big: TradingView
Benefit from a ton of financial analysis features, instruments and data. Have a look around, and if you do choose to go with an upgraded plan, you'll get up to $30.
Discover it here - affiliate link -

BNB/BTC - BNB: Trend Reversal◳◱ On the $BNB/ CRYPTOCAP:BTC chart, the Trend Reversal pattern suggests indications that the trend may be gaining or losing strength. Traders might observe resistance around 0.008869 | 0.009226 | 0.009943 and support near 0.008152 | 0.007792 | 0.007075. Entering trades at 0.008422 could be strategic, aiming for the next resistance level.
◰◲ General info :
▣ Name: BNB
▣ Rank: 5
▣ Exchanges: Binance, Kucoin, Gateio, Hitbtc
▣ Category/Sector: Financial - Smart Contract Platforms
▣ Overview: Binance Coin is digital asset native to the Binance blockchain and launched by the Binance online exchange.
◰◲ Technical Metrics :
▣ Mrkt Price: 0.008422 ₿
▣ 24HVol: 346.613 ₿
▣ 24H Chng: -1.933%
▣ 7-Days Chng: -0.14%
▣ 1-Month Chng: 42.62%
▣ 3-Months Chng: 87.78%
◲◰ Pivot Points - Levels :
◥ Resistance: 0.008869 | 0.009226 | 0.009943
◢ Support: 0.008152 | 0.007792 | 0.007075
◱◳ Indicators recommendation :
▣ Oscillators: SELL
▣ Moving Averages: SELL
◰◲ Technical Indicators Summary : SELL
◲◰ Sharpe Ratios :
▣ Last 30D: 5.16
▣ Last 90D: 4.00
▣ Last 1-Y: 1.36
▣ Last 3-Y: 0.66
◲◰ Volatility :
▣ Last 30D: 1.03
▣ Last 90D: 0.71
▣ Last 1-Y: 0.52
▣ Last 3-Y: 0.79
◳◰ Market Sentiment Index :
▣ News sentiment score is N/A
▣ Twitter sentiment score is 0.58 - Bullish
▣ Reddit sentiment score is 0.95 - V. Bullish
▣ In-depth BNBBTC technical analysis on Tradingview TA page
▣ What do you think of this analysis? Share your insights and let's discuss in the comments below. Your like, follow and support would be greatly appreciated!
◲ Disclaimer
Please note that the information and publications provided are for informational purposes only and should not be construed as financial, investment, trading, or any other type of advice or recommendation. We encourage you to conduct your own research and consult with a qualified professional before making any financial decisions. The use of the information provided is solely at your own risk.
▣ Welcome to the home of charting big: TradingView
Benefit from a ton of financial analysis features, instruments and data. Have a look around, and if you do choose to go with an upgraded plan, you'll get up to $30.
Discover it here - affiliate link -

BNB/BTC - BNB: BBand Breakout◳◱ On the $BNB/ CRYPTOCAP:BTC chart, the Bband Breakout pattern suggests a consolidation phase that could precede a trend continuation or reversal. Traders might observe resistance around 0.007471 | 0.008373 | 0.009799 and support near 0.006045 | 0.005521 | 0.004095. Entering trades at 0.006758 could be strategic, aiming for the next resistance level.
◰◲ General info :
▣ Name: BNB
▣ Rank: 5
▣ Exchanges: Binance, Kucoin, Gateio, Hitbtc
▣ Category/Sector: Financial - Smart Contract Platforms
▣ Overview: Binance Coin is digital asset native to the Binance blockchain and launched by the Binance online exchange.
◰◲ Technical Metrics :
▣ Mrkt Price: 0.006758 ₿
▣ 24HVol: 484.938 ₿
▣ 24H Chng: 7.338%
▣ 7-Days Chng: 14.59%
▣ 1-Month Chng: 51.24%
▣ 3-Months Chng: 91.56%
◲◰ Pivot Points - Levels :
◥ Resistance: 0.007471 | 0.008373 | 0.009799
◢ Support: 0.006045 | 0.005521 | 0.004095
◱◳ Indicators recommendation :
▣ Oscillators: NEUTRAL
▣ Moving Averages: STRONG_BUY
◰◲ Technical Indicators Summary : BUY
◲◰ Sharpe Ratios :
▣ Last 30D: 8.06
▣ Last 90D: 4.83
▣ Last 1-Y: 0.98
▣ Last 3-Y: 0.63
◲◰ Volatility :
▣ Last 30D: 0.56
▣ Last 90D: 0.54
▣ Last 1-Y: 0.46
▣ Last 3-Y: 0.79
◳◰ Market Sentiment Index :
▣ News sentiment score is N/A
▣ Twitter sentiment score is 0.58 - Bullish
▣ Reddit sentiment score is 0.95 - V. Bullish
▣ In-depth BNBBTC technical analysis on Tradingview TA page
▣ What do you think of this analysis? Share your insights and let's discuss in the comments below. Your like, follow and support would be greatly appreciated!
◲ Disclaimer
Please note that the information and publications provided are for informational purposes only and should not be construed as financial, investment, trading, or any other type of advice or recommendation. We encourage you to conduct your own research and consult with a qualified professional before making any financial decisions. The use of the information provided is solely at your own risk.
▣ Welcome to the home of charting big: TradingView
Benefit from a ton of financial analysis features, instruments and data. Have a look around, and if you do choose to go with an upgraded plan, you'll get up to $30.
Discover it here - affiliate link -

BNB/BTC - BNB: BBand Breakout◳◱ On the $BNB/ CRYPTOCAP:BTC chart, the Bband Breakout pattern suggests an upcoming trend shift. Traders might observe resistance around 0.007471 | 0.008373 | 0.009799 and support near 0.006045 | 0.005521 | 0.004095. Entering trades at 0.006764 could be strategic, aiming for the next resistance level.
◰◲ General info :
▣ Name: BNB
▣ Rank: 5
▣ Exchanges: Binance, Kucoin, Gateio, Hitbtc
▣ Category/Sector: Financial - Smart Contract Platforms
▣ Overview: Binance Coin is digital asset native to the Binance blockchain and launched by the Binance online exchange.
◰◲ Technical Metrics :
▣ Mrkt Price: 0.006764 ₿
▣ 24HVol: 484.147 ₿
▣ 24H Chng: 7.45%
▣ 7-Days Chng: 14.59%
▣ 1-Month Chng: 51.24%
▣ 3-Months Chng: 91.56%
◲◰ Pivot Points - Levels :
◥ Resistance: 0.007471 | 0.008373 | 0.009799
◢ Support: 0.006045 | 0.005521 | 0.004095
◱◳ Indicators recommendation :
▣ Oscillators: NEUTRAL
▣ Moving Averages: STRONG_BUY
◰◲ Technical Indicators Summary : BUY
◲◰ Sharpe Ratios :
▣ Last 30D: 8.06
▣ Last 90D: 4.83
▣ Last 1-Y: 0.98
▣ Last 3-Y: 0.63
◲◰ Volatility :
▣ Last 30D: 0.56
▣ Last 90D: 0.54
▣ Last 1-Y: 0.46
▣ Last 3-Y: 0.79
◳◰ Market Sentiment Index :
▣ News sentiment score is N/A
▣ Twitter sentiment score is 0.58 - Bullish
▣ Reddit sentiment score is 0.95 - V. Bullish
▣ In-depth BNBBTC technical analysis on Tradingview TA page
▣ What do you think of this analysis? Share your insights and let's discuss in the comments below. Your like, follow and support would be greatly appreciated!
◲ Disclaimer
Please note that the information and publications provided are for informational purposes only and should not be construed as financial, investment, trading, or any other type of advice or recommendation. We encourage you to conduct your own research and consult with a qualified professional before making any financial decisions. The use of the information provided is solely at your own risk.
▣ Welcome to the home of charting big: TradingView
Benefit from a ton of financial analysis features, instruments and data. Have a look around, and if you do choose to go with an upgraded plan, you'll get up to $30.
Discover it here - affiliate link -

BNB Want to run higherBinance Coin is for sure in a good momentum and the trend is strongly bullish. I expect a continuation of the bullish trend till the resistance level at 414 where i will look for a short entry. The first resistance level is 390, my main ideas is not to long now but to wait for a short

#BNB/USDT LONG#BNB
The price has been moving in a bear flag since May 2022
We have a strong support area from which the price bounced, 203.60
We're about to go up
This rise is supported by the moving average breaking 100
And break the downtrend
The price now is 232.40
First goal 327.5 0
Second goal: 387.50

BNB/BTC - BNB: Falling Wedge◳◱ On the $BNB/ CRYPTOCAP:BTC chart, the Falling Wedge pattern suggests a pause in volatility, potentially gearing up for a breakout. Traders might observe resistance around 0.007025 | 0.007864 | 0.009155 and support near 0.005734 | 0.005282 | 0.003991. Entering trades at 0.005867 could be strategic, aiming for the next resistance level.
◰◲ General info :
▣ Name: BNB
▣ Rank: 4
▣ Exchanges: Binance, Kucoin, Gateio, Hitbtc
▣ Category/Sector: Financial - Smart Contract Platforms
▣ Overview: Binance Coin is digital asset native to the Binance blockchain and launched by the Binance online exchange.
◰◲ Technical Metrics :
▣ Mrkt Price: 0.005867 ₿
▣ 24HVol: 167.243 ₿
▣ 24H Chng: -0.34%
▣ 7-Days Chng: -3.04%
▣ 1-Month Chng: -1.93%
▣ 3-Months Chng: 6.11%
◲◰ Pivot Points - Levels :
◥ Resistance: 0.007025 | 0.007864 | 0.009155
◢ Support: 0.005734 | 0.005282 | 0.003991
◱◳ Indicators recommendation :
▣ Oscillators: BUY
▣ Moving Averages: STRONG_SELL
◰◲ Technical Indicators Summary : SELL
◲◰ Sharpe Ratios :
▣ Last 30D: 0.05
▣ Last 90D: 0.59
▣ Last 1-Y: -0.53
▣ Last 3-Y: 1.14
◲◰ Volatility :
▣ Last 30D: 0.56
▣ Last 90D: 0.38
▣ Last 1-Y: 0.44
▣ Last 3-Y: 1.00
◳◰ Market Sentiment Index :
▣ News sentiment score is N/A
▣ Twitter sentiment score is 0.58 - Bullish
▣ Reddit sentiment score is 0.50 - Bearish
▣ In-depth BNBBTC technical analysis on Tradingview TA page
▣ What do you think of this analysis? Share your insights and let's discuss in the comments below. Your like, follow and support would be greatly appreciated!
◲ Disclaimer
Please note that the information and publications provided are for informational purposes only and should not be construed as financial, investment, trading, or any other type of advice or recommendation. We encourage you to conduct your own research and consult with a qualified professional before making any financial decisions. The use of the information provided is solely at your own risk.
▣ Welcome to the home of charting big: TradingView
Benefit from a ton of financial analysis features, instruments and data. Have a look around, and if you do choose to go with an upgraded plan, you'll get up to $30.
Discover it here - affiliate link -

💡Don't miss the great buy opportunity in BNBUSDTAs BNB flirts with a significant resistance trendline, the anticipation of a breakout builds. A decisive close above this level could ignite a rally towards Fibonacci extension levels of 1.272 and 1.414, correlating to a price target around $1200—representing a fivefold gain from the current position. Given Binance's stature as the 'father of the crypto market,' it's plausible to expect a vested interest in bolstering the value of its native coin. Investors should monitor this pivotal movement, as BNB's ascendancy could be a testament to Binance's influence in the crypto ecosystem.
My rigorous and detailed analyses of BNB, visible at my TradingView profile, have historically captured the pulse of its market movements, proving to be successful time and again. With Binance's dominant market role, BNB is on the brink of a potential quintuple surge, as it approaches a pivotal breakout point. My extensive research and careful market scrutiny suggest a strong upside, especially with Binance's vested interest in enhancing the value of its flagship coin.

BNB/BTC - BNB: Resistance_Breakout◳◱ A Resistance Breakout has been identified on the CRYPTOCAP:BNB / CRYPTOCAP:BTC chart. The price has broken above a key resistance level, indicating a potential bullish trend. The next resistance key levels are located at 0.008362 | 0.008528 | 0.008825, and the major support zones can be found at 0.008065 | 0.007934 | 0.007637. Consider entering at the current price zone of 0.008343 and targeting higher levels.
◰◲ General info :
▣ Name: BNB
▣ Rank: 4
▣ Exchanges: Binance, Kucoin, Gateio, Hitbtc
▣ Category/Sector: Financial - Smart Contract Platforms
▣ Overview: Binance Coin is digital asset native to the Binance blockchain and launched by the Binance online exchange.
◰◲ Technical Metrics :
▣ Mrkt Price: 0.008343 ₿
▣ 24HVol: 207.150 ₿
▣ 24H Chng: 0.0%
▣ 7-Days Chng: -8.81%
▣ 1-Month Chng: -9.80%
▣ 3-Months Chng: -28.55%
◲◰ Pivot Points - Levels :
◥ Resistance: 0.008362 | 0.008528 | 0.008825
◢ Support: 0.008065 | 0.007934 | 0.007637
◱◳ Indicators recommendation :
▣ Oscillators: BUY
▣ Moving Averages: STRONG_BUY
◰◲ Technical Indicators Summary : STRONG_BUY
◲◰ Sharpe Ratios :
▣ Last 30D: -4.80
▣ Last 90D: -3.11
▣ Last 1-Y: -0.38
▣ Last 3-Y: 1.21
◲◰ Volatility :
▣ Last 30D: 0.28
▣ Last 90D: 0.45
▣ Last 1-Y: 0.54
▣ Last 3-Y: 1.03
◳◰ Market Sentiment Index :
▣ News sentiment score is 0.41 - Bearish
▣ Twitter sentiment score is 0.58 - Bullish
▣ Reddit sentiment score is 0.39 - Bearish
▣ In-depth BNBBTC technical analysis on Tradingview TA page
▣ What do you think of this analysis? Share your insights and let's discuss in the comments below. Your like, follow and support would be greatly appreciated!
◲ Disclaimer
Please note that the information and publications provided are for informational purposes only and should not be construed as financial, investment, trading, or any other type of advice or recommendation. We encourage you to conduct your own research and consult with a qualified professional before making any financial decisions. The use of the information provided is solely at your own risk.
▣ Welcome to the home of charting big: TradingView
Benefit from a ton of financial analysis features, instruments and data. Have a look around, and if you do choose to go with an upgraded plan, you'll get up to $30.
Discover it here - affiliate link -

BNB/BTC - BNB: Resistance_Breakout◳◱ A Resistance Breakout has been identified on the CRYPTOCAP:BNB / MIL:BTC chart. The price has broken above a key resistance level, indicating a potential bullish trend. The next resistance key levels are located at 0.008203 | 0.008346 | 0.008612, and the major support zones can be found at 0.007937 | 0.007814 | 0.007548. Consider entering at the current price zone of 0.008272 and targeting higher levels.
◰◲ General info :
▣ Name: BNB
▣ Rank: 5
▣ Exchanges: Binance, Kucoin, Gateio, Hitbtc
▣ Category/Sector: Financial - Smart Contract Platforms
▣ Overview: Binance Coin is digital asset native to the Binance blockchain and launched by the Binance online exchange.
◰◲ Technical Metrics :
▣ Mrkt Price: 0.008272 ₿
▣ 24HVol: 202.604 ₿
▣ 24H Chng: 0.498%
▣ 7-Days Chng: -1.23%
▣ 1-Month Chng: 4.45%
▣ 3-Months Chng: -25.24%
◲◰ Pivot Points - Levels :
◥ Resistance: 0.008203 | 0.008346 | 0.008612
◢ Support: 0.007937 | 0.007814 | 0.007548
◱◳ Indicators recommendation :
▣ Oscillators: BUY
▣ Moving Averages: STRONG_BUY
◰◲ Technical Indicators Summary : STRONG_BUY
◲◰ Sharpe Ratios :
▣ Last 30D: 0.55
▣ Last 90D: -2.48
▣ Last 1-Y: 0.01
▣ Last 3-Y: 1.29
◲◰ Volatility :
▣ Last 30D: 0.40
▣ Last 90D: 0.45
▣ Last 1-Y: 0.54
▣ Last 3-Y: 1.03
◳◰ Market Sentiment Index :
▣ News sentiment score is 0.34 - Bearish
▣ Twitter sentiment score is 0.58 - Bullish
▣ Reddit sentiment score is 0.53 - Bullish
▣ In-depth BNBBTC technical analysis on Tradingview TA page
▣ What do you think of this analysis? Share your insights and let's discuss in the comments below. Your like, follow and support would be greatly appreciated!
◲ Disclaimer
Please note that the information and publications provided are for informational purposes only and should not be construed as financial, investment, trading, or any other type of advice or recommendation. We encourage you to conduct your own research and consult with a qualified professional before making any financial decisions. The use of the information provided is solely at your own risk.
▣ Welcome to the home of charting big: TradingView
Benefit from a ton of financial analysis features, instruments and data. Have a look around, and if you do choose to go with an upgraded plan, you'll get up to $30.
Discover it here - affiliate link -

BNB short currently sideways BNB, BNB could hit $448.23 in 2023
BNB’s price prediction for the most bearish scenario will value BNB at $194.61 in 2023
BNB’s previous All Time High was on 10th May 2021 where BNB was priced at $686.31
BNB’s price at the same time last week was $231.07. It has moved by 0.77% in the past week and is currently at $243.26. Infact, in the past 24 hours, BNB has pumped by 0.32%. There is a slight bearish sentiment in the crypto market. The long term sentiment, however, remains bullish and BNB could hit $475.81 in 2024.
The total circulating supply of BNB as of writing this article was $155,855,196 and the marketcap of BNB remains at $37,914,395,267.
However, Binance’s legal battle isn’t over just yet. The US SEC is seeking restraining orders to freeze Binance’s assets. Although the exchange has asked the court to deny the restraining order, the ongoing showdown could further affect BNB’s value.
The weekly timeframe chart showed that BNB’s plunge has hit June/December 2022 lows. During the December 2022 FUD (fear, uncertainty, and disinformation) around Binance’s proof of reserves, BNB tanked to $220.
The $220 level aligns with a bullish order block (OB) of $206 – $243 (cyan) on the weekly chart formed on 27 June 2022. In addition, it coincides with the range low of a parallel channel (blue) and the 200-MA (Moving Average).
So, it could make the $206 – $243 zone (cyan) a strong bullish stronghold. Unfortunately, it could crack if Binance’s legal woes worsen in the next coming days/weeks. A drop below the confluence area could ease at $184 or $118.
Conversely, BNB could attempt to reverse the losses and target the mid-range ($293) if the demand zone doesn’t crack. The level also aligns with the 50-MA.
In the meantime, the RSI (Relative Strength Index) flattened in the lower range – suggesting selling pressure eased. Similarly, the CMF (Chaikin Money Flow) moved sideways slightly above the zero mark – denoting capital outflows from BNB subsidized.
A break above 359 and creating bullish pa HH and HL is the start of a bullish trend

BNBUSDT#BNBUSDT
#BNBUSDT in daily chart time-frame we have very important and strong support zone buy and hold it to the next targets at the chart i expect there will be a correction move RSI showing bullish EMAs showing a bullish move MACD is showing bullish Ichimoku cloud is neutral ZELMA is showing uptrend-moveA Accumulation distribution is bullish Fib retracement is neutral i expect the price will fly to the target at the chart

BNB/BTC - BNB: Super_Trend◳◱ We've detected a Super Trend pattern on the CRYPTOCAP:BNB / CRYPTOCAP:BTC chart. The Super Trend indicator is showing a bullish trend, indicating a potential trend reversal. The next resistance key levels are at 0.011868 | 0.012264 | 0.013324 and the major support zones are respectively at 0.010808 | 0.010144 | 0.009084. We may consider opening a trade position at the current price zone at 0.011703 and benefit from the trend continuation.
◰◲ General info :
▣ Name: BNB
▣ Rank: 4
▣ Exchanges: Binance, Kucoin, Gateio, Hitbtc
▣ Category/Sector: Financial - Smart Contract Platforms
▣ Overview: Binance Coin is digital asset native to the Binance blockchain and launched by the Binance online exchange.
◰◲ Technical Metrics :
▣ Mrkt Price: 0.011703 ₿
▣ 24HVol: 678.958 ₿
▣ 24H Chng: 3.585%
▣ 7-Days Chng: -0.43%
▣ 1-Month Chng: 1.84%
▣ 3-Months Chng: 9.58%
◲◰ Pivot Points - Levels :
◥ Resistance: 0.011868 | 0.012264 | 0.013324
◢ Support: 0.010808 | 0.010144 | 0.009084
◱◳ Indicators recommendation :
▣ Oscillators: SELL
▣ Moving Averages: STRONG_BUY
◰◲ Technical Indicators Summary : BUY
◲◰ Sharpe Ratios :
▣ Last 30D: -0.49
▣ Last 90D: 1.06
▣ Last 1-Y: -0.07
▣ Last 3-Y: 1.45
◲◰ Volatility :
▣ Last 30D: 0.41
▣ Last 90D: 0.47
▣ Last 1-Y: 0.67
▣ Last 3-Y: 1.03
◳◰ Market Sentiment Index :
▣ News sentiment score is N/A
▣ Twitter sentiment score is 0.58 - Bullish
▣ Reddit sentiment score is 0.88 - V. Bullish
▣ In-depth BNBBTC technical analysis on Tradingview TA page
▣ What do you think of this analysis? Share your insights and let's discuss in the comments below. Your like, follow and support would be greatly appreciated!
◲ Disclaimer
Please note that the information and publications provided are for informational purposes only and should not be construed as financial, investment, trading, or any other type of advice or recommendation. We encourage you to conduct your own research and consult with a qualified professional before making any financial decisions. The use of the information provided is solely at your own risk.
▣ Welcome to the home of charting big: TradingView
Benefit from a ton of financial analysis features, instruments and data. Have a look around, and if you do choose to go with an upgraded plan, you'll get up to $30.
Discover it here - affiliate link -
