$BNB possible scenarioFractal and possible scenario for $BNB, if $BTC & $ETH behaves i'll be looking foward to add big on next dip. Watch out BNB/BTC & BNB/ETH pairs.
Bnblong


BINANCE (BNB) BUY/LONG OPPORTUNITY NOW READYTICKER CODE: BNBUSD
Company Name: Binance
Industry: Blockchain & Cryptocurrency
Technical Analysis
1. Pennant Pattern
2. Pennant Breakout (Upwards and retraced)
3. Fibonacci Retracement at 0.618 (Golden Zone)
4. Fibonacci Expansion Safe Take Profit Level 1 (Grey Zone) Also the length of Flagpole
5. Binance current near the Oversold Level in RSI


BNB 400$ TARGETHi guys,
as some asked me, here my thought on BNB.
Binance supremacy is far away from collapsing.
The target is 1st fibonacci level, but actually I stay on my long-term prediction on BNB that was 1000$ before end on 2021.

BNB skyrockets to record highs while $1,000 beckons
Binance Coin Price Analysis: BNB skyrockets to record highs as $1,000 beckons
Binance Coin rallies to hit a significant milestone at $638 amid the bulls' push for gains past
$1,000.
The MACD adds credence to the bullish outlook despite resistance at $600.
Binance Coin has quickly become the darling of the cryptocurrency market. In addition to making a significant spike to $638, a new all-time high, the token's market cap almost hit $90 billion. BNB still sits in the third position on the market after Ethereum.
Binance Coin bulls battle to secure higher support
The exchange-based token teeters at $577 at the time of writing. This follows a minor correction from the newly traded record highs. Support above $600 became an uphill task, but currently, buyers are focused on established support at $550.
The short-term analysis shows that Binance Coin is in the bulls' hands despite the recent correction. This bullish narrative has been reinforced by the Moving Average Convergence Divergence (MACD). The indicator is not only in the positive region but also in a bullish impulse. For instance, the MACD line (blue) has sustained the signal line's positive divergence since the weekend session.
Closing the day above $570 and, by extension, $550 will ensure market stability. Here, buyers will build upon the support for gains toward $1,000. Immense buy orders will be triggered once Binance Coin slices through the hurdle at $600 and $638, respectively.
It is worth mentioning that a correction will come into play if the support at $550 gives in. Sell orders may be triggered, adding pressure to the bearish outlook. Subtle support has been envisaged at $500, but the primary anchor holds $450.
Binance Coin intraday levels
Spot rate: $577
Trend: Bearish
Volatility: Low
Support: $5050 and $450
Resistance: $600 and $638

BNB still has gas to the next targetsAfter BNB smoked our previous targets, now we can reveal the next targets on the chart...
BNB is still in an upward trend and sooner or later it might overtake the ETHEREUM market cap... I believe she has enough gas to do...
Glad to read your idea in comments :)

BNB has broken $600 mark. Time for a pullback or another leg up!So, BNB has finally crossed $600 mark within no time. It was just last week, when I wrote my previous analysis for BNB and it was trading at around $340 at that time. It has been climbing real fast.
What now ? Is it a time for a pullback or do you see another leg up ? share your views
In my opinion, RSI is overbought for the fifth time now, MACD and signal lines are far apart. Also, the price has broken upper bollinger band. Volume has seen a good spike up. It should see a pullback soon. May be could visit $500 to $600 areas, accumulate and move further upwards. On the other hand, if the volume keeps on increasing it might break the next psychological level of $650, $675 or even $700. Who knows, it's a free territory for BNB.
For trading setups, I would say " BNB is in price discovery at the moment which makes prediction difficult, at this point it would be risky to go long" . Wait for a pullback, a confirmation and then fill your bags, if you want to. Markets discount everything. Remember that :D
For more trading ideas, follow us
Happy Trading

#BNBusdt #BNB#BNB
I believe that we have two strategies here over BNB coin.
But I DO believe that BNB will reach $460 ASAP.
So, if u are agree, leave your comments and like here for me...

BNB in a Bull flag.The price action of BNB at hourly time frame has formed a bull flag, which has bias sto break to the upside.
A break to the upside would mean a break to a new all time high.
I expect the price to hit $420, find support at $410 and move to $440.
RSI needs to break above 60 to confirm bullish momentum.
Good luck!

BNB, Binance Coin - I'm waiting for a breakout pattern⚙️BNB creates a local range near an important key level. I expect the continuation of the movement in this range and squeezing to the level. Only in this case, we will create a great breakout pattern for a long position.
Write in the comments all your questions and instruments analysis of which you want to see.
Friends, push the like button, write a comment, and share with your mates - that would be the best THANK YOU.
P.S. I personally will open entry if the price will show it according to my strategy.
Always make your analysis before a trade

BNB Buy a break setup.BNBUSDT - Intraday - We look to Buy a break of 382.4 (stop at 369.6)
Daily signals are bullish.
Bespoke resistance is located at 380.0
3 positive daily performances in succession.
We look for gains to be extended today.
The trend of higher highs is located at 420.0.
Our profit targets will be 418.4 and 438.4
Resistance: 380.0 / 400.0 / 420.0
Support: 360.0 / 340.0 / 316.0


BNB to $500Nice $BNB another bullish renko bar forming. If trend continues, which I think it will + their buyback, I expect it will create new ATH at 1.618 fib or >$500. Immediate support at $393, breakdown to $352. Trade Cautiously.

BNB 140% gain?? - price predictionOn the daily chart there is this big ass ascending triangle on which there just has happened a breakout. If we follow the Fibonnaci breakout tool, we see 2 possible targets that are around the 560 or 900 dollar level. The quarterly coin burn is also bound to happen between 16 and 23 april. Just as previous huge breakouts happened after that news, this could be a tremendous compound of good factors, resulting probably in a 140% gain coming days/month


#BNBUSDT #dailyHi guys..its the latest analyze chartof #BNBUSDT in daily time frame .if you are interested any crypto that you want analyze with me and any questions please do not hesitate and comment below the chart!
if u like it press like-comment and folow me.thx

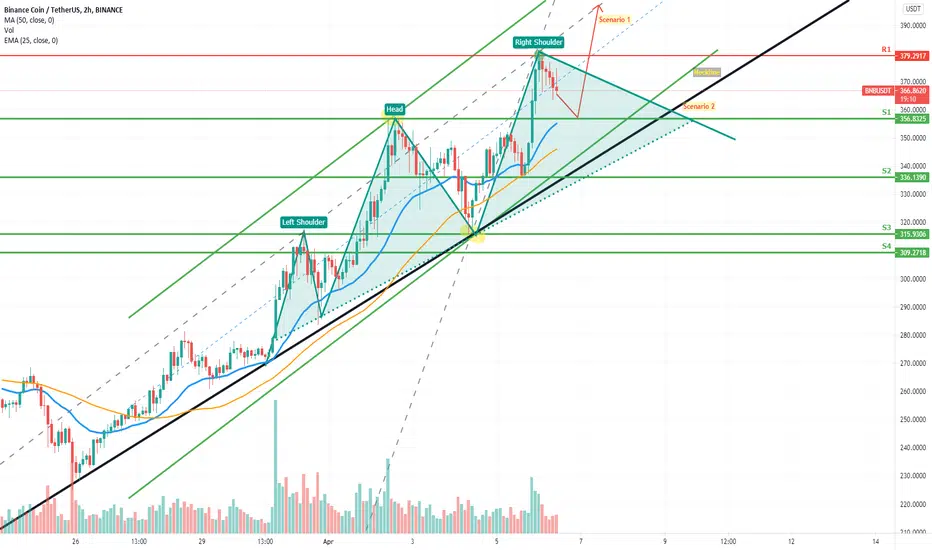
Is BNB forming a potential Head and Shoulders pattern?BNB has been performing outstanding for some time now. Also as predicted in out earlier Idea that BNB could potentially touch new ATH.
However what is interesting to see here is that BNB could form a potential Head and Shoulders pattern, if it manages to touch the Neckline. Neckline is till below its usual upward moving channel. However if BNB breaks lower part of upward channel (Green lines) then it will be officially in an H&S pattern. If this is the case then we might not see another ATH any time soon. Going by the pattern we have two scenarios here:
Scenario 1 (Red Path) - BNB to continue its journey and breaks current ATH to create a new ATH.
Scenario 2 (H & S Pattern) - BNB to stay below current ATH and could potentially break S1 and then try to recover between S1 & S2.
May be next couple of hours could give us much more clear picture of where BNB is heading.
If you like my analysis then do drop a LIKE and a COMMENT. Also dont forget to SHARE it with your friends.
Also dont forget to smash that FOLLOW button to get daily analysis of multiple crypto currencies
NOTE: These are my personal notes and in no way a financial advice. Do your own research and trade wisely.
Is it time for BNB to rest after outstanding performance?BNB has been moving at an impressive speed over the past couple of weeks and it has touched its new ATH in April. BNB is moving in an upward parallel channel, however post touching its ATH it has not tried touching it again. Instead it has settled for 352, which indicates it might be heading for a downward trend.
However it is too early to say, if BNB is officially in a downward trend. It hasn't touched the other corner of its upward trend yet. So we will have to wait and watch if manages to break the Green parallel channel to officially enter the downward trend. After analysing all the trends, below are three potential scenarios.
Scenario 1 (Black path) - BNB will bounce back from 330-337 range and can potentially try to create a new ATH. However if it is pulled back from its earlier ATH, then it can potentially form Double top pattern.
Scenario 2 (Red path) - BNB will break green upward trend and will officially enter the downward trend. However it will be supported by S1. In this case BNB will be moving in an descending triangle, which is again an indicator of further fall.
Scenario 3(Blue dotted path) - BNB will ignore all trends and will straight way follow the downward trend channel by initially taking support at S2.
If you like my analysis then do drop a LIKE and a COMMENT. Also do SHARE it with your friends.
Dont forget to click FOLLOW button to get daily analysis of different crypto currencies.
NOTE - These are my personal notes and in no way a financial advice. Do your own research and trade wisely


