BNB Price: +5% in the next couple of days?If you want to make a quick buck on BNB in an upcoming couple of days, follow these instructions.
IMPORTANT: Never forget about your stop-loss. No one canceled "the will of God"! :)
Bnblong

Bnb/btc ascending traingleBnb last time showed ascending traingle with tether pair i recommend buy after break out and 1st target hit look here on my previous idea with tether pair :
Now it is looking similar but with btc pair
Buy after break and close 4h candel above the traingle with
Or on retest
First target will be 0.00299btc
And stop should be close again in the traingle
Good luck

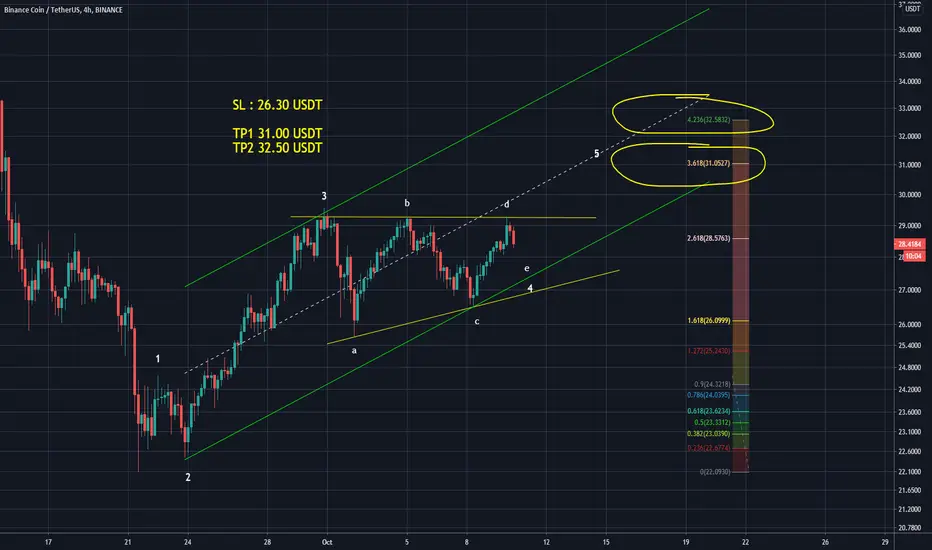
BNB USDT SHORT TERM / ONE MORE LEFT TO COMPLETE WAVE 5I liked this set up and wanted to share with you guys
It is like a text book style ew count.
Cheers
BNB ALL TIME HIGH 34+ possible - the best coffee time for BNB!it looks that BNB can increase the next time to the expecting coffee time 30 usd +
Lets see what the chart will do.
Have nice coffee time!
Follow/like


BNB Long HoldingCheck Chart For Entry & Sell Target.
#BNB USDT TA Spot ✌ 🤲
● Entry Zone 👉 24.5 - 25.7
● Sell Target 1 👉 26.70
● Sell Target 2 👉 27.50
● Sell Target 3 👉 28.00
● Sell Target 4 👉 28.60
✌ Hit The Like Button & Appreciate My Hard work ✌

BNB/USD - ATS SWING BACKTEST (LONG ONLY)Script settings for 4H timeframe:
· Signal calculation type - "close"
-TP for Long - none
-SL for Long - none


ATS efficiency report since July for BNB/USDHello!
Last month BNB has shown very good dynamic.
ATS's strategy has also shown perfect outcomes since the very beginning of July, giving correct indication of the trend changes.
ATS has performed 59% in 10 trades
BNB has become more expensive by 75%
Script settings for 4H timeframe:
· Signal calculation type - "open"
*Based on new beta version ATS
The release will be next week

Binance Coin Analysis: BNB Drawing Closer To Yearly Highs
Binance DeFi integration causes a spike in network activity while creating interest in Binance Coin.
BNB seeks support after rejection at $34; the buyer congestion at $28 to come in handy.
Binance Coin dived to lows of $6.4 following the Black Thursday crash in March. The majority of markets around the globe were feeling the heat from the Coronavirus outbreak. A recovery started alongside other major digital assets but Binance Coin as always curved its unique path, aiming for new yearly highs. There have been barriers but bulls remained relentless in the push for higher levels. BNB enjoys the support of the largest cryptocurrency exchange by daily volume and the number of users, Binance. The exchange encourages users to pay fees using BNB thereby driving up demand for the token.
The recent integration of DeFi into the Binance Smart Chain resulted in increased transactions and activities from projects such as BakerySwap, BurgerSwap, and Cream Finance. According to data from the Binance Smart Chain, BurgerSwap attracted a staking volume of up to $400 million in just 24 hours. Daily transaction activity also surged as per the data provided by BscScan.
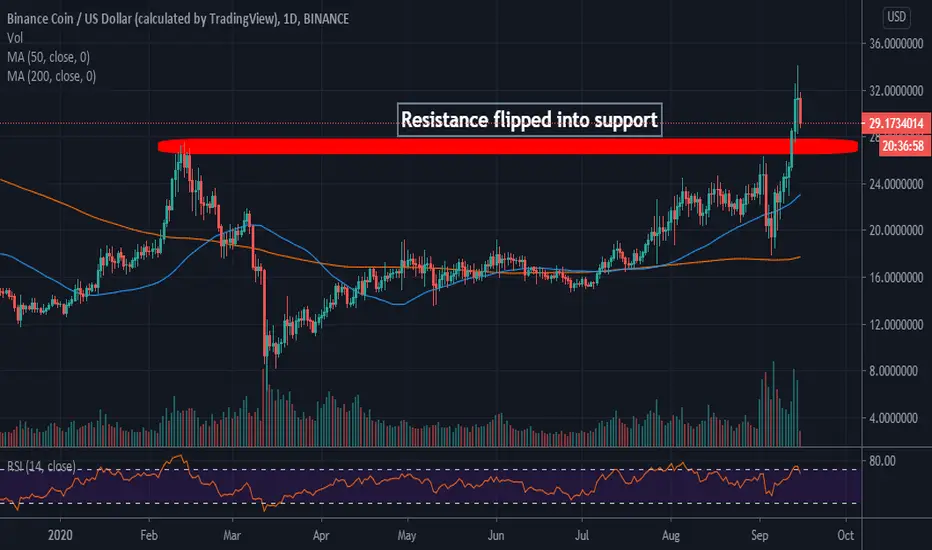
At the time of writing, Binance Coin is seeking support above $30 after hitting a new September high at $34. If the retreat extends below 30, the resistance flipped into support at $28 will come in handy.
However, Binance seems to be taking a breather from the mission to new yearly highs considering the wide gap created by the 50 Moving Average above the 100 MA. The RSI signals a short term retreat from the overbought region but low volatility means that the upside does not have a lot of traction.
BNB Intraday Levels
Spot rate: 30.70
Relative change: -1.82
Percentage change: -5.88%
Trend: Short term bearish bias
Volatility: Low
BNB Looking For Higher Prices??Unfortunately, this post I made about a month ago got banned because I accidentally violated the rules. So far, things worked out perfectly and hit our $33 target.
Previous Post:
"Those of you who have been following me for some time know that I've been following BNB for some time now and expected a large push-up. Given the fact that Binance is getting back into IEO's and from a technical perspective we see a large descending broadening wedge, if we see a weekly close above $24.75, that will likely trigger a move towards the Yearly R1 pivot at $33."

Here I go long on Binance Coin and BNB will go upHere I go long on Binance Coin and Binance Coin will go up. The price is testing the major resistance, so now I go 5x long and the bullish breakout will start. And Binance Coin Rocket will launch. See you up there.

#Binance Coin Important areasThe price reaches very important areas. I expect the bulls to support the price in these areas. Let's see


BNB is breaking out on daily time frame!Binance coin has broken a major resistance level of 23.2720 - 23.6200, and has been in a breakout range for a month.
Currently the price is above this level and BNB is strongly going against BTC.
BNB is the one coin on my watchlist, that has fallen the least! This is a very good bullish sign.
Here is a closer look on daily Head and shoulders on RSI.
What else to say.. yes buy Binance coin!
Good luck with this trade,
Tibor


Binance Coin Analysis: BNB/USD Relaunches Moon-bound Rocket
Binance Coin builds upon August support at $20 for a bullish case eyeing $30.
BNB/USD has the potential to hit new August high as highlighted by the RSI and the MACD indicators.
Binance Coin (BNB) is on steroids as it takes down some of the barriers put in place by sellers following the dive from August high at $24. BNB has been one of the best-performing cryptocurrencies in the market in 2020. Note that in February, Binance Coin drew much closer to $30 but traded yearly high at $27.29. The fall in March affected all the digital assets with BNB plunging to lows at $6.40.
Since the breakdown in March, Binance Coin has more than tripled in value. Most of the gains have, however, been recorded in July and August. The bulls consistently continued with rally in July, to the extent of hitting levels above $20. The bullish leg was then extended to $24 in the first week of August.
Unfortunately, a reversal took precedence sending BNB to confirm support at $20.50. The fall was not necessarily a bad thing because buyers seem to have rejuvenated and are coming back stronger in a bid to trade a new August high.
In the meantime, Binance Coin has been able to clear the resistance at the 61.8% Fibonacci retracement level taken between the last swing high of $24 to a swing low at $20.45. The price is teetering at $23.45 but all eyes are glued on the next hurdle at $24.
Technically, Binance Coin has the potential to hit not only highs above $24 but also trend towards $30. The RSI and the MACD clearly reflect the bullish case. In addition, volatility is high and in conjunction with the increasing volume, they could catapult BNB closer to $30.
Binance Coin Intraday Levels
Spot rate: $23.45
Relative change: 0.3455
Percentage change: 1.5%
Trend: Bullish
Volatility: High


BNB/BTC is in a BIG BULLISH TRIANGLE! Up to 22% gains!BNB/BTC is in a BIG BULLISH TRIANGLE! Up to 22% gains!
And BNB has a contest going thru the 27th of August (possibly longer).
BNB should get some nice gains ahead.
Plus, by holding BNB you get a discount for trading on Binance.
Trade safe my friends...
BINANCE:BNBBTC


BNBUSDT LONG OR BUY , TARGET UP TO $40BNBUSDT confirm the successful " Descending Wedge " pattern in the week frame, the price line also confirmed Uptrend and is above the MA10 of the week.
BNBUSDT buy : $20.5
BNBUSDT target 1 : $28 +-1
BNBUSDT target 2 : $40 +-2
Stop loss : 15% investing long term .
Wish you good deals!
