Binance dex pumping bnbcoinBinance dex pumping bnbcoin
continue iti in the early scenario
you can keep the coin until the official announcement of marginal trading on the exchange
Bnblong

BNB BULLISH$BNB
Bullish. Most of the timeframes are looking good, as long as we remain above yellow POC I think a retest of the range high is reasonable.


BNB Mega profitIt must be one of the biggest profits we've made! Since I have detected (March 7) this opportunity for VIP member. We are full sellers at $ 32. Jávais said we could go to 32.5 but it's risky. I am waiting for a return to $ 24 to buy again.
If you want an update it is possible from 30 likes.

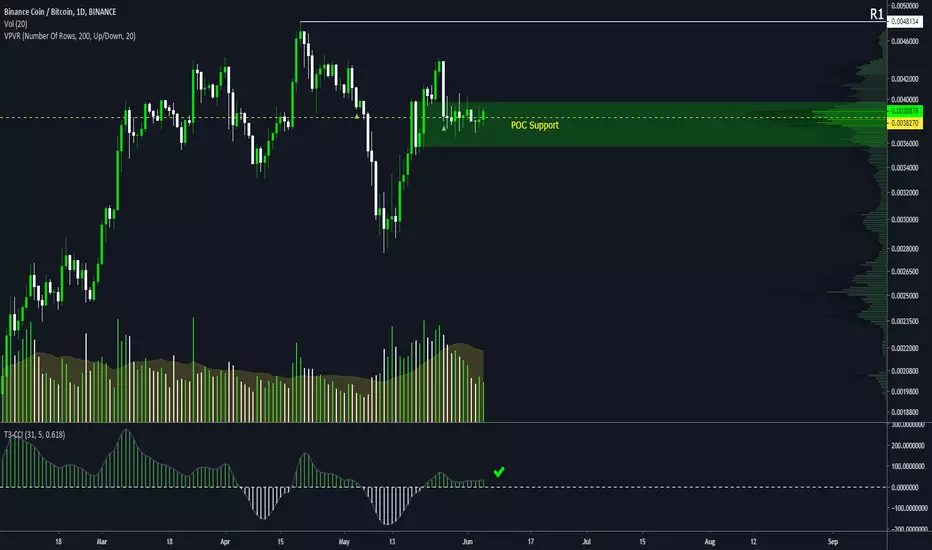
BNB NEW ATH?BNB
Volume is growing over the last few days, broke back into the range with vigor. I wouldn't be surprised to see it retest the ATH next, perhaps even break it if the conditions are right on $BTC.
Invalidation on a break of green support.


$$$ I LOVE MAKING MONEY!! TIME TO BUY BUY BUY!! $$$Hello Everyone,
It has been a while since my last analysis, life has been work busy. Today I decided to take the time to sit down and do some analysis for those of you interested in what I have to say. With that being said, using all of my techincal indicators and data, I have been swing trading BNB/USDT and TRX/USDT for the last several weeks with much success. Up until the today my favorite buy in area has been $17.50 with an exit anywhere between 18.50-19.50 depending on how the day has been going with trends. Currently I am very excited because BNB/USDT has broken below my personal buy area and,is holding strong with an average of $17.00-$17.30. I am going to be making another entry around these levels with a stop loss of $16-$16.30. There is a large ascending channel which is a positive upward sign, however, the pair is currently riding the lower band of that channel so we need to watch this area to see if it holds or, breaks below the channel. The pair is trading inside of the lower resistance zone (Red Boxes) which is off set in between the 100 and 200 MA's (Orange Lines) and riding in between the channel made by the MA's. I will be watching this area closely to see what direction we end up traveling. If we are able to break above the 100 MA we are closely approaching the upper portion of the lower resistance zone. If it holds and maintains, we are once again likely to see a break out towards that upper resistance zone (Red Upper Box). We have not been able to break above the upper resistance area of roughly $20 which I have been successfully using as an exit area.
The short term trend is currently showing bearish signs so, those shorting this pair can consider setting a stop loss around $18.67. IF you decide to enter in the current area keep in mind that the bulls can regain control within a few days. I say this because the current trend is showing bearish signs, yet the long term is still bullish. Short traders can see an entry point marked by the red "E" which is telling me the trend is expected to possibly drop again for a small profit before it continues it's bullsih momentum.
The overall long term is still showing a bullish trend on the martin trend indicator (green dotted line below the candles). The martin buy/sell indicators has just had a cross above the green lower green line which is a buy signal detecting a possible bullisih trend reversal. This is my entry point for the next swing trade. If the upper resistance continues to stand strong I will exit here once again. I have been flipping this pair with an average of %5-%10 profit with each trade. This has been a really fun and exciting pair to trade and I plan on riding this wave as long as I can.
You also need to keep an eye on all of these areas and enter into a range based on the data you are seeing. Even though my indicators are showing a bearish mood, the overall trend is still bullish. The BNB/USDT pair seems to shift gears every 6-10 days. The bollinger bands, which are not shown here, are also indicating buy signals for long traders. The candles are riding the lower portion of the bands which is a buy low/sell high entry point as well. My overall sentiment on this pair is to flip it and take advantage of the highs and lows with every sentiment change. I have a current buy order placed at $17. I will adjust this number accordingly with minor adjustments if I see any price fluctuations.
Currently the RSI and Stochastic are neutral but both a riding closer to the bearish/oversold side of the scale.
RSI = 38.9
Stochastic = 40.1
Please hit like and throw me a thumbs for taking the time to inform you all of what I am seeing and doing with my trades or, if you have found this information helpful or useful! :-) I hope you are all successful in your trades and I encourage you to always do your own research as well for maximum success.
Good Luck and Happy Trading! :-) :-) :-)
-AWC-
*THIS INFORMATION IS INTENDED FOR EDUCATIONAL USE ONLY AND IS NOT MEANT AS ANY BUY/SELL ADVICE. TRADE AT YOUR OWN RISK.*

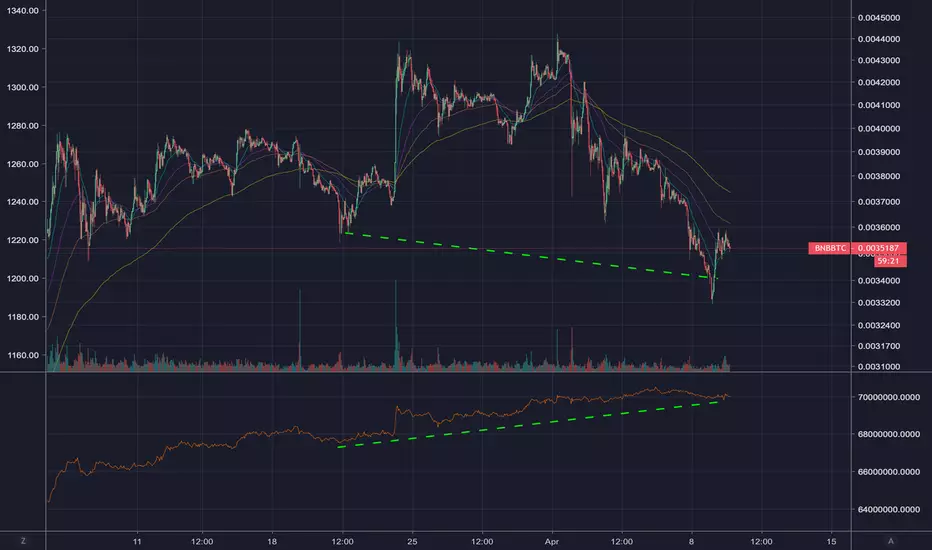
Huge Bullish Divergence and Accumulation on Binance Coin (BNB)BNB is showing bearish price action, and bullish accumulation on the A/D indicator.
Someone is accumulating BNB heavily right now. Time to go LONG.
BNB/BTC - bullish for the remainder of the year?!BNB/BTC looks to be very bullish here. Good potential t/p's are indicated by the higher up yellow lines, with the circles indicating my reasoning.
Target 1: 0.00472
Target 2: 0.00584
Target 3: 0.00716
Target 4: 0.00962
Blue triangle indicates the current range.
Green box is buy.
Red box is sell.
Blue line indicates major resistance.
Yellow line indicates t/p.
This is a log chart.
This is not financial advice. All charts shown on my page, including this one, are just for fun.
If you enjoy my ideas please give this post a like and follow my page if you would like to see future posts! :)


Buy BNBThis play almost seems too easy! BNB showing tremendous value from and fundamental perspective, and the chart is equally as juicy. Expect a new all time high vs bitcoin soon.
Targeting .004195


Binance Coin Go To ATHAfter Completing Primary Eliiott Wave 12345
Now BNB has completed Secondary Elliott Wave ABC
Will BNB Make Primary Back?
It looks like this is good for us to enter, especially when added to the small confirmation on the M30 BNB, it's been broken from the DTL.
Buy: 25000 - 26000
TP 1: 29000
TP 2: 32000
SL: 23399

WILL #BNB LEAD THE NEXT CRYPTO BULL RUN ?BNB has completely outperformed in this bear market, at time of writting this post bnb is retesting its ATH. The price uptrend is backed by the strong fundamentals and high earning margins of Binance exchange, which managed to make $480M in 2018.
However , based on TA perpective i am guessing that the price action haven't seen the major correction which is the part of every market cycle. Based on elliot count i am seeing a sharp dropdown from current price to reach my targets.
This bearish opinion will be invalidated if we manage to break ATH.
I seriously hope that it break its ATH and start the next crypto bull run.
i'll really appreciate if you would leave a like.
I have started posting charts for Forex and Stocks as well , you can check them below

Binance Coin 2025 Fibonacci Trend Line Lattice ForecastThis chart shows the potential upwards trajectory of BNB/USD over the next 6 years with the prolonged growth of the cryptocurrency market. I am confident that with binance becoming one of the first major exchanges to take a large market share of the global exchange markets and solidifying that positioning with its new added debit/credit card wallet functionality. That it will become a titan of the industry.
The Fibonacci Retracement highlights the potential room for growth in the long term with the ability for price to see highs of $148USD by 2025 if we see an upward movement to 1.618 on the retracement chart in the next 72 months which I believe is highly probable if not certain to happen with the adoption rate of the technology as well as the inclusion of institutional players into the market.
Certainly an underlying cornerstone digital asset to anyone's cryptocurrency portfolio I'd advise making it a strong addition to any plans you have over the coming years.
Remember plan for your future not for present and you will succeed in this market!
Dollar cost averaged purchases of BNB coin over the next 4-6 years could net you well over 54,000% in profit if accumulated consistently and correctly. Make sure you don't start too late!

Binance Coin 10% Profit TargetBinance Coin Looks Like Going To Wave 5
Supported by Bullish Hidden Divergence and Touches from EMA.
TP: 26400
SL: 22419

BNB PredictionHere is our Prediction for BNB coin
T1: 8.16
T2: 9.35
SL: If we will break the Point C for high risky people ;) or break this trend line with 4 hour candle under it at least
you can wait for a correction to enter this coin because we think it will be correction maybe till $6 - $6.2 before complete to the targets or also can be risky and buy right now but don't forget risk management for your wallet ;)
if you wanna from us to analysis any coin please leave a comment with the coin you want from us to make analysis for it
Please like and leave comment,we'll appropriate that a lot.
Best of Luck.
CryptoStarsChannel.

BNB Binance Coin Buyzone before token burn at 19. januaryHello traders, as we now BNB got a token burn at 19 january or earlier, lets buy it and wait - pump incoming :-)

Sold BNB at last high with 1 indicatorBuy Green
Sell Red
//
it's mainly for swing trading, i use the 3 day / 15 day / monthly charts with it and it works perfectly,
//
it works good for stocks and cryptocurrency.
//
you will use heiken ashi chart style and turn on the EMA DOTS indicator.
once the indicator is on you will hide the heiken ashi so you only see the dots.
//
when a green dot -6.68% -7.44% -7.44% appears you buy, if a green dot -6.68% -7.44% -7.44% appears after that green dot -6.68% -7.44% -7.44% you hold your investment.
if a red dot appears you sell your position. easy as that.
//
the standard dots setting will be set to 10 - use this for any chart above 3 days
change the dots setting to 6 for 3day charts and below
//
shorter time frames will be choppy.
//
larger time frames will be smooth.
//
*Daytrading smaller timeframes is possible but not recommended.

Daily Bullish Signal #BNB #BNBBTC (29-09)#BNB (BNB/BTC)
Buy : 152
Flash Sell : 155
Short Sell : 158
Long Sell : 160-165-170-175-180
Stop : 145
Follow me for more signals daily
Inbox me if you need cost-services

BNB 30 % profitWe have very interesting trade.
Look this purple line support from January 2018. We didn't break 6 times .
The red line is very good resistance we didn't break 4 times.
What is my proposition ?
Long now or waiting 9.5 $
First target 11.66
if we can break I'm sure we going touch 14 $ ! I propose sold all your position and buy again around 10.5 $
Fundamental analysis:
Coin Burn in October !
I'm going update this trade if I have more than 30 likes
