BNB growth after launchpool announcementI invite you to discuss the BNB chart on a four-hour interval. As we can see, the price has broken our yellow downtrend line with dynamic upward movements that are associated with the newly announced Lanchpool on the Binance exchange.
Due to the sudden increases after unfolding the trend based fib extension grid, we see that the price is fighting a strong resistance at $261, only when the price overcomes it will the path towards the next resistance at $279 open.
Looking the other way, we have visible support at the level of $252, then there is a visible support zone from $242 to $236, while a break from the bottom may result in a drop to the support level at $220.
When we turn on the EMA Cross 50 and 200 indicator, we will see confirmation of the return to the upward trend.
On the RSI indicator, we have approached the upper limit, which reduces the room for growth, while on the STOCH indicator, we are moving above the upper limit, which may result in a rebound in the coming hours.
BNBUSDT

BNB shows potential for a 60% moveHey everyone,
After a relatively long time of having no activity here, I've resumed sharing my ideas here.
There's potential for an upward move in #BNB if it successfully breaches and maintains its position above the white line.
I've already opened a #long position. Let's observe its progress.
Cheers!
Mr. Cryptotracker

🌟🔍 Binance Coin (BNB) and Its Market Influence 📈💡
🔑 Critical Resistance at $255.7: The resistance level of $255.7 for BNB is crucial for the entire crypto market. A breakout and consolidation above this level could signify restored confidence in Binance and potentially help the market move past the FUD surrounding its former CEO, CZ.
📈 Futures Trading on Breakout: If BNB breaks this level, it could be a signal to open a long position in futures. However, tailor your stop-loss size according to your personal strategy.
🛒 Buying and Holding Strategy: As indicated on the chart, a safe stop-loss for buying and holding BNB would be below $205.
🌊 BNB's Market Impact: BNB's movement could be pivotal in triggering another bullish wave across the broader market, so it's advisable to keep an eye on other cryptocurrencies as well.
🔑 Related Categories:
Binance Coin (BNB) Analysis
Market Impact and Confidence
Entry and Exit Strategies
📣 How do you view BNB's potential impact on the wider crypto market? Are you considering any positions in BNB or other cryptocurrencies? Share your plans and thoughts! 💬🌐 #BNBMarketImpact #CryptoInvestment #TradeCityPro
📚 Remember: Cryptocurrency trading involves risks. It's crucial to stay informed and approach trading with a clear strategy and risk management plan! 🧠💼

BNB UnleashedDon’t Miss Out! Binance Coin (BNB) Leads Crypto Market Charge with Technical Breakout Fueling Potential Surge
Binance Coin (BNB) Price Analysis: Navigating the Path to Surge Towards $300
In the ever-evolving landscape of the cryptocurrency market, Binance Coin (BNB) stands out as a beacon of potential, with its current trajectory indicating a probable climb of up to 20% towards the coveted $300 mark. This analysis delves into the nuanced factors driving BNB’s recent surge, the strategic levels to watch, and the overall market sentiment that could influence its journey.
Binance Coin Price Overview: Catalysts and Momentum
Binance Coin has emerged as a standout performer in the recent crypto market dynamics, particularly as Bitcoin reaches $42,599 and Ethereum soars to $2,204. Amidst this bullish backdrop, BNB has exhibited notable gains, currently resting at $254. The market’s growing optimism, fueled by the anticipation of BTC spot exchange-traded funds (ETFs) approval in January, has become a driving force behind the surge in various cryptocurrencies.
However, the crypto space remains on edge due to the lingering uncertainty surrounding potential pre-approval sell-offs or rallies. In this context, Binance Coin appears to be charting a course of least resistance, paving the way for potential upward movements.
BNB’s Path to $300: Technical Analysis
As we dissect the technical aspects of Binance Coin’s recent performance, it becomes evident that the coin is in the early stages of a compelling rally with a target set at $300. Key indicators underscore the positive trajectory:
Exponential Moving Averages (EMAs):
BNB has maintained its position above crucial levels, as indicated by three applied MAs. The 50-day Exponential Moving Average (EMA) in blue, currently at $237, serves as foundational support. Additionally, the confluence support created by the 21-day EMA (in green) and the 200-day EMA (in white) adds further strength to BNB’s position.
Trendline Breakout
A pivotal moment in BNB’s recent journey was the breakout from the descending trendline resistance. This breakout, coupled with a spring from the horizontal ray support backed by the 50-day EMA, accentuates the bullish theory surrounding Binance Coin.
Yellow Resistance Breakthrough
The next breakout, anticipated above the yellow band on the chart, could be a game-changer. A successful retest of this yellow resistance may pave the way for BNB to surge towards the $300 milestone.
Market Sentiment and Considerations
With BNB’s trajectory pointing towards potential gains, traders need to exercise strategic considerations. As the coin makes strides towards the $300 target before 2024, cautious optimism is advised. Traders should be vigilant, considering potential obstacles at $260 and $280, which might pose challenges during the ascent.
In conclusion, Binance Coin’s ascent in the crypto market reflects not only its individual strength but also the broader positive sentiment prevailing in the space. The journey towards a climb to $300 holds promise, and strategic awareness of key levels will be instrumental for traders looking to capitalize on BNB’s upward momentum. As BNB continues its climb, the crypto community watches with anticipation to see if it can conquer the challenges and emerge triumphant in the ongoing crypto rally.

BNBUSDTBNBUSDT is in strong bullish trend.
As the market is consistently printing new HHs and HLs.
currently the market is retracing a bit after last HH, which is very healthy retracement level and local support as well. if the market successfully sustain this bullish confluence the next leg high could go for new HH.
What you guys think of this idea?

BNB: Approaching ResistanceTrade setup : Trends are mixed. Following a bullish breakout from Sideways Channel , price reached our target of $260, where it got rejected again, just as it did in Nov and July. Swing Traders: Pullbacks near $220 support area could be an attractive swing trade entry, with upside back to $260 near-term. That $220 level was previously a resistance area, which was broken and turned into support area (concept known as polarity) . Trend Traders: If price breaks above $260 resistance zone, it could revisit $300 next.
Trend : Uptrend across all time horizons (Short- Medium- and Long-Term).
Momentum is Mixed as MACD Line is above MACD Signal Line (Bullish) but RSI ~ 50 (Neutral). MACD Histogram bars are declining, which suggests that momentum is weakening.
Support and Resistance : Nearest Support Zone is $220 (previous resistance), then $200. The nearest Resistance Zone is $260, then $300.

BNBUSDT SHORTBNBUSDT SHORT:
brake the last uptrend line and touches the last trend line .
you can risk 1% . set Sell Stop and Take profit.
ratio: 1 : 1.5

BNBUSDT is getting readt to pump to $500Hey #SSE community,
As you can see, BNB has broken its long-term weekly trendline and is currently stuck under a static resistance in area of 265 bucks.
In my opinion, after breaking this resistance, BNB can grow to the following targets in the next 9 months :
333 , 350 , 390 , 450 , 500
Do not forget do risk and liquidity management.

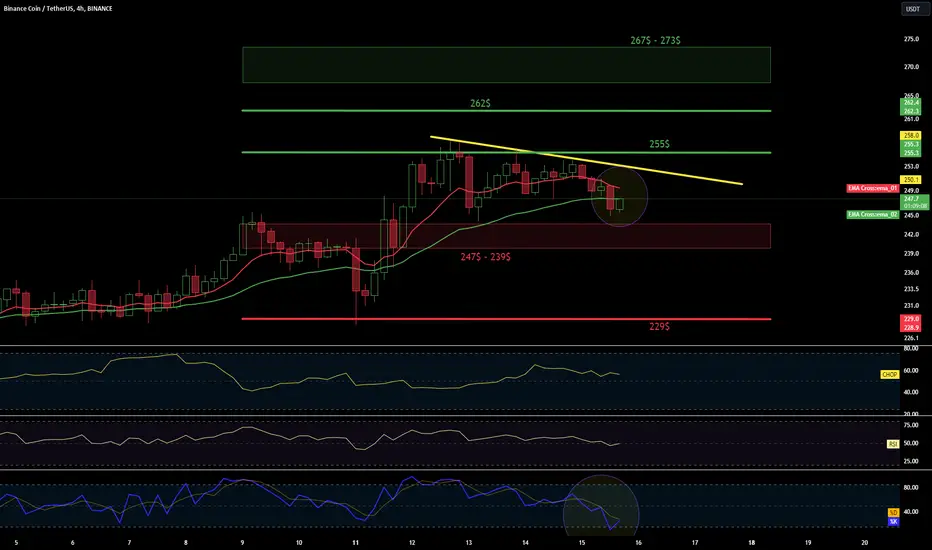
BNB/USDT 4HInterval ChartI invite you to review the chart of BNB in pair with USDT, also on a four-hour time frame. First, we will use the yellow line to determine the local downward trend under which the price is moving.
In order to determine the current supports for the BNB price, we will unfold the trend based fib extension grid, and we can see that the price is approaching a strong support zone from $247 to $239, however, if we break down from this zone, we can see the price return to the support area at $229.
Looking the other way, we can similarly mark places where the price should encounter resistance on the way up. And here, first, there is strong resistance at the price of $255, then there is resistance at the level of $262 at the golden Fib point, and then the price has to face a strong resistance zone from $267 to $273.
Please look at the STOCH indicator, where we have a strong rebound and there is room for us to go a little lower, but moving near the lower border we can observe an attempt at a rebound and small increases.
And when we look at Ema cross 10 and 30, we can see that they do not yet indicate confirmation of a return to the downward trend.
Continue Bullish MarketHello!
I am a big fan of the Elliott wave principle, which I find very interesting and useful for market analysis. I have developed my analytical approach by combining this principle with my personal experience and considering various scenarios that could occur in the market.
While I would like to share my analysis with you, please note that I am not providing a buy or sell signal. My primary intention is to share my unbiased analysis so that you can utilize it as a guide to make an informed decision.
To build your confidence in my analysis, I always share my previous analysis from the same market so that you can compare and see the progress. All the details of my analysis are clearly labeled, which should make it easy for you to understand.
I hope that my analysis is useful to you in your business journey, and I wish you all the best.
I am looking forward to hearing from you. Lastly, I would like to mention that like-mindedness and support, comments, and likes are the most important pillars of progress, just like support points in the financial markets. They give me the energy to continue and share more ideas with you.
Sincerely,

BNB high buyer activity! LONG up to 262 ⬆️LONG #BNBUSDT from $254.5
Instrument formed a sideways movement, we see that buyer activity remains at a high level, impulse drops are quickly bought off, trading volumes are locally as high, there is an excellent price compression under the formed cascade of levels, the breakdown of which I will consider in the near future, with the acceleration of the price in the breakdown, I expect to see a continuation of the long to the two potentials marked on the graph

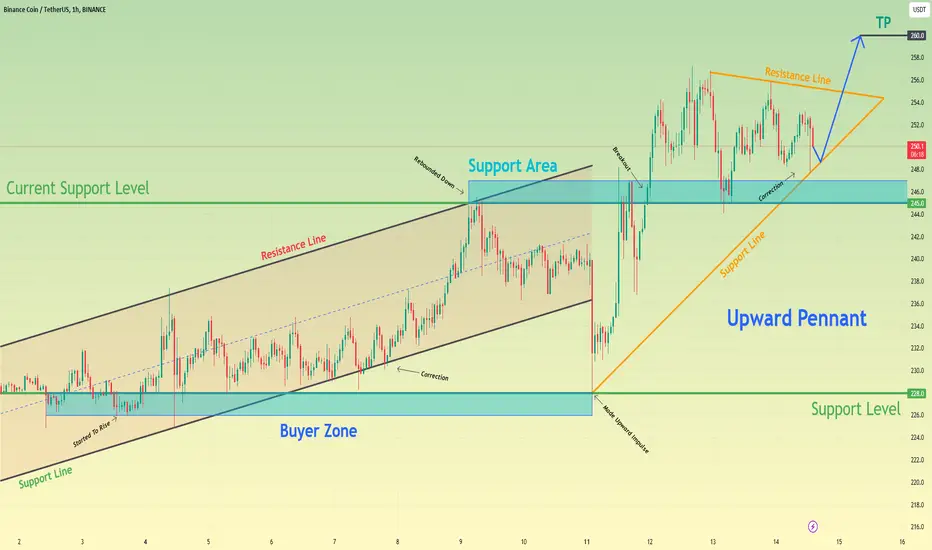
Binance Coin can rebound up from upward pennant to 260 levelHello traders, I want share with you my opinion about Binance Coin. By observing the chart, we can see that the price a few days ago started to rise in an upward channel, where it first broke the 228 support level, which coincided with the buyer zone. Some time ago, BNB made a correction to the support line of the channel and then bounced to the resistance line. After this, the price rebounded and fell to the 228 support level, which coincided with the support line of the pennant, thereby exiting from the channel. Next, the price rebounded from this line and made a strong upward impulse to the resistance line of the pennant, breaking the 245 level. Also then, BNB corrected to the support area and a not long time ago continued to rise near the support line of the pennant. And now, I think that Binance Coin can rebound from the support line and rise to the resistance line of the pennant. After this, BNB can break this line, thereby exiting from the pennant and then continuing to move up. For this case, I set up my target at the 260 level. Please share this idea with your friends and click Boost 🚀
bnbSupport and press the rocket to cheer me up
Observe the ten percent loss limit
Stay away from Bitcoins
Feel free to buy and sell and post your comments


BNB Following my ideasBinance coin is perfectly following my ideas. 264 will be my target and i will start considering a short at this price level. We are up 8% o spot, enjoy

finally bnb preparing for massive recovery bnb looking good for solid recovery
formed symmetrical triangle in 3 days timeframe and soon expecting massive breakout incase of successful breakout expecting solid bullish rally
expecting 2 3x bullish wave incase of successful breakout

BNBUSDT Long (longterm posision)"I believe BNBUSDT is currently forming a triangle pattern, nearing its completion. The breakout is imminent. However, it's essential to consider the fundamental aspect as the fundamental performance of BNB is not favorable. Despite this, there is a promising long-term technical position, and I plan to trade it with approximately 2x or 3x leverage."
Follow me on X.COM --> cryptoboys2030

🌟🔍 Binance Coin (BNB) in a Critical Zone 📉💠
🚨 BNB's Risky Range: Binance Coin (BNB) is currently in a precarious range between $241 and $205. Its position within this zone could significantly impact the broader digital currency market.
📉 Lack of Support Below $205: There is almost no static support below the $205 level. A fall below this point could lead to undesirable market consequences.
📈 Potential Upside Movement: As long as BNB remains within this box, an upward movement could positively influence the altcoin market. However, reaching the box's upper limit of $241 could hinder the growth of other altcoins.
🛒 BNB Buying Strategy: Consider buying BNB after it crosses $241, with a stop loss around $200, which represents a risk of approximately 20%.
🔻 Downward Movement Impact: A downward trend in BNB could lead to a drop in altcoin values. I'll discuss the implications of BNB falling below $205 in more detail later.
💡 Personal Approach: I plan to wait and buy BNB after it surpasses $241 and then hold.
🔍 Key Resistance Ahead: An important resistance to watch is at $350. Beyond this point, there is no significant resistance.
🔑 Related Categories:
Binance Coin Analysis
Market Impact and Strategy
Support and Resistance
📣 How are you navigating BNB's current position? Do you see an opportunity or a risk? Share your insights! 💬🌐 #BNBAnalysis #CryptoMarketImpact #TradeCityPro
📚 Remember: Cryptocurrency trading is highly speculative and risky. Always conduct your own research and consider your financial goals and risk tolerance! 🧠💼

BNBusdt last time on this prizeSorry for the many lines, because friends are trading with lower times, I had to specify all the goals.
This may be the last chance to see a bnb at these prices
Don't forget that anything can happen, even a sharp price drop, and this market has a high risk.
But if you have done your research and you want to have bnb, it is a good opportunity to buy and bnb may not return to these prices, especially if bitcoin continues to rise or does not have a sharp correction.
Good luck
EntryPoint:
238.8
231.8
222
Supports:
210
195.6
188.5
178.8
Resistances:
246.3
255.7
Targets:
267.3
281
299.6
324.6
338.6
360
Midtime:
403.3
436.9
484.4
HODL:
542.2
588
652
730.6
783.2
877.6
GL

BNBUSDT Buy LimitThe H1 chart for BNB indicates the presence of Supply Demand zones. Bulls are making concerted efforts to establish new resistance levels and achieve higher highs. The risk-reward ratio stands at 1:2, Those who have confidence in BNB may choose to hold it for an extended period.

BNB at critical junctureBNB is coming to a close on this descending triangle which is typically seen as a bearish structure. Depending on the price action we see, whether the descending line is broken to the upside for a bullish trade or the horizontal line breaks for a bearish trade, it could signal where the overall market could be heading over the next 12 months given the positive correlation across crypto.
Considering the recent price action and weakness in BNB relative to Bitcoin along with the CZ fiasco the probability of a downside break seems likelier. Watching closely to see how price action unfolds.

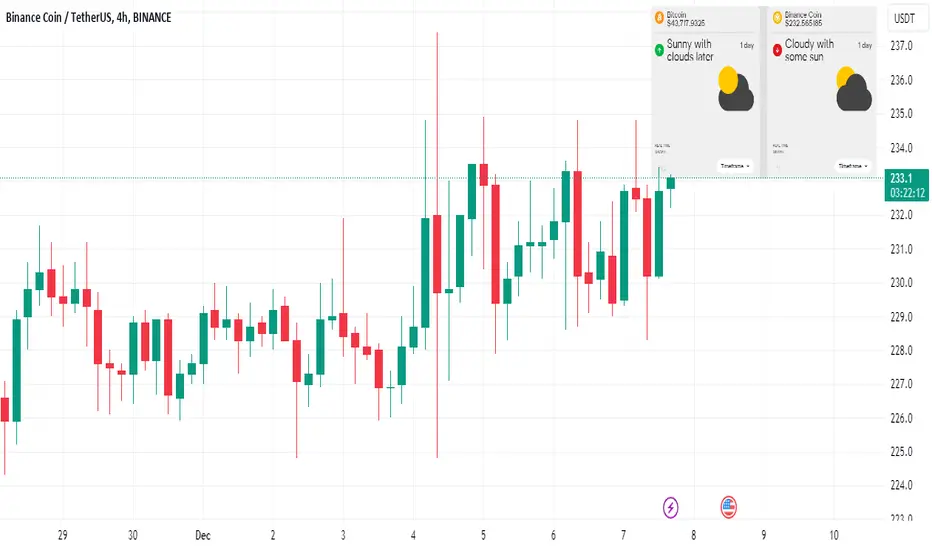
BNB ☁️ 24-Hours, Rebound in 1 Week; BTC Bullish ☀️A bullish ☀️ shines over most of the global crypto market, including Bitcoin and Ether, in the next 24 hours and seven days, ATTMO shows.
However, cloudy or rainy ☁️ bearish trading conditions will prevail over Binance Coin, Dogecoin, and Uniswap over the next 24 hours, although the bullish sun ☀️ will later come back and shine on Binance Coin.
Follow us for more crypto weather insights!
BNB: Approaching SupportBinance (BNB) technical analysis:
Trade setup : Trends are mixed. Following a bullish breakout from Sideways Channel, price reached our target of $260, where it got rejected again, just as it did in July.
Swing Traders: Pullback near $220 support area could be an attractive swing trade entry, with upside back to $260 near-term. That $220 level was previously a resistance area, which was broken and turned into support area (concept known as polarity).
Trend Traders: Price needs to break above 200-day moving average and $260 resistance zone to confirm Uptrend. If it does, it could revisit $300 next.
Trend : Downtrend on Short- and Medium-Term basis and Uptrend on Long-Term basis.
Momentum is Mixed as MACD Line is below MACD Signal Line (Bearish) but RSI ~ 50 (Neutral). MACD Histogram bars are rising, which suggests that momentum could be nearing another upswing.
Support and Resistance : Nearest Support Zone is $220 (previous resistance), then $200. The nearest Resistance Zone is $260, then $300.
