BNBUSDT

$BNB LONG. Bossco Algo caught every $BNB bullrun.
BINANCE:BNBUSDT long entry has been in play. Bossco Algo caught every BINANCE:BNBUSDT bullrun.
Pity that TV took down my old post since it referenced an outside URL where entries are called in real time ...
Model Architecture:
• 1,000+ hours of quantitative research.
• 1,000+ machine hours of backtesting & forward testing.
• Based on pure price action, zero bias, zero emotions (see methods tested 👇)
• Long & Short, Execution on 4H timeframe
All methods tested:
Why share?
• It's my model, so I get the model signals first. I'll already be positioned in my longs, so I don't really care if you enter or not. Hedge fund PMs literally have dinners where they talk their own book after positioning.
• Signals are on a high timeframe on liquid assets, so you should be able to get in at the same price. You can't stop hunt me, because I don't post stop losses.
I will never give away the code or the techniques selected . No one gives away proprietary quant models that actually work. Please don't ask.
I don't plan on ever making signal access paid, since I want a public record of proof that the signals are real. I make my money through trading, not scam discords or courses.
Model output is for research purposes only. Not financial advice.

Binance with symetrical triangleBullish at binance continue with symmetrical triangle pattern.
To confirm this pattern as a bullish one, binance need to break up 229.6 as bullish confirmation level.
Symmetrical triangle bullish projection (AB=EF) at $250
Note : This pattern can be bullish pattern or bearish pattern, depend on break out direction.

Uptrend transition : 240.2-248.8Hello traders!
If you "Follow" us, you can always get new information quickly.
Please also click “Boost”.
Have a good day.
-------------------------------------
(BNBUSDT chart)
It is supported and shows an upward trend around the strong support range of 179.2-210.2.
(1W chart)
The key is whether the price can be maintained by receiving support in the 233.9-260.72 range and rising above 283.4.
If it rises above 339.08, it is expected to show a rapid movement.
(1D chart)
It is expected to turn into an upward trend by rising above 240.248.8.
Accordingly, the key is whether it can receive support around 248.8 and rise above 268.5-285.3.
Even if it falls below the 240.248.8 range, if it shows support around 232.2, that is, around the MS-Signal indicator, it is expected to create a pull back pattern and rise.
--------------------------------------------------
- The big picture
The full-fledged upward trend is expected to begin when the price rises above 29K.
This is the section expected to be touched in the next bull market, 81K-95K.
-------------------------------------------------- -------------------------------------------
** All explanations are for reference only and do not guarantee profit or loss in investment.
** Trading volume is displayed as a candle body based on 10EMA.
How to display (in order from darkest to darkest)
More than 3 times the trading volume of 10EMA > 2.5 times > 2.0 times > 1.25 times > Trading volume below 10EMA
** Even if you know other people’s know-how, it takes a considerable amount of time to make it your own.
** This chart was created using my know-how.
---------------------------------

BNB/USDT Chart 4HIntervalHello everyone, I invite you to review the BNB pair to USDT chart. First, we will use the yellow line to determine the downward trend from which the price has moved upwards, moving into the upward trend channel, marked with the blue lines, in which the price moves at the upper limit of the range.
Going further, we can move on to marking support areas when we start a larger correction. And here, first of all, we have a support zone from $240 to $231, but if the zone does not maintain support, we may see the price return to the area of the second zone from $217.5 to $207.
Looking the other way, we see that the price is fighting in a strong resistance zone from $247 to $255, only when we break out of it and then it is positively tested, we should see a move towards the resistance at $277.
When we turn on EMA Cross 50 and 200, we have clear confirmation of the return to a strong upward trend, which should now be watched to see how this indicator will behave further.
Please look at the CHOP index, which indicates that the energy is approaching exhaustion, while the RSI and STOCH indicators show that the upper limit has been exceeded, which has stopped further price growth and should result in a price recovery.

BNB │ LONG │ 05.11.2023BINANCE:BNBUSDT.P
Comment
A great situation with BNB. The level's strong foundation on August 29, 2023, is clearly visible. The clear confirmation of the level on October 24, 2023, with the closing price almost at the level and reduced volatility on November 4, 2023, also clearly indicates the presence of a player in the market who placed a limit order at the price of 239.
When analyzing the trade, I ask myself the following question: "What happened that shouldn't have happened, and what didn't happen that should have happened?" In answering this question, I come to the conclusion that after a strong movement of the instrument, it should undergo a correction, which I do not see happening. Additionally, what strengthens my confidence in a future breakthrough is a very good consolidation with an approach to the level throughout the day. This is not a sudden price spike to the level but a slow and confident approach to the level. When the daily bar opens on November 5, 2023, we won't have to cover a long distance to reach the level because we will already be close to it. This means that there will be practically no resistance.
And this is exactly what happened.
Signals for level breakout
bar/candles closure near the level;
bar/candles closure near its high/low;
the instrument gradually approaches the level;
accumulation of energy for level breakout;
a good approach to the level;
consolidation near the level;
decrease in trading volumes before the level;
there is no reaction to a strong instrument movement;
there is a reserve of calculated ATR;
there is a reserve of technical ATR;
Signals against breaking the level
distant level retest;
Order parameters (risk-to-reward ratio = 1 to 3/4/5)
Open : 239.15175;
Stop loss : 238.393;
Take profit :241.428/ 242.18675/ 242.9455;
Disclaimer
Every trader should make their trading decisions based on their own analysis and circumstances. The signals in this channel should be considered as an additional tool for your own consideration.
Follow me and receive high-quality cryptocurrency market analysis!

I'm looking for these chart patterns...
This is the SOLUSDT chart overlayed onto the LINKUSDT chart.
I reckon we need to look out for these horizontal chart patterns for potential breakouts...


Is #bnb retesting for a mini rally?If this retest succeeds, i expect a mini rally from #binance #token but i don' t expect #bnbusdt price to devastate 300s #usdt region hardly.
NOT FINANCIAL ADVICE.

BNB/USDT 1DInterval ChartHello everyone, I invite you to review the BNB chart in pair with USDT, also on a one-day time frame. First of all, we can use the yellow line to mark the downward trend line from which the price went up.
Now let's move on to marking the support places. We will use the Fib Retracement tool to mark supports, and as you can see, first there is a support zone from $224 to $220, but then we can see a decline to the very strong zone from $209 to $202.
Looking the other way, we can similarly mark places where the price should encounter resistance on the way up. And here you can see that the price has been rejected by the resistance zone from $231 to $238, only when we break above it will we move towards the resistance at $248.
When we turn on EMA Cross 50 and 200, we can see that we are still in a strong downtrend, staying below the blue line of EMA Cross 200. The CHOP Index indicates that there is still energy left for a move. On the RSI, we are moving in the upper part of the range, but when we look at the STOCH indicator, the visible rebound creates room for a potential further price increase.

BNBUSDT 30-10-23BNBUSDT idea, might give a breakout to the upside in that case please use your setup otherwise you can use this.
Note: not a financial advice

BNB/USDT 1H Interval ReviewHello everyone, let's take a look at the BNB to USDT chart taking into account the one hour time frame. As you can see, the price is moving above the local downtrend line.
After unfolding the Fib Retracement grid, we will mark a support zone from $224 to $221, while we still have support at $218.
Looking the other way, you can see that the price has moved back through the resistance zone from $230 to $234, and then we have resistance at $238.
Looking at the CHOP indicator, we can see that there is still some energy left for a move, on the RSI indicator, despite the recovery, there is still room for a decline, and on the STOCH indicator, we have room for the price to go lower.

BNBUSD down almost 40% since mid-summer, time for a rebound?One of the cryptocurrencies that came to our attention recently is Binance Coin. Currently, it trades near $213, down nearly 40% from its summer highs, which makes a compelling case for a rebound. As a result, we watch a setup with a long position entry above Resistance 1 and a tight stop-loss order below it; Resistance 2 will act as our price target level if the breakout occurs. We will update thoughts on the asset with the emergence of new developments.
Illustration 1.01
Illustration 1.01 shows the setup for BNBUSD.
Technical analysis gauge
Daily time frame = Neutral
Weekly time frame = Neutral
*The gauge does not necessarily indicate where the market will head. Instead, it reflects the constellation of RSI, MACD, Stochastic, DM+-, ADX, and moving averages.
Please feel free to express your ideas and thoughts in the comment section.
DISCLAIMER: This analysis is not intended to encourage any buying or selling of any particular securities. Furthermore, it should not be a basis for taking any trade action by an individual investor. Therefore, your own due diligence is highly advised before entering a trade.

BNB 4HInterval Review ChartHello everyone, let's take a look at the BNB to USDT chart on a 4-hour time frame. As you can see, the price is moving above the local uptrend line.
After unfolding the Fib Retracement grid, you can see that the price is moving above the support zone from $212.5 to $210.5, then there is support at $208.5, and then a strong support zone from $205.6 to $201.9.
Looking the other way, you can see that the price is trying to attack the strong resistance zone from $214 to $217.4, when it manages to overcome it, we still have resistance at $221.6.
Looking at the CHOP indicator, we can see that the energy is slowly starting to grow, on the RSI we are moving in the upper part of the range, but looking at the STOCH indicator, we can see that the rebound took place to the middle of the range and resulted in another rebound, which slightly limited the space for a new price increase.

BNB SHORT SIGNAL 15MINHello dear traders
I came with a short-term short signal in the BNB currency in the 15-minute time frame.
Entry point, loss limit and profit limit are shown in the picture.
In the specified area, we will expect a price reaction in the direction of shorts.
Thank you for your support

BNB/USDT 4HInterval Review ChartHello everyone, I invite you to review the chart of BNB in pair with USDT, on a four-hour interval. First of all, we can use the blue lines to mark the upward trend channel in which the price is currently trying to go above it for the second time.
Now let's move on to marking the support places. We will use the Fib Retracement tool to mark supports, and here we can see a strong support zone from $208.5 to $205.7, but when we fall lower, the next support is at $202.
Looking the other way, we can similarly mark places where the price should encounter resistance on the way up. And here the price was rejected by the resistance zone from $214.6 to $218.5, and then we have a second strong zone from $222 to $228.
The CHOP Index indicates that most of the energy has been used. The RSI indicator shows that we approached the upper limit, which resulted in a price recovery, similarly the STOCH indicator began to reverse after approaching the upper limit and it is clear that there is room for the price to go lower.

Binance (Build and Build): Facing the SEC and the FUDSBinance Coin (BNB), the leading cryptocurrency exchange in terms of volume, has seen gains in its weekly chart, giving investors hope for more profits. According to the latest data, things could get even better as BNB’s Galaxy Score is at its highest level among the top cryptocurrencies, which is promising for a bull run.
Investor Interest in BNB
The popular altcoin BNB has managed to impress investors by showing an increase of over 1.5% in its price in the past seven days. At the time of writing, it was trading at $213.51 with a market capitalization of over $32.2 billion, making it the third-largest cryptocurrency.
As the price of the altcoin rose, the trading volume also experienced double-digit growth, paving the way for price increases. According to the data from analytics firm Artemis, Binance’s network activity has also seen an increase recently, as it revealed that BNB’s daily active addresses have been on the rise in the past few weeks.
Increase in BNB Metrics
A similar upward trend has been observed in terms of daily transactions for the blockchain, which sharply rose after a decline. The trading volume of the blockchain has also increased in the recent past, indicating that investors are willing to effectively trade BNB. The increase in volume has also supported the price surge.
Thanks to the price increase in the cryptocurrency, the volatility of the token has significantly increased in the 1-week period, raising the possibility of further growth. The token’s social volume has also recorded a relatively higher level. This suggests that the token was a popular altcoin in the crypto space last week. According to experts, most indicators favor the bulls, which could lead to further price increases for BNB. For example, the MACD showed an upward trend. BNB Chain’s Money Flow Index (MFI) and Chaikin Money Flow (CMF) have increased, which could increase the likelihood of prices moving further north.

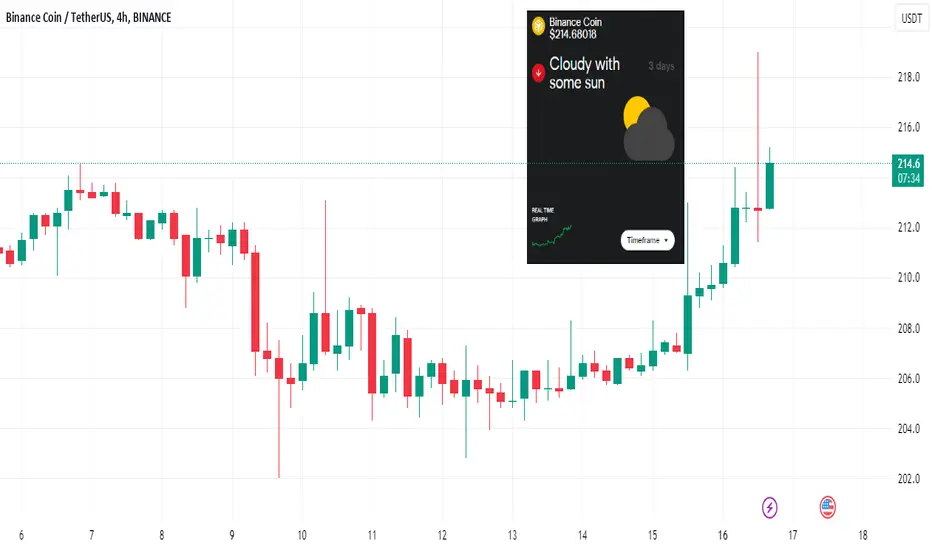
BNB ☁️ Downtrend for the next 3 days? Mixed trading conditions ahead for the global crypto market, with Bitcoin, Ripple, and Binance Coin facing slightly bearish clouds in the next 24 hours. ☁️ BNB downtrend continues for the next 72 hours.
Ether, Cardano, Avalanche, and Dogecoin bask in slightly bullish sun. ☀️ However, Litecoin and Polkadot endure the crypto storm 🌧️, signaling a very bearish market with downside risk.
Over a one-week horizon, the outlook remains cloudy ☁️ and rainy 🌧️ for most cryptocurrencies, with Bitcoin and Polygon as the exceptions. They should both enjoy a slightly bullish sun ☀️, indicating an upside potential.
Follow us for more crypto weather reports!
BNB/USDT 4HInterval ReviewHello everyone, let's take a look at the BNB to USDT chart on a 4-hour time frame. As you can see, the price tried to break above the local upward trend line, but quickly returned below it.
After unfolding the trend based fib extension grid, we can see that we have a support zone from $207 to $204, then support at $201 and then at $199.
Looking the other way, you can see that we are in the resistance zone from $209 to $211, and then we have a second zone from $213 to $217.
Looking at the CHOP indicator, we see that most of the energy is exhausted, on the RSI indicator we are approaching the upper limit, which may reverse the price movement, and on the STOCH indicator we are also approaching the upper limit, which resulted in a deceleration of growth.

BNB/USDT 4HInterval Review CHartI invite you to check the BNB chart on a four-hour time frame. We will start by marking the upward trend channel with blue lines, from which the price broke out at the bottom, and the price decline itself was close to the height of the previously defined channel.
Moreover, it is clearly visible that the lower end of the decline after leaving the channel is also the location of the current support zone.
At this point, it is also worth defining the downward trend triangle we are in with the yellow lines.
Next, using the Trend Based Fib Extension tool, we can determine an important support zone in case the price breaks out of the current triangle.
Looking the other way, we can similarly determine the resistance areas that the price must face. And here we see that currently the price must pass through the resistance zone from $217 to $221, then overcome the resistance at $233 to continue towards the resistance at $252.
The CHOP index indicates that there is energy to make another move, on the RSI indicator, despite a slight change on the chart, we have an upward movement but there is room for the price to go up, while taking into account the STOCH indicator, it is clear that we are approaching the upper limit, which may result in another recovery and only then a larger upward move.

Binance Coin (BNB) -> Another 500% RallyMy name is Philip, I am a German swing-trader with 4+ years of trading experience and I only trade stocks , crypto , options and indices 🖥️
I only focus on the higher timeframes because this allows me to massively capitalize on the major market swings and cycles without getting caught up in the short term noise.
This is how you build real long term wealth!
In today's anaylsis I want to take a look at the bigger picture on Binance Coin .
You can perfectly see that Binance Coin is forming quite strong support at the psychological $200 level from which we already saw multiple bullish rejections.
However since Binance Coin is approaching this level with lower highs, I am personally waiting for a breakout of the current bullish continuation triangle pattern.
- - - - - - - - - - - - - - - - - - - -
I know that this is a quite simple trading approach but over the past 4 years I've realized that simplicity and consistency are much more important than any trading strategy.
Keep the long term vision🫡

Binance Coin -> Massive Risk To RewardMy name is Philip, I am a German swing-trader with 4+ years of trading experience and I only focus on price action and market structure 🖥️
I am trading the higher timeframes because this allows me to massively capitalize on the major market swings and cycles without getting caught up in the short term noise.
This is how you build real long term wealth!
In today's anaylsis I want to take a look at the bigger picture on Binance Coin.
After the solid break and retest in June of 2020 Binance Coin followed the crypto bullrun and pumped more than 5.000% towards the upside. With the recent -70% correction Binance Coin is forming a triangle pattern and if we see a breakout I do expect a massive pump again.
- - - - - - - - - - - - - - - - - - - -
When the market moves where, and how, and if - these are all unknown.
The only thing which you can control is your risk.
- Philip Basic Trading -
Keep the long term vision🫡

BNB => Ascending channel retest 🚀🚀🚀Binance Coin (BNB) has emerged as one of the stalwarts in the cryptocurrency space, showcasing remarkable strength and resilience. Let's delve into the fascinating world of BNB's price action, particularly its impressive ascending channel on the weekly chart, and explore the potential for a bullish breakout.
Binance Coin's Ascending Channel: A Powerhouse of Potential
The weekly chart reveals BNB's remarkable performance within an ascending channel.
This channel represents an area where BNB's price oscillates upward within well-defined boundaries.
Ascending channels often serve as powerful indicators of a bullish trend.
Anticipating a Fakeout: A Clever Strategy
As BNB moves within the confines of this ascending channel, traders should be aware of a potential fakeout.
A fakeout occurs when the price temporarily breaks below the channel, tricking traders into selling.
Look how fakeout can be done :
A fakeout is a strategic move by whales and market participants to shake out inexperienced traders.
The Art of the Retest: A Bullish Sign
Should BNB execute a fakeout, it often follows up with a retest of the ascending channel's upper boundary.
The retest serves as a validation of the channel's significance and a strong bullish signal.
Experienced traders often view retests as prime entry points for long positions.
BNB's Weekly Strength: An Encouraging Indicator
BNB's ability to maintain its upward momentum on the weekly chart is a promising sign.
Strength on the weekly timeframe is often seen as a sign of potential further growth in the mid to long term.
Conclusion: Seizing the Binance Coin Opportunity
As Binance Coin demonstrates its strength within the ascending channel, traders and investors have the chance to make informed decisions and capitalize on potential opportunities. Understanding the nuances of a fakeout and the subsequent retest can be a strategic advantage.
While the cryptocurrency market remains dynamic and unpredictable, recognizing and leveraging these patterns and signals can empower traders to navigate the ever-evolving landscape.
Remember to employ sound risk management practices and stay informed. Engaging in discussions, sharing your insights, and being part of the crypto community can be invaluable in this exciting journey. 🚀💼🌐
❗See related ideas below❗
Feel free to like, share, and leave your thoughts in the comments.💚🚀💚
