BNB/USDT 4HInterval Resistance and SupportHello everyone, let's look at the BNB to USDT chart on a 4-hour time frame. As you can see, the price is moving below the local uptrend line.
Let's start with the support line and as you can see the first support that is currently holding the price is $ 303.4, if the support is broken then we can see the price drop to around $ 274. At this point, it is worth marking a strong resistance zone from $ 304 to $ 297, taking into account the entire upward movement.
Now let's move to the resistance line, as you can see the first resistance is $ 313, if it breaks down, the next resistance will be $ 320.6, $ 326.4 and then we have a strong resistance zone from $ 332 to $ 341.
Looking at the CHOP indicator, we see that there is still some energy for the move, the MACD maintains a downward trend, while the RSI has touched the lower limit, which may give a temporary price increase, but in the longer term I expect a further correction.
BNBUSDT

ETHUSDT D :WOW NICE PATTERNHi Guys Hope you well,
In the daily time frame, the structure has changed from bearish to bullish. According to the dominance of Bitcoin, I expect to drop to demand zone on H4 and then move upwards with rapid movement. But in case of further decline, it is possible to reach the demand area in daily time around 1400. In case of further analysis in lower timeframe, enter our channel.
SecondChanceCrypto
⏰11/May/23
⛔️(DYOR)
always do your research.
If you have any questions, you can write them in the comments below, and I will answer them.
And please don't forget to support this idea with your likes and comment.

BNB is going up for short term ?In my opinion, we are currently in a safe zone in terms of the price move down, within the Order Block area. Despite the recent Wyckoff pattern reversal, there is still a high potential for the price to rise up to the defined levels in the image.

Binance Coin shortSymmetrical triangle on Binance Coin chart is broken down. Bearish movement to support level at 290 expected to happen.


Short BNB to 276 $The chart is simple. In the case of a bearish market and Bitcoin moving towards $25,000 and below, the first support of Binance Coin is at the bottom of the daily ascending channel. You can open a sell transaction for Binance Coin with capital management if the $27,000 Bitcoin support is lost.

BNB - More downside coming! It is evident that a triangle pattern has formed in the price chart, and recent price action indicates that the upper trendline has acted as a strong resistance level. Based on this observation, the price is expected to move towards the lower boundary of the triangle if it continues to trade within this pattern. However, if the price breaks below the triangle, support zone 1 and support zone 2 are likely to be the first and second targets, respectively. Also, the fair value gap is acting as a magnet, and the price is expected to close the gap soon!
It is worth noting that if BTC experiences a downward trend from its current level, BNB is also likely to continue its trajectory to the downside. This possibility is further reinforced by the expectation of a downward move in BTC, which will inevitably affect the price of BNB.


pepeusdt h1Hi guys ,
Another meme coin,
SecondChanceCrypto
⏰09/May/23
⛔️(DYOR)
always do your research.
If you have any questions, you can write them in the comments below, and I will answer them.
And please don't forget to support this idea with your likes and comment.

BNBUSDT DailyHi Guys Hope you well,
if you follow me you remember my last bnb analysis.
SecondChanceCrypto
⏰09/May/23
⛔️(DYOR)
always do your research.
If you have any questions, you can write them in the comments below, and I will answer them.
And please don't forget to support this idea with your likes and comment.

bnbusdt 15minThe move I have for this currency is 15 minutes
There is something you see on the chart.

BNBUSDTHello again,
*Mars Signals Team wishes you high profits*
This is a 4-hour-time frame analysis for BNBUSDT
As we analyzed on May 7, we predicted a falling trend to happen and here we can see this decline which equals our precise prediction. R3 on the top of this chart is a resistance area which represents the disability of the price in order to rise. R2 and R1 used to be support areas. And we have S1 that is our long-term support area and demonstrates the support of price at various points even since the past. As it is clear in this chart, the price was able to be supported well at S1 area and after having a great increase up to higher amounts, it was not successful at being supported more and was rejected then. Ultimately by falling toward R2 area and losing the support again via some negative Marubozu Candles, it moved below R1 and then received support at S1 and now we see its fluctuation over this area through some positive candles. Hence it is fluctuating below R1 after losing the support at the symmetrical triangle pattern and we believe it would resume its neutral behavior at its current point, and via more support and via providing us some confirmation candles for the purpose of a rise, more increase will happen then up to some higher amounts. But wait for the retesting process when the price touches S1 and then enter trading and wait for the time to withdraw your profits. Possibly, if the price loses the support at S1, it would experience more decline then. So if the price loses the support and falls downward, more fall is probable at that time down to S2. This area is great to put your orders but you must be attentive and wait for the well support of price at this point and then by a retest and being sure of a rise, it is suggested to enter trading. Remember that by the time the price does not mover over R5 area and fixes itself there, we won’t have the expectation of a rising behavior for it. It is better to activate your stop-loss point and check every detail and information before putting your trade orders and then wait for a proper time to have your next actions. In case you are looking for wise trades and less risky actions, our suggestion will be following our regular updates all the time.
Warning: This is just a suggestion and we do not guarantee profits. We advise you to analyze the chart before opening any positions.
Take care

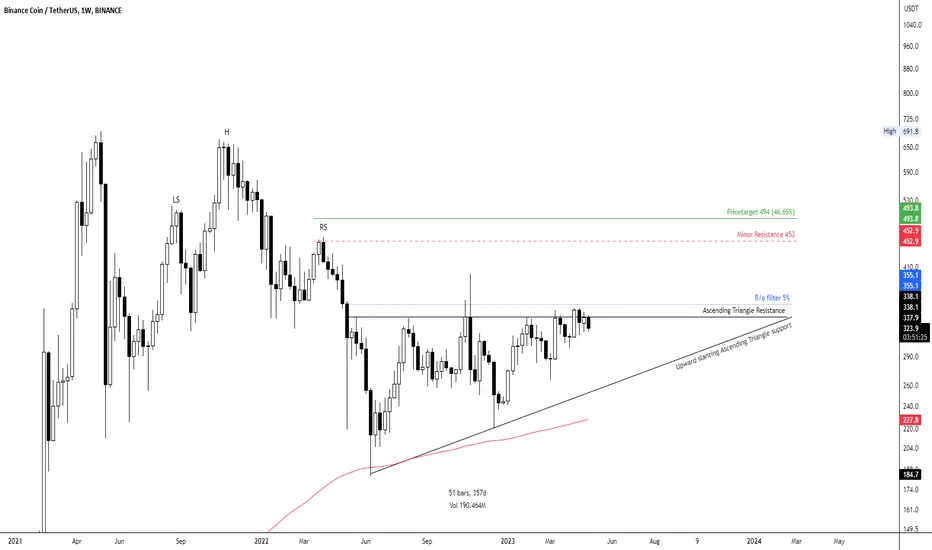
Binance Coin WCA - Ascending Triangle PatternHello and thank you for taking the time to read my post. Today, we analyze the Binance Coin (BNB) chart on the USDT pairing on the weekly scale, focusing on a classic price pattern called the "Ascending Triangle Pattern."
Ascending Triangle Pattern:
The ascending triangle pattern is a bullish continuation pattern that usually forms during an uptrend. It is characterized by a horizontal resistance line and an upward-sloping support line, representing higher lows. The pattern indicates that the buyers are gradually gaining control as they push the price higher, leading to an eventual breakout above the resistance line.
Analysis:
The general trend for Binance Coin was bearish since 08/11/2021, with the head and shoulders pattern marking the top. However, from 20/06/2022 onwards, we entered a consolidation movement characterized by an ascending triangle price pattern. This pattern displays multiple touchpoints on the horizontal resistance and two clear wicks as diagonal upward slanting support. All of this occurs above the 200 EMA, suggesting a bullish environment i.e a bullish continuation.
Price Targets and Resistance Levels:
The price target for this pattern is set at 494, representing a ~46% price increase from the current level. On the way to the target, we may face minor resistance at 453. A breakout above the horizontal resistance line would be a strong signal to enter a trade.
Breakout Filter:
A breakout filter of 5% helps to avoid false breakouts and premature entries. We will continue to monitor the chart closely for any signs of a breakout. Until then, this trade remains a watchlist candidate.
Conclusion:
The Binance Coin weekly chart analysis highlights the ascending triangle pattern, indicating the potential for a bullish continuation. As we wait for a breakout above the resistance line, traders should closely monitor this chart and consider proper risk management and position sizing before entering any trade.
Please note that this analysis is not financial advice. Always do your own due diligence when investing or trading.
If you found this analysis helpful, please like, share, and follow for more updates. Happy trading!
Best regards,
Karim Subhieh
BNB/USDT 4HInterval Resistance and SupportHello everyone, let's look at the BNB to USDT chart on a 4-hour time frame. As you can see, the price is moving at the lower border of the local triangle.
Let's start with setting the support line and as you can see the price stays right at the very strong support at $ 323.5, if the support is broken then the next support is $ 317.6 and $ 310.3.
Now let's move on to the resistance line, as you can see the first resistance is $ 326.9, if you manage to break it, the next resistance will be $ 334.2, $ 340.3 and $ 346.3.
Looking at the CHOP indicator, we see that there is still energy for movement, MACD indicates that we are on the verge of entering a local uptrend, while the RSI shows that a small price movement causes a large movement on the indicator, which in the short term may negatively affect the price.

BNB to see price rejection at recent lower highPrice action edged closer to the recent high, near $328. A move above the FVG zone ($331.5 - $333.7) and a lower high on 1 & 2 May could see a sell-off.
The likely drop could hit the support zone of $316 - $320 (cyan). The support has been steady since mid-March.
A close above the lower high ($336) will be an invalidation.
Entry: $331.5 (FVG’s lower boundary)
Target: $320 (support zone’s upper boundary)
Stop-loss: $336 (lower high on 1 & 2 May)
RR (Risk-Reward): 2.5

Binance Coin: will $320 hold?News are reporting that the level of coins held with Binance exchanger are modestly returning after an outflow caused by the negative news which surrounded this exchanger in the previous period. However, the price of BNB is staying within a relatively lower range. After not being able to clearly break the $350 resistance line some three weeks ago, the coin found a support level around $320. BNB started the previous week around $340, but soon reverted to the down side, reaching its lowest weekly level at $320, where the coin is finishing the week.
RSI continues to move around level of 50, however, it seems that the market is more oriented toward the oversold side, rather than on the opposite. Moving average of 50 days slowed down its divergence from MA200 counterpart. It might be just a short break, however, if the move continues, it might lead toward the so-called “dead cross” in the coming period.
Charts continue to point on a short-term reversal in the coming period. During the previous week, a short support line at $320 has been clearly tested. The coin still manages to hold above this level, however, in case of persistent selling orders, it might be breached. In this case, the coin will test $300 short term stop, with currently low potential for $280. In case that a move toward the upside occurs, it could be until level of $330. A move toward the $350 resistance line is not probable based on charts at this moment.
