Binance Coin longBinance Coin bounced off the lower boundary of descending channel. Bullish movement to resistance level at 424 is possible.
Bnbusdtlong

BNB Scalp Idea!Our old friend BNB needs some help padawan, he is totally oversold. What does this mean
Hand me my lightsaber


BNBUSDT, Can not broke resistanceHello everyone
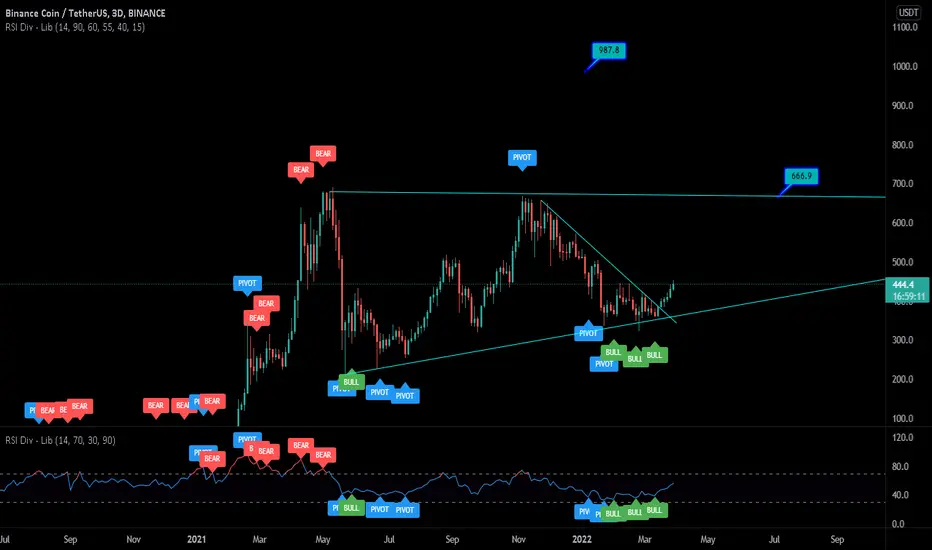
According to the chart and as you can see the condition of all financial markets, the price of BNB accept the condition of market and from months ago the price is moving is downward trend and according to the trend the price wanna make new LL.
We expect the price can continue this movement and as you can see the price can not broke the trendline resistance the chance for droping is going more to be happen this.
We have some advice for everyone that is working and trading in this market : Go and save your money and be ready to tell you when its time to buy buddy
Be lucky guys
Abtin
Previous analysis :

BNB/USDT SHORTER TF TRADE SETUP!!Hi guys, This is CryptoMojo, One of the most active trading view authors and fastest-growing communities.
Do consider following me for the latest updates and Long /Short calls on almost every exchange.
I post short mid and long-term trade setups too.
Let’s get to the chart!
I have tried my best to bring the best possible outcome in this chart, Do not consider it as an
BNB is breaking out from the falling wedge in the daily time frame and also looks like a bullish flag-like structure.
Entry range:-$420 TO $430
Target: 10%
SL:- $405
This chart is likely to help you in making better trade decisions if it did consider upvoting this chart.
Would also love to know your charts and views in the comment section.
Thank you

BNBUSDT INVERTED HEAD AND SHOULDER POSSIBILITYThis month is Ramadan. because of that, I can't update too often for signals on TradingView for free. But here, I will briefly explain where the possibility of BNBUSDT will move. BNB has quite strong support in the +- $400 area. and the market is starting to show fear. as you know. Buy when the market is fear and sell when the market is greed. BNB buy signal:
BUY: 400 - 390 - 380
SELL: 420 - 435 - 440 - 450 - 470++
SL: Daily close under 300
Leverage: 10x (3% max margin)
Hope you enjoy this.

BNB/USDT IS READY TO PUMP!!Hi guys, This is CryptoMojo, One of the most active trading view authors and fastest-growing communities.
Do consider following me for the latest updates and Long /Short calls on almost every exchange.
I post short mid and long-term trade setups too.
Let’s get to the chart!
I have tried my best to bring the best possible outcome in this chart, Do not consider it as an
BNB is breaking out from the falling wedge in the daily time frame and also looks like a bullish flag-like structure.
Entry range:- $380-$420
Target1:- $508
Target2:- $572
Target3:- $650
Target4:- $840
SL:- If any daily candle closes below $400 then I'll exit.
This chart is likely to help you in making better trade decisions, if it did do consider upvoting this chart.
Would also love to know your charts and views in the comment section.
Thank you

#BNB/USDT 2DAY UPDATE BY CRYPTOSANDERS#BNB/USDT 2day analysis in the chart
I have tried my best to bring the best possible outcome in this chart.
Hello members welcome to BNB/USDT 2D chart update by CRYPTOSANDERS.
First hit the like button and follow me, this motivates me to bring this kind of regular chart analysis.
As we can see from the above-mentioned chart that BNB/USDT broke the symmetrical triangle pattern and currently moving down to retest the upper trend line, for the bull trend we need a retest so we should wait for confirmation.
If it broke down the lower trend line and moves back inside then this chart will be invalidated.
This is not a piece of financial advice.
Sorry for my English it is not my native language.
Do hit the like button if you like it and share your charts in the comments section.
thank you.

BNB/USDT 8 HOURS ANALYSISHi guys, This is CryptoMojo, One of the most active trading view authors and fastest-growing communities.
Do consider following me for the latest updates and Long /Short calls on almost every exchange.
I post short mid and long-term trade setups too.
Let’s get to the chart!
I have tried my best to bring the best possible outcome in this chart, Do not consider it as an
BNB is breaking out from the falling wedge in the daily time frame and also looks like a bullish flag-like structure.
Entry range:- $420-$440
Target1:- $508
Target2:- $572
Target3:- $650
Target4:- $840
SL:- If any daily candle closes below $400 then I'll exit.
This chart is likely to help you in making better trade decisions, if it did do consider upvoting this chart.
Would also love to know your charts and views in the comment section.
Thank you

#BNB/USDT WEEKLY UPDATE BY CRYPTOSANDERSWelcome to this quick BNB/USDT analysis.
I have tried my best to bring the best possible outcome in this chart.
Hello, members welcome to the BNB/USDT chart updates by CRYPTOSANDERS.
As we mentioned in our previous chat that BNB was trading on the lower trend line and will bounce to the Yello MA or GREEN ZONE. Till now it moved in the right way.
In the current scenario, we are expecting that it will break the yellow MA and bounce all the way to the upper trend line in the upcoming days.
This is not a piece of financial advice.
Sorry for my English it is not my native language.
Do hit the like button if you like it and share your charts in the comments section.
Thank you...


BNBUSDT Analysis (LOCAL VISION)Hello friends.
Please support my work by clicking the LIKE button👍(If you liked). Also i will appreciate for ur activity. Thank you!
Everything on the chart.
Entry: market and lower
Target: 480 - 520 - 540
after first target reached move ur stop to breakeven
Stop: 380 (depending of ur risk). ALWAYS follow ur RM .
Risk/Reward: 1 to 2
risk is justified
Good luck everyone!
Follow me on TRADINGView, if you don't want to miss my next analysis or signals.
It's not financial advice.
Dont Forget, always make your own research before to trade my ideas!
Open to any questions and suggestions.

BNB IS READY TO GO FOR NEW ATM LONG LONGHi guys, This is CryptoMojo, One of the most active trading view authors and fastest-growing communities.
Do consider following me for the latest updates and Long /Short calls on almost every exchange.
I post short mid and long-term trade setups too.
Let’s get to the chart!
I have tried my best to bring the best possible outcome in this chart, Do not consider it as an
BNB is breaking out from the falling wedge in the daily time frame and also looks like a bullish flag-like structure.
Entry range:- $420-$440
Target1:- $508
Target2:- $572
Target3:- $650
Target4:- $840
SL:- If any daily candle closes below $400 then I'll exit.
This chart is likely to help you in making better trade decisions, if it did do consider upvoting this chart.
Would also love to know your charts and views in the comment section.
Thank you

BNBUSDT 1D: Possible LONGBNBUSDT 1H: Possible LONG
D1: it is possible to break through the level of 430 and then rise to the level of 500 - the first target, 670 - the second target.


BNBUSDT-LONGBased on technical factors there is a long position in :
📊 BNBUSDT Binance Coin
🔵 Long Now 397.0
🧯 Stop loss 373.0
🏹 Target 1 408.0
🏹 Target 2 432.0
🏹 Target 3 475.0
💸Capital : 1%
We hope it is profitable for you ❤️
Please support our activity with your likes👍 and comments📝

BNB/USDT DAILY TF UPDATEHi guys, This is CryptoMojo, One of the most active trading view authors and fastest-growing communities.
Do consider following me for the latest updates and Long /Short calls on almost every exchange.
I post short mid and long-term trade setups too.
Let’s get to the chart!
I have tried my best to bring the best possible outcome in this chart, Do not consider it as an
BNB is breaking out from the falling wedge in the daily time frame and also looks like a bullish flag-like structure.
Entry range:- CMP
Target1:- $442
Target2:- $508
Target3:- $572
Target4:- $650
Target5:- $840
SL:- If any daily candle closes below $330 then I'll exit.
This chart is likely to help you in making better trade decisions, if it did do consider upvoting this chart.
Would also love to know your charts and views in the comment section.
Thank you

#BNB/USDT 2HOUR UPDATE BY CRYPTOSANDERSWelcome to this quick BNB/USDT 2hour analysis.
I have tried my best to bring the best possible outcome in this chart.
Hello members welcome to our BNB/USDT quick update
As we can see in this chart that BNB created an inverse HEAD AND SHOULDER pattern inside the triangle pattern and it broke the upper trend line and moved to retest the upper trend line which will be the confirmation that we can take some position at that level.
In the current scenario, we should wait for confirmation.
If BNB breaks down the upper trend line and moves again inside the triangle then this chart will be invalidated.
Entry;-$399
Target:-80% TO 100%
Stop loss:-$390
With leverage 3x to 5x
Share your views in the comment section.
Remember:-This is not a piece of financial advice. All investment made by me is under my own risk and I am held responsible for my own profit and losses. So, do your own research before investing in this trade.
Happy trading.
Sorry for my English it is not my native language.
Do hit the like button if you like it and share your charts in the comments section.
Thank you...

#BNB/USDT WEEKLY UPDATE BY CRYPTOSANDERSWelcome to this quick BNB/USDT analysis.
I have tried my best to bring the best possible outcome in this chart.
Hello Members, welcome to our BNB/USDT weekly update.
As we can see Bnb is currently trading on a lower trend line inside a rising wedge pattern which is a bullish continuation pattern.
Looking to the current scenario it can bounce from the green zone $358 - $400 and go up to the resistance level which is $620-$700.
So there is a high chance that we can see a bullish trend in BNB/USDT.
MACD (moving average convergence divergence) also shows a bullish crossover.
If btc moves in the right direction.
This chart will be invalidated if it breaks down the lower trend line and retests.
Thank you,
Happy trading.
Remember:-This is not a piece of financial advice. All investment made by me is under my own risk and I am held responsible for my own profit and losses. So, do your own research before investing in this trade.
Happy trading.
Sorry for my English it is not my native language.
Do hit the like button if you like it and share your charts in the comments section.
Thank you...

BNB IS READY TO GO FOR NEW ATM LONGHi guys, This is CryptoMojo, One of the most active trading view authors and fastest-growing communities.
Do consider following me for the latest updates and Long /Short calls on almost every exchange.
I post short mid and long-term trade setups too.
Let’s get to the chart!
I have tried my best to bring the best possible outcome in this chart, Do not consider it as an
BNB is breaking out from the falling wedge in the daily time frame and also looks like a bullish flag-like structure.
Entry range:- $360-$370
Target1:- $442
Target2:- $508
Target3:- $572
Target4:- $650
Target5:- $840
SL:- If any daily candle closes below $330 then I'll exit.
This chart is likely to help you in making better trade decisions, if it did do consider upvoting this chart.
Would also love to know your charts and views in the comment section.
Thank you

BNBUSDT Analysis (LOCAL VISION)Hello friends.
Please support my work by clicking the LIKE button👍(If you liked). Also i will appreciate for ur activity. Thank you!
Everything on the chart.
Entry: market and lower
Target: 460 - 500 - 550
Stop: ~315 (depending of ur risk). ALWAYS follow ur RM .
Risk/Reward: 1 to 3
risk is justified
Good luck everyone!
Follow me on TRADINGView, if you don't want to miss my next analysis or signals.
It's not financial advice.
Dont Forget, always make your own research before to trade my ideas!
Open to any questions and suggestions.

BNB Binance Coin Price Targets and Stop LossBNB/USDT
Entry Range: $361 - 385
Price Target 1: $413
Price Target 2: $430
Price Target 3: $471
Stop Loss: $334
