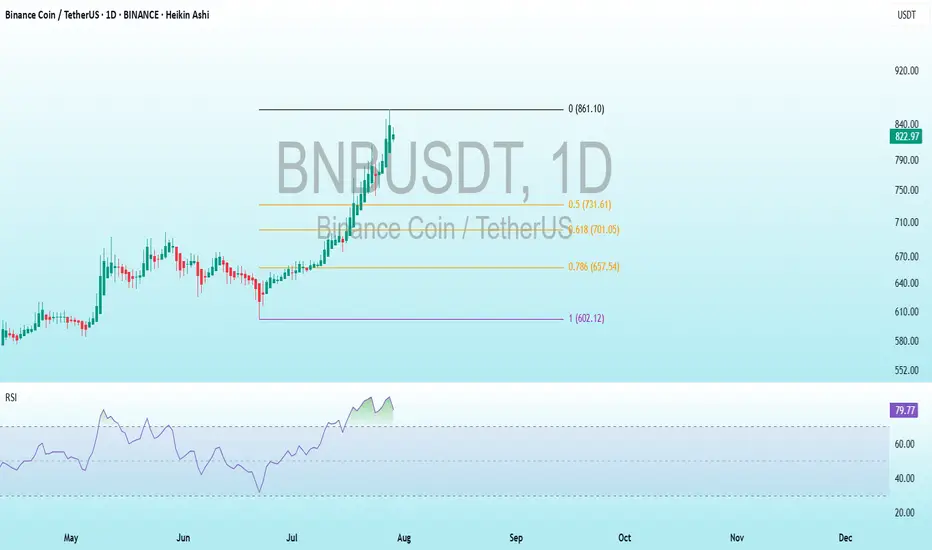
BNB Bearish DivergenceBINANCE:BNBUSDT
Trade Setup:
Target 1: 731.61 (0.50 Fibonnaci Golden Zone).
Target 2: 701.05 (0.618 Fibonnaci Golden Zone).
Target 3: 657.54 (0.786 Fibonnaci Golden Zone).
Target 4: 602.12 (1 Fibonnaci).
Stop Loss: 861.10 (above recent high, ~25% above current price).
RSI Analysis: The RSI shows a bullish divergence (price making lower lows while RSI makes higher lows), suggesting potential upward momentum. Current RSI is around 79.74, nearing overbought territory (>70), so caution is advised.
Bnbusdtshort
BNB to Make History Before 2026 BeginsCRYPTOCAP:BNB is setting up for something big. Price is holding strong above the rising support line, with the 50 EMA acting as dynamic support.
It's consolidating just below the all-time high — a classic sign of strength. Structure looks solid, momentum is building, and the chart favors bulls.
Mark my words — BNB will not only retest its ATH, but break it and go beyond before the year ends.
DYOR, NFA

BNBUSDT sell/shortBy utilizing levels, historical patterns, , we can formulate a hypothesis that the market might follow a similar trajectory if bearish sentiment prevails.

BNB at a Crossroads: Can It Hold Above $600?BNB has been making headlines with rising trading volumes and growing ecosystem interest, particularly around meme coins like TST. But while attention is increasing, BNB’s price has slipped over 3% this week, showing that hype alone isn’t enough to sustain momentum.
Technical Indicators Signal Uncertainty
BNB’s Directional Movement Index (DMI) paints a picture of indecision:
📊 ADX at 14 – Trend strength remains weak after fluctuating between 11.1 and 16 in recent hours.
📉 +DI (Buyers) at 22.5 – Briefly surged but lost steam after peaking at 30.3 earlier.
📈 -DI (Sellers) at 23.5 – Gaining momentum, up from 14.2 yesterday.
Meanwhile, the EMA lines are tightening, signaling consolidation rather than a decisive uptrend or downtrend. The Ichimoku Cloud also leans bearish, suggesting BNB is at a critical moment.
What’s Next for BNB?
📌 Bullish Scenario – If BNB holds its ground, it could regain momentum and retest key resistance levels.
📌 Bearish Scenario – If selling pressure continues, BNB risks falling below $600 in the short term.
Despite its ecosystem growth and increased trading volume, the market’s hesitation shows that investors are waiting for a clear direction. Will BNB bounce back or break down?

BNBUSDT - SHORT [Daily Signal]With each signal of movement for the dominant BTC, it is logical to expect movement in the same direction of the rest of the coins (with rare exceptions).
Circles mean what they mean, you know.
Stay tuned.

BNB retracing back to 50%??this could be possible
the on monthly and weekly we can see the price action is sell on high and buy on low, and price recently hit the high and forming triangle on the daily time frame
we can see rsi falling and with price it could be bearish divergence
450-425 is the 50% from the swing low
let see how the structure forms .......

BNBUST | Short H4 | Market Exec |Technical Confluences for Trade:
- Stochastics are in Overbought Conditions on H4 time-frame
- Price action is close to a Resistance Trendline & a Consolidation are
- Price action may reverse back towards the previous Demand Zone
Suggested Trade:
Entry @ Area of Interest 560 - 570
SL @ 580.66
TP 1 @ 552 (Close Half-Position & move SL to Entry level once TP1 is achieved)
TP 2 @ 535.15
Risk-to-Reward @ Approx. 2.18 (Depending on Entry Level)
________________________________
Boosts 🚀, Follows ✌️, Shares 🙌 & Comments ✍️ are much appreciated!
If you have any ideas or charts, do share them in the 'Comments' section below and we can discuss our perspectives to improve or strengthen our strategies.
If you want something analyzed, do drop me a DM. :D
________________________________
Disclaimer: The above suggestion is an personal opinion in general and does not constitute as investment advice. Any decisions taken based on the above suggestion is purely your own risks.
Any websites / brokers / applications suggested here are also provided as informational purpose only.
________________________________

Strat Crash Market...?(BNB)📊Analysis by AhmadArz:
We are in bear market if breakout supporte price 300$.
🔍Entry: 330
🛑Stop Loss:349
🎯Take Profit: 317 -307 -292 -277
🔗"Uncover new opportunities in the world of cryptocurrencies with AhmadArz.
💡Join us on TradingView and expand your investment knowledge with our five years of experience in financial markets."
🚀Please boost and💬 comment to share your thoughts with us!

BNB SHORT SIGNAL 15MINHello dear traders
I came with a short-term short signal in the BNB currency in the 15-minute time frame.
Entry point, loss limit and profit limit are shown in the picture.
In the specified area, we will expect a price reaction in the direction of shorts.
Thank you for your support

BNBUSDT - W1\D1BNBUSDT
W1 – Trend towards the development of the “Triangle” model – 171
D1 – The 2nd triangle in a row has been formed, which may lead to the prospect of a decrease in activity. For the best entry, it is better to wait for consolidation after breaking through the triangle line. Dates 183–171
What can you expect?
Breaking through the triangle line is the nearest target, breaking through the inclined line is 206 and the nearest target is 196.
Short
Targets – 196.8 – 183.9 – 171.9

BNB - BUY targets about to hit 💰📉Hi Traders, Investors and Speculators of Charts📈📉
Binance coin is oversold, but our technical indicator has not yet flashed the "Extreme Oversold". This indicates that it's possible to see one more move downward (even if it's just a wick) before the RSI corrects from being Oversold.
BNBUSDT looks like it's about to hit my spot buy targets with the traditionally approach of buying low and selling higher at the first and second resistance zone. Leverage trades often get shaken out by algorithms, spot trading could be strategically used to buy lower and sell higher; old school style.
_______________________
📢Follow us here on TradingView for daily updates and trade ideas on crypto , stocks and commodities 💎Hit like & Follow 👍
We thank you for your support !
CryptoCheck
CRYPTOCAP:BNB BINANCE:BNBUSDT

BNBUSDT: Prepare for a Severe Drop, Potential to Fall Below $150Hi Fellow Traders,
BNBUSDT has broken out of the symmetrical triangle pattern and is possibly heading for a crash. The price is plummeting below the lower trendline and has crossed below the EMA 200 line, signaling a strong bearish trend. To make matters worse, a Bearish Inverted Hammer has appeared after bouncing off the base pattern. This deadly combination of technical factors suggests a sharp decline to the first target area. Then, we might see a brief rebound to the blue zone area before another dive to the second target area.
Negative Sentiments
1. lawsuits filed by the U.S. Securities and Exchange Commission (SEC) against Binance and Coinbase
2. The SEC accuses Binance of selling unregistered securities and Coinbase of offering a lending program that violates securities laws.
3. These lawsuits are part of a broader regulatory crackdown on the crypto industry and they could have significant implications for the future of cryptocurrencies. The possible outcomes of the lawsuits, such as settlements, fines, or bans, and how they could affect the crypto market and innovation.
It is essential to note that the analysis will no longer hold validity once the target/support area is reached.
Please support the channel by engaging with the content, using the rocket button, and sharing your opinions in the comments below!
Disclaimer:
"Please note that this analysis is solely for educational purposes and should not be considered as a recommendation to take a long or short position on
BINANCE:BNBUSDT ."

Future - BNB Sell: 242.4 -242.8
Stop: 243.2
TP: 2R and above with stop entry. Maximum TP: 231-234
Thank for your following. Like and share if you love my signal

BNBUSDTBNB's main trend is upward, but in my opinion, in the short term, we will have a correction to the range of 270 to 260. Right now, an important trend line has been broken and after a pullback, I expect the price to drop. If this happens, the next supports can be 285 and 270. You can see the rest of the story in the chart.
⚠️"Daily crypto market analyses I provide are personal opinions & not financial advice. Trading carries risks, so do your own research & seek advisor's help."

BNB to see price rejection at recent lower highPrice action edged closer to the recent high, near $328. A move above the FVG zone ($331.5 - $333.7) and a lower high on 1 & 2 May could see a sell-off.
The likely drop could hit the support zone of $316 - $320 (cyan). The support has been steady since mid-March.
A close above the lower high ($336) will be an invalidation.
Entry: $331.5 (FVG’s lower boundary)
Target: $320 (support zone’s upper boundary)
Stop-loss: $336 (lower high on 1 & 2 May)
RR (Risk-Reward): 2.5

Bnb Hold The Support Or Die Bnbusdt
"If there is a breakdown , I am anticipating a significant drop in value. It is crucial for BNB to maintain the support level that I have indicated on the chart. A breakdown of this support level could lead to a further drop in value, potentially down to the range of 310-260."

Bnb short term tradeWell guys looking to short BnB short term based off narrative to to at the nearest liquidity (bread and butter setup)

BNB like on a roller coasterI'm testing another likely trade, please take it with a grain of salt, low leverage. I could be 99% wrong as always, don't take this as financial advice and do your own analysis and consider the risks =D trade wisely and good luck

BNB/USDT ShortFirst of all BNB broke that Descending Triangle and then tested that resistance level 3 times and made a pin candle at resistance/demand zone. The volume is also in the favor of bearish trend.
Entry: 303.1$
SL: 309$
TP1: 300.8$
TP2: 298.1$
TP3: 294.2$
TP4: 292.6$
TP5: 291$
TP6: 284.6$

BNBUSDT 4H: Possible SHORT#BNBUSDT The market has the potential for an downtrend to 270$
Main target 270$
SL 315$

BNBAccording to the pattern of the head, we expect a drop. Please note that the European and American markets are closed, so be sure to use stop

We can set 3 possition For BNB Nowas the area we can set 3 different Position For BNB
if BNB stabled in Support Line (white Line) we can have a Long Position
But If BNB breaks the support Line, we Can Enter a Short position on the pullbacks as shown in the chart.
when the Shot Position Completed, we can set a Long Position open that area.
you should know this is not an investment suggestion and all risks is on your Own.

SHORT BNB USDT Short BNBUSDT at 280.5. Reaction would break 270. Price moving to the DP to break a important level at 280 and will give a reaction that will engulf the previous low made at 272.
