BOEING - Time for a recovery ? ✈️Why is Boeing so important to the US and how the timing may be ideal to enter this trade in the next few days.
Boeing

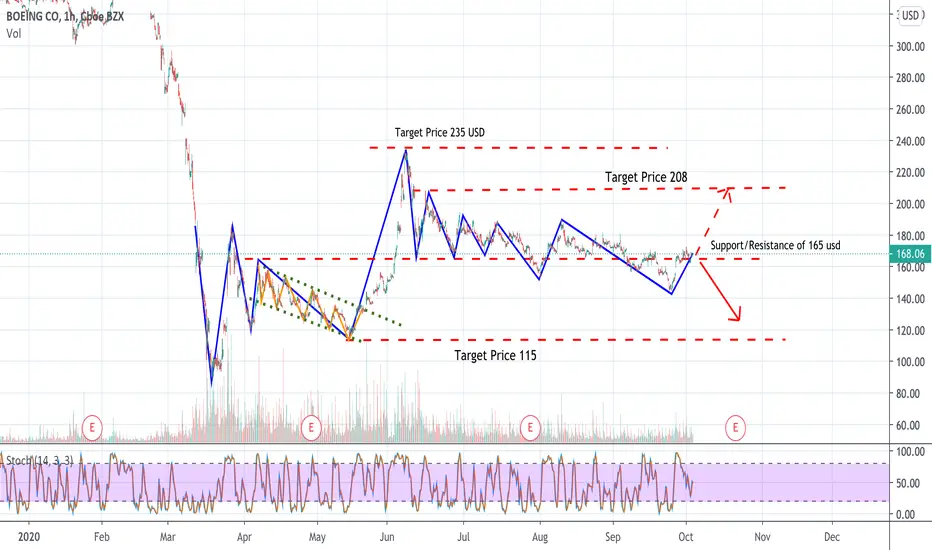
MO BOEING UPTREND● Boeing stock price has been trading for a few months in a sideways channel with a price range of $145 to $180
primarily due to uncertainties over the Coronavirus crisis and issues with its new 737 MAX plane which has
been grounded since early 2019.
● Since last week Boeing stock price started to increase after the US FAA (Federal Aviation Administration) took
test 737 MAX which is considered as a final stage before getting on the license to fly again. After the test flight,
FAA test pilot Steve Dickson said that he liked what he saw on the flight, and the stock price immediately reacted
positively despite that the final report hasn’t been released yet.
● Expectations that the FAA will soon release a final report over Boeing 737MAX and renew license for further
production of the Boeing best seller model increased investment sentiment and demand for Boeing shares on
the stock market.
● Another good news for the entire airline industry came from the US where Republicans and Democrats agreed
to help the airline industry with 25 billion dollars despite that the overall deal over economic aid stuck and
regarding the latest information delay until the presidential elections ended.
● According to the Technical analysis, the stock price breached and managed to stay above the 20-day Moving
Average, which can be considered as a first resistance level. Also, the Daily Relative Strength Index recovered
from the low 30 trying to breach above level of 50. If the value of RSI manages to breach above 50 and the stock
price remains above $160 the price may probably go up toward the Resistance 1 level of $181.

BOEING Long, Long, Long !I have posted in summer tha Boeing will gradually
rise, but now we have technical arguments for
that. The bullish pattern Sperandeo with T1,T2
and T3. T1 was crossed, now target is T2 and T3.


BOEING Stock Analysis (BA) vs Airbus Stock Analysis (AIR)BA Stock Analysis
Hold for now…It is too Risky to go long.
Airbus Stock Analysis - Airbus stock forecast today (week 03/09/20) - Air Stock Analysis
The idea is to hold

BA - Short to fiil the Gap $160, then Long to $190 in OctoberI predict NYSE:BA could drop to fill or at least back test the gap up $160 last week. Then sideway up to $190 in October.
Disclaimer

Boeing path and directionHello everyone
Boeing started a uptrend channel in march
Boeing broke this uptrend channel in SEP
price is going to retest the broken uptrend
watch for price reversal or back into the channel for resume of uptrend
watch key notes on chart for more detail
for any question feel free to ask :)

boeing a mid term profitthe boeing is going up again a kittle
my toughts is a buy after crossing the rectangle and the reactions that made to the 0.618 little 2nd wave fibo (black line)
and the tp i made is the 0.618 big 1st fibo (blue line)
and even it in a big chart pattern it could break it it made a support pritce on the pattern on nearly price 160
like share and follow if it was helpful


$BA 200 Ma's Mimic 50 Ma's Cross - Heavy BullishPosting again, I've been playing with curved channels trying to see how many taps the trends get on each line and see how "tense" the bends get and how they launch, break, or snap the price in any direction. Here we see the initial rally post Covid correction I have 1 50 EMA (green) and a 50 MA(red) to try and create a clearer signal for shorter term bullish conditions or simple upward movements. I also use the same mix for my 200's EMA (blue) MA (Red). notice how the 50's crossed, even the space they created and closed between each other. We see the curve channel tighten then drop to the lower channel and launch upward. In similarity we can infer that this is about to happen as the 200's are mimicking the same shape and space as the 50's did when they crossed. The candles dipped to bottom and were supported by the long term trend line, tested the recent lows trend line from and have a strong likely hood to break through. The 2hr and 4hr Stochastics maintain momentum, while the Daily has crossed with 2D & 4D making their way. Should be a massive October!

Follow Up on Long Term Trend LinesFollow Up on Long Term Trend Lines - showing a curved channel funneling the trend, Recently rejected at 168 levels of bottom trend line (pink), but breaking out regardless, strong support on historical bottoms (blue) would be surprised if we don't see 190 test before Oct 10th, expecting 170 this week, with regular retests as it gains strength through 180 - 190 following breakout of channel toward +200s before EoY. See my Wyckoff example. May get shares here but mainly playing options - weekly's, October and December Monthly's plan to flip and move out as time passes.

Long Term Trend SupportLong Term Trend Lines Even recent low of 152 held this line before bouncing up to the potential breakout we may see in the coming weeks. will post following chart with closer look and a curved funnel channel that should indicate a strong move upward in the coming months given the technical set-up - that is always susceptible to external market and societal factors of course.


Boeing : Scam pump with low volume .$BA pumped almost 7% on Friday but this scam pump lack volume .
Probably this jump will fade and will resume the downtrend .


BOEING engine downcrappy situation for BOEING, if AIRBUS is crashing hard, Boeing will not laugh. I'm opening a short to 142$ after market opening today and after a possible small bounce up.
Watchout when RSI or MFI will touch 20 since it can trigger a buy the dip. Possible regression to the mean with a rally to 160 before going down (highly unlikely).
PT1:141$
PT2:120$ for October if Market in bear mode
Stop if SP500 rallies or big news coming.

BA POTENTIAL MOVE COMING!BA here looks to be tightening up in this symmetrical wedge. A healthy exit away from this wedge is likely to signify a huge move either way.

Boeing Range boundStruggling to pick a direction many airlines stocks have been stuck in a range bound pattern which is also seen here in Boeing (BA). Currently back towards the center of the range there is an equal opportunity for both sides to see some price action. Although As volume starts to dwindle and less activity is seen for new orders of aircraft, the outlook is unclear for whats to come next.
Playing uncertainty in your favor can be of benefit when shorting options spreads.

Boeing : GOOD BYE CRUEL WORLD .A descending triangle is a bearish pattern (Very bearish in fact in the case of Boeing ) .
Usually it breaks down ,this could easly take boeing the 70$ level .
