BOEING $BA - LONG TERM SWING TRADE BOEING BREAK OUT!
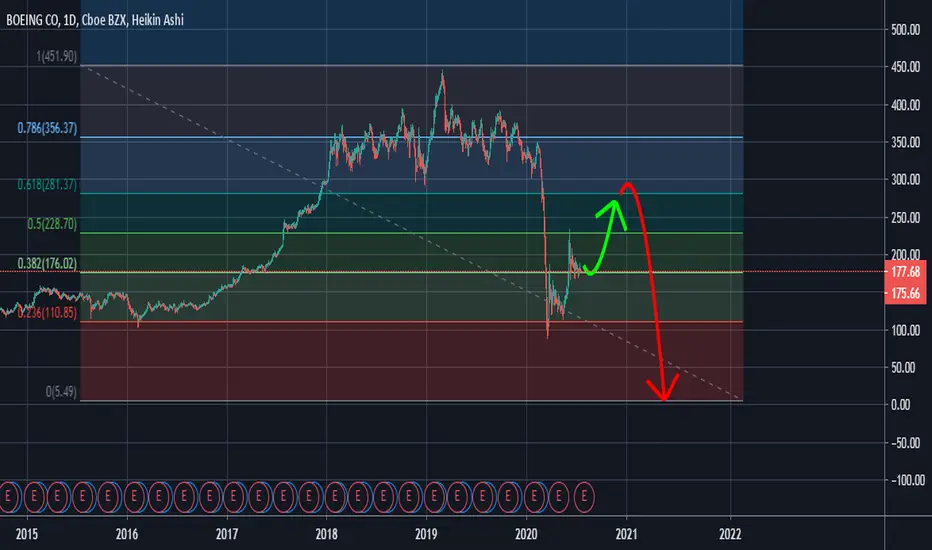
Boeing holds support near the 50MA and 100MA on the @1D TF and broke through of the violet resistance trend-line (see chart).
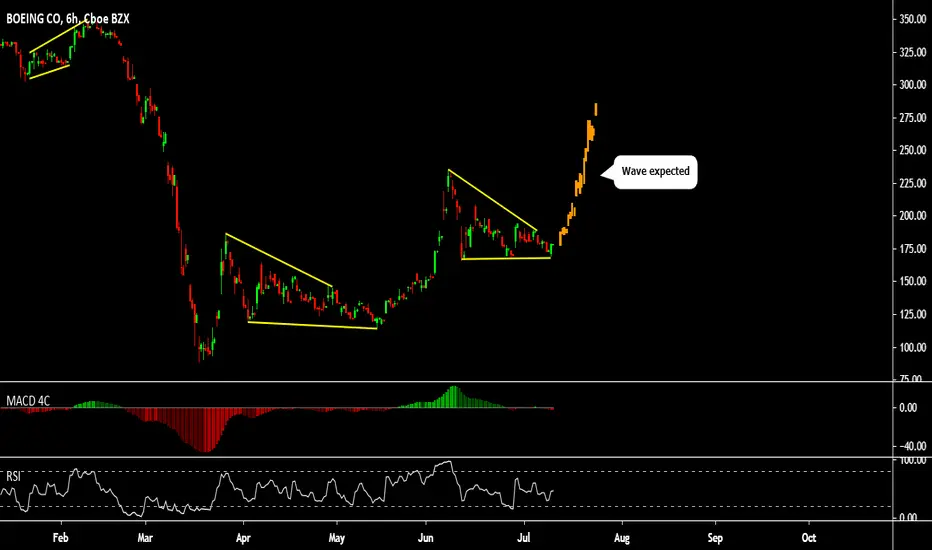
From there I think a new impulse wave will start (wave V).
Bearish momentum seems to be exhausted on several time-frames and there is significant bullish momentum on the 1M TF!
At the 1D TF I can see a bullish crossover on the Stochastics RSI, on the Wave Trend Oscillator and soon we will see a bullish crossover on the MACD too.
On the Squeeze Momentum Indicator I can see a W-pattern which is a bullish signal too!
I recommend to place TP orders below the 200MA near the 0.618 Fib retracement.
BA long position (swing trade, R:R=1.65):
Entry 1 $176.15 (R:R=1.65 @ entry#1)
Entry 2 $145.15
Tp.1 $218.8
Tp.2 $249.9
Sl $129.8
The Boeing Company is an aerospace company.
The Company's segments include Commercial Airplanes; Defense, Space & Security (BDS), such as Boeing Military Aircraft ( BMA ), Network & Space Systems (N&SS) and Global Services & Support (GS&S), and Boeing Capital ( BCC ).
Boeing recently received a $916 million deal to support International Space Station (Boeing-NASA project) for next 4 years.
Read more at:
economictimes.indiatimes.com
I´m not a financial adviser. For educational purpose only!
Boeing

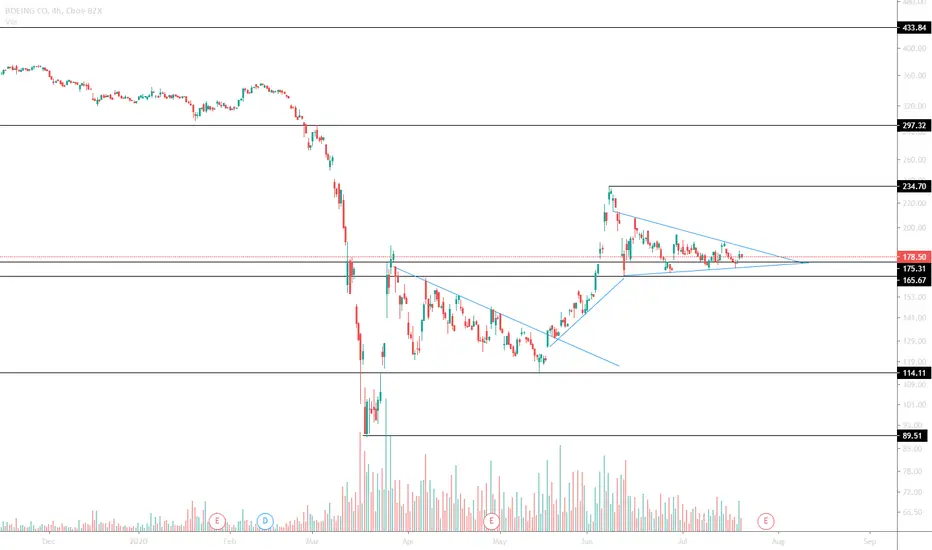
$BA- Boeing - Triangle PlaysClear Support and Resistance Levels with a clean triangle formation. Support below could aid a fake out on the short side and reversal long to $234. Breakout Long from triangle and look to enter retrace. If $234 is achieved I would target $297. If it breaks support at 165 I will look to enter short based on PAs reaction/retrace to noted levels.
BA Boeing Consolidation & WedgeBased on technical analysis it seems Boeing (BA) will be consolidating in this range quite a while until better news on vaccine and hopes of coming back to normal "new normal" materializes.
I am Bullish long term on this stock.

8.8 RR ratio $UAL LongUAL Current: 33.77 UAL. Target: 37.55. Stop target: 33.4 Bullish wedge soon to test breakout with incredible RR ratio and a high probability. Sharing exact setup.


BAI WOULD GO LONG OVER 180.
TRADE IDEA: 190C
*BA IS VERY INFLUENCED BY NEWS. SO BE CAREFUL WHEN TRADING THIS.

BA BOEING (BA/USD) LONG TERM SWING TRADE SIGNALBA/USD BREAK OUT
Buy BA stock (MT4)
Entry 1 $177.50
Entry 2 $169.50
Sl $160
Tp.1 $184.50
Tp.2 $194.50
Tp.3 $208.40
Tp.4 $214.80
The Boeing Company is an aerospace company. The Company's segments include Commercial Airplanes; Defense, Space & Security (BDS), such as Boeing Military Aircraft ( BMA ), Network & Space Systems (N&SS) and Global Services & Support (GS&S), and Boeing Capital ( BCC ). The Commercial Airplanes segment develops, produces and markets commercial jet aircraft and provides related support services, to the commercial airline industry. The Commercial Airplanes segment also produces commercial aircraft and offers a family of commercial jetliners. The BDS segment's operations involve research, development, production, modification and support of the products and related systems. The BMA segment is engaged in the research, development, production and modification of manned and unmanned military aircraft and weapons systems. The BCC segment's portfolio consists of equipment under operating leases, finance leases, notes and other receivables, assets held for sale or re-lease and investments.

Boeing Ready to Rip$BA has consolidated, coiled, found volume at support.
This could be a monster move.

BA BUY (BOEING CO)Hi there. Price is forming a continuation pattern to the upside. Watch strong price action at the current levels for buy.
$BA looks to be a safe short againWe made it past the max testing flight pump and it may break lower again. Tight stop due to stonks only go up. Good luck and make your own trades.

Wedge on BoeingAfter break up with TP around 180 USD. In my personal opinion propably Boeing hit 260 USD in nearest future, mayby after earnings. Keep looking on Boeing.

Look Up Into The Sky - AAL TARGET UPDATEWhat we have here is as typical Wedge pattern with the (E) wave ending at around 11-10 USD.
To confirm this movement we have our CCI indicator which seems to indicate that its losing steam on the downtrend.
And to all the haters saying the airline industry is gonna go bankrupt. The federal loans disagree with you.
If you want to buy, now is the time.

$boeing long chartLarge timeframes here boys we are playing big swings. be bullish. US defense contractor. You think the Military is going out of business? then short boeing. I am LONG.

TIME TO BUY BOEINGThe green line is TP1-2-3 and stoploss is 165
If you like me follow me on this telegram @huytran67

BAThe Boeing Company (BA) has been forming a descending triangle with today's close resting right on a support that has been tested multiple times in the past week. With Coronavirus fears escalating again, the desire to travel and fly is falling. A bearish marubozu candle on the 1D chart may indicate a continuation of the downtrend and possibly break that support.

HUGE ACCUMULATION, TA and FA CONFLUENCE! HOLD ON FOR THE RIDE. Huge accumulation happening for the past 3 months. July 31st is the reveal of the interior of the space ship, and Aug 2nd is their earnings report, where they will more than likely announce they have received FAA certification, AND have scheduled date for getting RB into space.
This confluence is extremely rare to see in an asset.

BA is forming a wedge pattern. Watch 4 entry near Breakout(up) BA is forming a wedge pattern. Entry near Breakout(up) can be great. If someone is looking for short opportunity - Sell below breakdown/wedge could be beneficial.


Stocks - using our strategy, this is a MUST WATCH! Tesla, Boeing, Apple, Amazon, Beyond Meat - all shown in this video.
This is an incredibly powerful strategy, we are only just touching the service with this.
Take a look, it speaks for itself.
Regards
Darren

