GBPJPY: Long for now but watch it around September 28thTime at mode weekly analysis of the advance since the low in 2012.
Price has already tested once the most frequent price since 1991, and fell instantly, but now rebounded and is heading up again.
There is an active monthly uptrend, but the price target has already been exceeded.
It would seem as if this is a topping formation, and even if temporary, the decline that will unfold if this validates a terminal wedge, will be very sharp and at least headed to 171.067 instantly.
I'm long GBPUSD, and GBPNZD, but going long here might pay off, keeping in mind we might be able to short it soon.
I'll update the chart with my entry, for now, you can try going long at 188.6145 with a stop at 186.463 and no TP.
Cheers,
Ivan.
Boj

CADJPY: Potential long setup tonightThis pair is flashing an inminent buy signal.
If you look closely, the 1h chart shows an incipient uptrend, moving in impulsive fashion, and 4h and daily show price found support at a previous range expansion zone.
I'll be looking to go long on a retracement to 100.035 with a stop under the recent low, target is the weekly uptrend's target.
Good luck,
Ivan.

Looking At Ashraf Laidi's 40-Month CycleYesterday, Ashraf Laidi put out an interesting post on the USDJPY and a 40-month cycle.
From April 1995 to August 1998, the pair rose just over 85 percent. In brief, in the mid-90s, the US were raising interest rates (who does that anymore? Psh), which made the dollar stronger following the recession of 1990.
The Japanese yen was devalued, too, as their asset bubble grew bigger. The Japanese saw this as the cause of the "lost decade," while it could also have been blow back from the Plaza Accord in 1985.
Nevertheless, the pair ultimately crashed 31 percent from it's 40-month cycle high. Following the Asian Financial Crisis in 1997, the Federal Reserve began lowering rates in 1998, briefly increased the Fed funds rate before rapidly lowering rates into the 2000 bubble bust and recession. (Which I believe will happen next).
Fast forward to the current 40-month cycle, spanning February 2012 and June 2015. The pair has been able to gain a respectable 65 percent, and there is no reason why one would not BFTD; but, is the pair's fate remain the same as it were in the mid-1990s?
Analysts take of a policy devergence, but really it's come to a rhetoric divergence. The Fed has yet to tighten monetary policy, and even if it does, Fed officials have opined that it would still be "accommodating" and largely based on market reaction.
We very well could see a 25-50 bps increase in the Fed funds rate over the course of several months or a year, but that is when the true economic rot will fester to the surface; and the Fed will undoubtedly reverse course.
The BoJ has admitted, no matter how many times Kuroda tries to revert course, that there are diminishing returns in regards to a weak yen.
Quasi-monetary policy can only take economic growth to a certain point before fiscal policy takes the reigns, and we have not seen that from either country.
Both central banks have embarked on massive QE programs; yet nobody wonders why in the same period the US is undergoing its slowest recovery from a recession, while Japan has had three recessions since the financial crisis. During the 40-month expansion, Japan has had three quarters of GDP growth matched with three of economic contraction.
Central banks don't see to want to believe they are responsible for asset bubble, yet they are always the root cause.

Dollar On Shaky GroundDollar bulls may be few and far between, as a potential rate hike has now become a "buy the anticipation, sell the rumor" play. Even the most hardcore bulls like Marc Chandler has taken a step back to rethink the dollar.
After making a series of lower highs and lower lows, the dollar could very well test the lows near 93; while a series of resistance levels could snag any upside potential.
Last night, a few BoJ officials wanted to move the markets with their words. For some unknown reason, BoJ Governor Kuroda blurted out that the yen was "very weak" as to lead the market to believing it was too weak.
This is interesting on a few fronts:
One, a weaker yen was modus operandi numero uno. It was not "very weak" when it was down 25, 30 or 35 percent, but that 40 percent mark is the sweet spot.
Two, this comes at a very interesting point, following the G7 meetings. The market expects the Fed to increase rates solely based on non-farm payrolls and nothing else because, frankly, the data out of the US is borderline, if not outright, recessionary.
The Fed will never hike rates into a stronger dollar. As I said many of times, the Fed will work its way into the currency war by taking down the dollar. But much like their gold charade, the Fed has someone else do their dirty work.
The dollar is typically inverse of the yen, and by increasing the yen the dollar is almost guaranteed to fall by default. A falling dollar - in theory - supports the Fed's inflation projections.
It also gives the Fed more breathing room to throw around the idea of a rate hike.
Please visit my linked idea on the dollar. It is trading very much between S/R, while maintaining the downward trajectory.
Still projecting the DXY with an 80-handle by mid-summer.

USDJPY: Top spottedSimple setup, initiate a short when the support is breached.
We have a very strong decline after completing what looks like an expanding ending diagonal triangle in the 4h/daily charts.
If price moves below the support level outlined in the chart, it will accelerate down, probably moving 430+ pips to the downside.
As a bonus, crude oil seems to be moving up, while Nikkei falls, effectively boosting this trade, correlation wise.
Will update with my entry and scale ins.
Good luck,
Ivan.

EURJPY: Aiming for 147Analysis on chart, this is an update to my previous 4h chart.
I'm long and will be adding on retracements until we hit the target.
My stop is under 133.
Good luck,
Ivan.

EURJPY: Neutral but potentially a nice long tradeSimilarly to EURNZD and EURAUD, EURJPY exhibits some bullish characteristics.
I won't waste time with a huge writeup, the analysis is on the chart.
Feel free to comment, and if you agree, hit like ;)
Good luck,
Ivan.

CADJPY: Neutral, probably pending upside to be seenCADJPY has been in a consolidation for some time, before launching a fierce uptrend, in what I consider to be a wave C impulse in a larger flat.
I considered the move complete, but looking at how it behaved after topping, I suspect that the uptrend isn't complete yet.
We can observe a series of smaller timeframe trends briefly putting the bears and the bulls in command, typical triangle behavior.
Also, the daily and weekly rgmov remain signaling an uptrend, while price stopped falling when meeting with the lowest high trendline I drew from the lows, and we have a series of highs and lows where we don't observe a move past them, effectively suggesting coiling price action, yet to explode.
The explosion will most likely be up if this is indeed a wave 4 triangle, but we'll see.
For the time being, I refrain to trade this pair until it shows directional commitment on either side.
Tread carefully!
Cheers,
Ivan.

EURJPY: BOJ fueled short pt. 2We have interesting news releases coming out tonight, and thoughout tomorrow's session.
The technical chart shows an uptrend that is showing signs of exhaustion after correcting the strong decline from the December high from March 16 onwards.
The advance was halted when price reached an area of weekly low volume resistance, where the market was extremely one sided. These areas can reject price and stop the bulls' advance very reliably.
Now the market remains motionless after a strong selloff, which confirmed an hourly downtrend signal, while the 4h chart shows a volume buildup on the lows, increasing selling pressure after the sharp leg down completion started a sideways correction. I expect to see a strong move coming out of this juncture, fueled by the news releases.
23:00 US USD FOMC Member Williams speech 1
FRIDAY, MAY 22
02:00 CN CNY CB Leading Economic Index (Apr) 1 0.2
n/a JP JPY BoJ Monetary Policy Statement 3
03:00 JP JPY BoJ Press Conference 3
06:00 DE EUR Gross Domestic Product w.d.a (YoY) (Q1) 2 1.1%
06:00 DE EUR Gross Domestic Product s.a (QoQ) (Q1) 3 0.3% 0.3%
06:00 DE EUR Gross Domestic Product n.s.a (YoY) (Q1) 2 1.1%
06:45 FR EUR Business Climate (May) 1 101 101
08:00 DE EUR IFO - Expectations (May) 2 103.1 103.5
08:00 DE EUR IFO - Current Assessment (May) 2 113.6 113.9
08:00 DE EUR IFO - Business Climate (May) 2 108.3 108.6
08:00 IT EUR Industrial Sales s.a. (MoM) (Mar) 1 0.4%
08:00 IT EUR Industrial Orders s.a (MoM) (Mar) 1 0.8%
08:00 IT EUR Industrial Sales n.s.a. (YoY) (Mar) 1 -0.9%
08:00 IT EUR Industrial Orders n.s.a (YoY) (Mar) 1 2%
08:00 EMU EUR ECB President Draghi's Speech 3
09:00 IT EUR Retail Sales n.s.a (YoY) (Mar) 1 0.1%
09:00 IT EUR Retail Sales s.a. (MoM) (Mar) 1 0.2% -0.2%
n/a GR EUR Current Account (YoY) (Mar) 1 €-0.929B
12:30 US USD Consumer Price Index Core s.a (Apr) 1 240.79
12:30 US USD Consumer Price Index (MoM) (Apr) 2 0.1% 0.2%
12:30 US USD Consumer Price Index n.s.a (MoM) (Apr) 1 236.71 236.12
12:30 US USD Consumer Price Index Ex Food & Energy (MoM) (Apr) 2 0.2% 0.2%
12:30 US USD Consumer Price Index (YoY) (Apr) 3 -0.1% -0.1%
12:30 US USD Consumer Price Index Ex Food & Energy (YoY) (Apr) 3 1.7% 1.8%
13:30 JP JPY Bank of Japan Governor Kuroda Speech 3
13:30 EMU EUR ECB President Draghi's Speech 3
19:00 AR ARS Trade Balance (MoM) (Apr) 1
Previous ideas:

Nikkei: Bearish confluenceThere's a potential 8 bar downtrend about to confirm here.
If we see a swift move down from this level, we can expect the Nikkei to travel down, and fast.
Technically, you can enter shorts now, with a tight stop, but the 8 bar signal isn't confirmed yet.
Target on chart, for now an estimation, but possible.
Wait for confirmation if trading it. Might offer good clues for the yen traders too.
Thanks to Tim West for bringing it back to my attention yesterday.
Good luck,
Ivan.

GBPJPY: Target reached ahead of time, fade the euphoriaAnalysis on chart. Simple setup, I expect the larger moves to come tomorrow but it's worth monitoring GBP pairs for a short.
Timer about to expire for the last uptrend signal, very nice divergence setting up in CCI.
Short under the highest low.
Good luck!
Ivan.
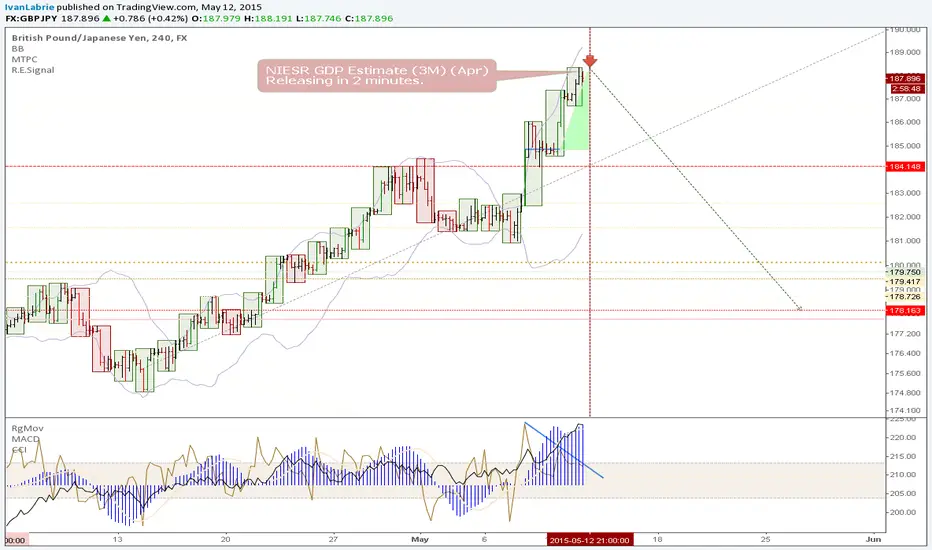
GBPJPY: Extended fifth wave advance and time at mode short setupWe can observe a clear five wave advance from the lows, with wave 5 being the largest, almost reaching 1.618 of the distance from point 0 to wave 3 high, which is the typical distance wave 5 travels.
These extended fifth waves often produce a very sharp and steep retracement that swiftly moves price down to wave 5's second wave, or even wave 4 of the whole advance.
Rgmov is showing clear divergence, which is a strong bearish signal, while we also observe a time at mode uptrend target expired, and one more larger timeframe target about to expire at the open on Sunday.
I'll place a short fine tuning the entry from the 1h chart on Sunday.
Good luck!
Ivan.
USDJPY: price at the daily mode - bar by bar analysisUSDJPY offers an attractive short trade, as long as it stays under the daily mode level at 119.635.
I'm looking to short under the previous hourly low for the time being, with a very tight stop to maximize returns.
We can place a reverse position above the resistance line, in case it reverses and continues to range. It's a good way to hedge against unexpected volatility.
Will update with an entry.
Update:
Daily roadmap:
If this level doesn't hold now, I suspect we might see some bullish continuation, exploring the upper end of the range.
Said and done...Now, waiting to figure out what to do. Either buy a correction, or sell OS.

CADJPY: UpdateSeems like this pair will offer a perfect short opportunity anytime now.
As depicted in the chart, we can see that price reached a critical resistance level after completing an AB=CD pattern from the low to the sideways correction start and end.
I'll post if I find a good entry opportunity with good risk/reward ratio asap.
If aggressive, you can short now under the low and target the horizontal red dashed line for taking partial profits, but I prefer to wait for a cleaner entry, fine tuning from the 4h and 1h charts.
Keep in mind that Gov. Poloz is speaking tomorrow, in 8hs from now, so the market might wait for that event to increase momentum and turn one directional.
Good luck!
Ivan.
Update:
Seems like the perfect short entry is near:
Taking a small position with a tight stop once time expires.

NZDJPY: Time at mode reversal setupExcellent risk/reward ratio in this short term trade setup.
Currently in a consolidation/correction phase, but next swing is down.
Analysis on chart, good luck!

GBPJPY update: targetsAn addendum to my previous 'Waiting for the perfect short' chart.
This chart describes the different projection techniques that I used to determine targets and potential retracement zones in this pair.
I'm short from 177.569, with a break even stop and will scale in every chance I get.
This corrections will be easily foreseeable using time at mode in lower timeframes, and I'll update with them in due time.
I expect to hold this trade open until the weekly signal expires at least.

The Big Bubble - Correlation S&P500 vs Treasury 30y2007-2012: Convergence between S&P500 trend and yield on Treasury 30y USA:
- Downhill stocks leads to a reduction in yields on the bond market . The flow of money coming out of the US stocks and goes to US bonds for the "safe haven" - RISK OFF.
- Rise in share prices on stocks leading the market yield bonds to rise due to the vendite.Flow of money out of the US bond market and goes on US stocks - RISK ON.
START THE BUBBLE: The first divergence for Fed QE & BoJ: A rising index corresponds to a fall in yields = excess liquidity in the market - Bubble begins to swell and then be absorbed
THE BIG BUBBLE: The divergence between performance of the stocks and lower yields on the bond market is the highest ever. The bubble is always more swollen and the two lines more and more divergent. A Fed rate hike (and therefore yield) approaches the two lines (seen in early 2015) but if this were not enough the bubble may deflate and bring down the stocks..fly to normality?!
BE CAREFUL

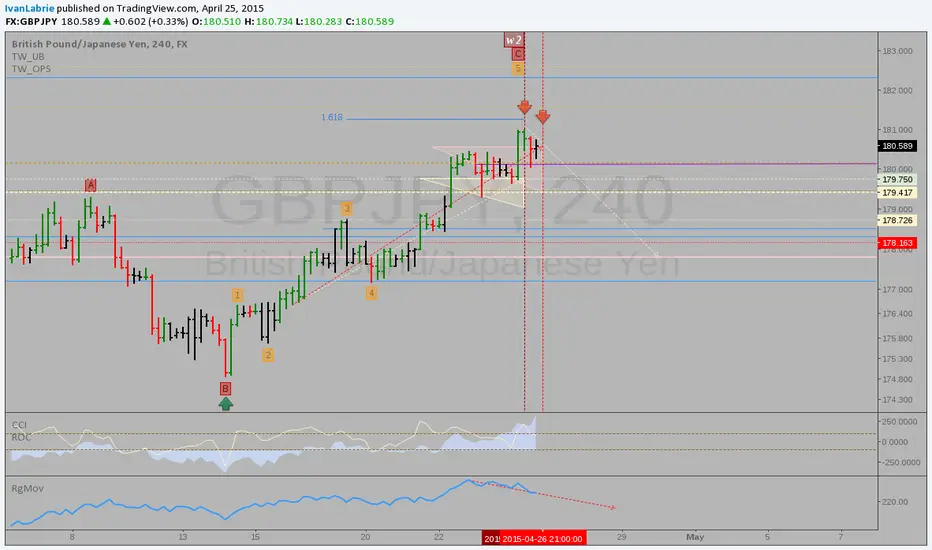
GBPJPY: Waiting for the perfect shortAs the title describes, I'll publish a suggested short entry once my setup confirms.
For the time being observe the price action and how the selling is outweighing the buying on each swing.
This is inherently bearish, and to make things worse for the bulls, Tim West's proprietary indicator RgMov is plotting new lows and a strong downtrend on the daily chart, ahead of price which is currently ranging. The weekly chart shows intense coiling, which will eventually lead to an explosive move to the down side.
I'll update the chart with entry, exit and stop loss values once it confirms.
Cheers,
Ivan.

AUDJPY: Short at linear regression channel topDowntrend continuation confirmed, bearish flag breakout is in effect.
Relative strength tells me it's the perfect time to enter short with a tight stop.
Two possible entries, one under the low, and one at a possible retracement.
1.25% risk each, good luck!

$USDJPY Breaks out of 2015 Range$USDJPY has rallied off the 50% fib as predicted. An impressive NFP print on Friday gave the pair the much needed fuel to break out of wedge consolidation and take out the 2015 high. Breakout targets multi-year high at 121.838 - Bullish above 119.81 (Pre-NFP low).

Long British Pound Yen Position $GBP $JPY #forexGBPJPY found support at the 178.0 level. If you zoom out to weekly chart you would see a huge upward trend channel started back in 2012. It's a good opportunity that the trend holds and we see a upward move. From the fundamental point both National Banks BoE and BoJ are holding their interest rates at a record low.
TP1 185
TP2 189.4
SL 177

Gold Looks Promising Longer-Term(Originally posted yesterday with appropriate charts)
Gold takes a breather, while negative data continues to pour in.
Gold’s inability to close above $1,300 is a mild hit for bulls, but prices will likely consolidate prior to the next leg higher. Prices declined to $1,280 per toz., just above the descending trend line, now support. The likely scenario is that gold will reenter the ascending channel and grind higher.
Prices will look to regain $1,295, while a close below $1,273 will cause prices to push lower to $1,259 per toz.
The longer-term, monthly chart does look promising, however.
The price action in January has caused an overwhelming bullish monthly candle that trumps the previous two. Currently, price action is hung up around September’s close of $1,285 per toz, while price action resistance is found at $1,303. Gold has been able to recover from testing a longer-term ascending support trend line, but prices are still stuck within a descending channel created when the bull market correction first took place in 2013.
If prices can close above $1,303 then near-term resistance would be seen at $1,353; but, the next monthly target is found at $1,391.
There is accumulation of gold futures, which picked up since gold first bottomed at $1,130. Gold was overbought in regards to the near-term chart, and the easing off of $1,300 will correct that. The RSI is well from overbought, and it is ticking upward – a positive sign of more gains to come.
The +/- DMI is also looking promising. The negative price indicator (- DMI) has remained on top since the correction was first initiated, but it has recently given up ground. The + DMI is pushing higher, and a bullish convergence on the monthly chart could prove positive for that push beyond $1,353.
Please see full, original post here bullion.directory

Hi-Prop Reversal @ 93.661 | $NZD $JPY #RBNZ #BOJ #elliottwaveFriends,
As you may recall, a recent predictive analysis/forecasting was released for this same $NZDJPY pair, pertaining to a higher timeframe (4-hour - See link below).
Fundamental analysis remains intact here regarding the $NZD.
PREDICTIVE/FORECASTING MODEL:
Looking at the internal activity of the aforementioned 4-Hour chart, I applied the predictive/forecasting model to define a high-probable level of reversal.
That level is currently defined as:
- TG-Hi = 93.661 - 23 DEC 2014.
If and once this level controls price, one shuold shift back to the higher timeframe (4-hour chart0, which remains the controlling frame for this pair at the moment,
FIBONACCI RELEVANCE:
A Fibonacci matrix is overlaid here, but lends no clear alignment with any forecast level of support. Instead, the structural level defined at 91.611 should offer a temporary support IF and once price adopts a bearish tack.
ELLIOTT WAVE RELEVANCE:
The dominant price action remains that of a complex internal zig-zags, one at a higher-degree (in purple) defined by a pending w-x-y-xx-(z) and a lesser-degree 1-2-3-4-(5) impulse, both of which hold a high-probability of corroborating with the predictive/forecasting model's target at 93.611.
This apical level would possibly complete a over-throw at Point-e, satisfying a bearish Ending Diagonal requirement.
OVERALL:
The original chart of interest rests at the 4-hour level. However, this 1-hour timefarme offers a chance to calibrate a reversal level in support of the predictive/forecasting analysis effected in the H4 level, which sees a dominant bearish control in price.
INVALIDATION:
The analysis should be considered invalid IF and once price commits to a level higher than Point-W = 93.968.
David Alcindor
Predictive Analysis & Forecasting
Denver, Colorado - USA
-----
Twitter: @4xForecaster
-----
