10YR Bond Yields: Panic on LTF, Calm on HTF📉 10YR Bond Yields: Panic on LTF, Calm on HTF
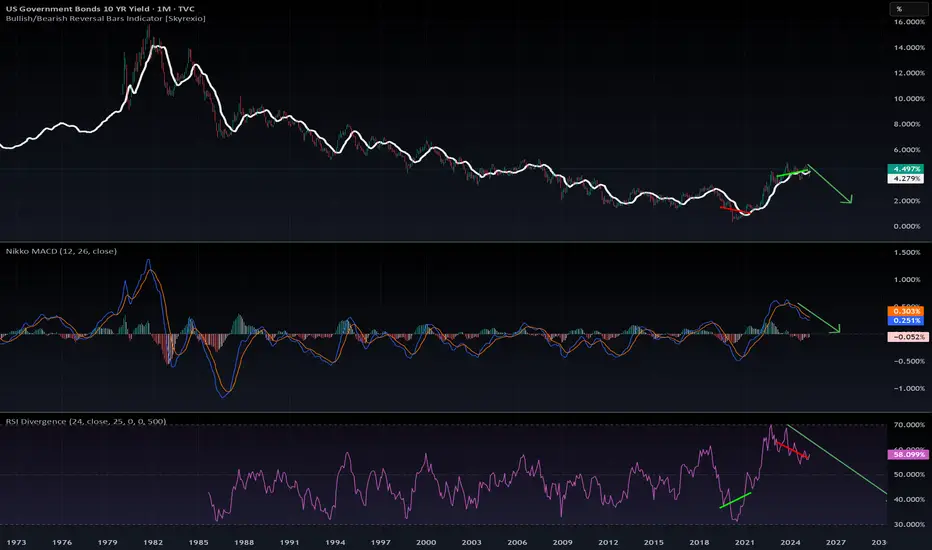
Yes, the recent spike in the 10-Year Yield is causing some short-term panic. But if you zoom out to the monthly timeframe, the bigger picture looks far more constructive.
🔍 Here’s what the chart says:
The MACD and RSI on the monthly are both pointing down.
Yields touched 4.5%, historically a key recession threshold.
We’re now seeing a MACD bearish crossover and a clear bearish divergence—classic signs of a trend reversal.
💡 What does this mean?
If no new fear or shock hits the market, yields are likely headed down, potentially toward the 2% range in the coming months. This would naturally ease pressure on equities and crypto.
📉 Conclusion:
This recent spike in yields seems to be transitional, not structural.
The chart suggests that the top is in, and the market is correcting from an overextended zone.
The Fed might not even need to intervene—the bond market is likely to correct on its own.
Stay calm. Stay rational. Always zoom out.
#10YearYield #BondMarket #MacroAnalysis #InterestRates #RecessionWatch #MarketPanic #MACD #TechnicalAnalysis #FederalReserve #CryptoMarkets #StockMarketInsights #StayCalmZoomOut #DYOR
Bonds
iShares 20 Year Treasury Bond | TLT | Long in the $80sFor the patient, one of the "safest" investments is in long-term treasury bonds (specifically NASDAQ:TLT ). For those who may not understand why, bond prices move inversely to yields. If interest rates drop (which the Federal Reserve has stated is going to happen this year), NASDAQ:TLT will rise. If interest rates rise (like what happened in early 2022), NASDAQ:TLT will fall. But all information from the Federal Reserve points to interest rate cuts starting this year *or* in the near future.
As of April 1st, 2025, the dividend yield for NASDAQ:TLT is 4.52%. That interest rate beats the vast majority of savings accounts right now. I don't think we will see NASDAQ:TLT prices in the $80's longer than a year or two. A contrarian may argue "inflation is rising!", but the data continue to point to it actually stabilizing. Yes, prices are higher compared to 4-5 years ago for just about everything... but the higher prices are "stable". Tariffs may put a slight wrinkle in this stability in the near-term, but I think the economy is already slowing and the Federal Reserve will be pressured to start dropping interest rates sooner than later.
I believe a global economic bust is inevitable - but no one knows when. Anyone who says they can time it is a charlatan. If/when a global economic bust occurs, the Federal Reserve will drop interest rates (like what happened in 2020) to get the economy juiced up again. NASDAQ:TLT will double in price or go further.
My general point is I *believe* NASDAQ:TLT is nearing a low and any future declines (especially below $80) are personal opportunities for buy-and-hold. It's a solid hedge with a good dividend. Options don't give you that and timing events is a guessing game for every retail trader. So, as someone who tries to think beyond the "now", I am gathering shares, enjoying the dividend, and not touching them until a global economic bust occurs. Currently holding positions at $85, $86, $87, and $90.
Targets:
2027: $100.00
2028: $105.00
2029: $110.00
2030: $115.00
Bust (unknown timing): $170+

The 10 Year: When Should We Worry?All over the media eyes are on yields but what exactly do the different potential rates of the 10-year yield mean in terms of debt servicing for the United States? I made this chart to visualize the danger points.
I am not saying I think we will get there I just wanted to know myself and help others to understand what each pain point can mean to the United States economy.

Gold ETF(GLD) - Gold is the Safe Haven?Is Gold the safe haven from all the market turmoil? Looking at the chart, it would appear that Gold is unfazed by current market conditions. Price is still making All-Time Highs as price continues to swing above the 25(green), 100,(yellow) and 200(blue) day EMAs. Further fears in the Bond market may increase interest in Gold as a stable asset. What are you thoughts? What are some other assets that are defying 'gravity'?

US10Y This break-out will be massive.The U.S. Government Bonds 10YR Yield (US10Y) is trading within a 2-year Triangle pattern and following this week's trade events, got back on its 1W MA50 (blue trend-line). A potential break-out either way from this long-term pattern will be massive.
We do believe though that there are higher probabilities for a bearish break-out as the 1W MA50 is about to cross below the 1W MA100 and form the first 1W MA50/100 Bearish Cross since July 22 2019. Interestingly enough, that was following the last Trade War between the U.S. and China.
At the same time, the 1W RSI has been within a Channel Down since late 2022, indicating a huge Bearish Divergence.
-------------------------------------------------------------------------------
** Please LIKE 👍, FOLLOW ✅, SHARE 🙌 and COMMENT ✍ if you enjoy this idea! Also share your ideas and charts in the comments section below! This is best way to keep it relevant, support us, keep the content here free and allow the idea to reach as many people as possible. **
-------------------------------------------------------------------------------
💸💸💸💸💸💸
👇 👇 👇 👇 👇 👇

TLT Short Term OutlookHere we have TLT moving according to our previously published chart. We think TLT will move sideways, consolidating in the near future before finding direction. Although the outlook for TLT and the Bond Market is positive, in the near short term we may see a decline in the bonds market and choppy movements. We anticipate a zigzag move followed by a possible price retest of near $85 before bouncing back up.

TLT Analysis: Bonds in Turmoil Amid Tariff ChaosThis week, we've witnessed a dramatic shift as equities and U.S. government bonds cratered simultaneously. Trump, facing intense market backlash, notably reversed his aggressive tariff stance—forced by China's strategic response and market realities. At the start of the week, the yield on 10-year U.S. Treasuries stood at 4.00%, skyrocketing to 4.51% in just a matter of days—a massive jump by typical investor standards. This rapid rise significantly impacts mortgage rates, car loans, and credit card borrowing, reflecting broader financial stress.
The sharp rise in bond yields resembles the forced-selling reaction to Liz Truss and Kwasi Kwarteng's mini-budget crisis in 2022. Trump's tariff-induced inflation fears and notably weak demand in recent U.S. Treasury auctions further intensified bond selling pressure.
Technical Levels & Analysis for TLT
Hourly Chart
TLT has clearly broken crucial support levels, highlighting significant bearish momentum:
• Resistance Zone: $90.00 - $90.50
• Current Trading Zone: Approximately $88.50
• Support Zone: $86.50 - $87.00 (critical level to watch)
Daily Chart
The daily perspective confirms bearish sentiment with substantial price drops and increasing volatility:
• Major Resistance Area: $92.50 - $93.50 (strong overhead resistance where trapped longs may reside)
• Immediate Support Area: $86.50 - $87.00
Trade Ideas & Scenarios
Bearish Scenario (primary):
• Entry Trigger: A confirmed break below the immediate support at $86.50.
Profit Targets:
• Target 1: $85.00 (short-term follow-through)
• Target 2: $83.50 (potential deeper continuation)
• Stop Loss: Above $88.50, limiting risk in case of unexpected bullish reversal.
Bullish Scenario (counter-trend play):
• Entry Trigger: Strong recovery and hold above $89.00.
Profit Targets:
• Target 1: $90.50 (initial resistance)
• Target 2: $92.50 (secondary resistance level)
• Stop Loss: Below recent lows near $86.50 to tightly manage risk.
The rapid shifts in bond yields and tariffs are causing heightened market volatility. Investors must remain vigilant and maintain strict risk management. Watch these key TLT levels closely, especially amid ongoing tariff news and bond market reactions.

Bond Yields Ripping, Will Wall Street Take Notice?Rising yields can usually be associated with a period of risk on. But seeing the 30-year treasury yield rise over 20bp in Asia while Wall Street futures cling on to their cycle lows is anything but usual. In fact, it's a bad omen of things to come.
Matt Simpson, Market Analyst at City Index and Forex.com

Bond Futures Back At SupportTrade is fairly simple here. Go long treasuries and if it breaks down cut.
- A bounce and push back up could be another ugly catalyst for the US stock market.
- A breakdown however would push yields up (and economic growth forecasts) which would be quite bullish for stocks especially down at these levels

TLT - Monthly Targets (Long Term)Markets are currently tight squeezing due to Trumps terrifs etc, something has to give in, based on this chart:
- TLT has found a bid at .963 Fibonacci level @ $82.42 (EXTREME RETRACE)
- Dec 2, 2024 = the 369 ratio in time for $82.42 (time & price 📐)
NEXT TARGET PROJECTION IS 50% OF THE MAX TARGET ANGLE = ($121)
(BETWEEN 2025 - 2029)
MAX TARGET = $183 - $212
(BETWEEN 2025 - 2034)

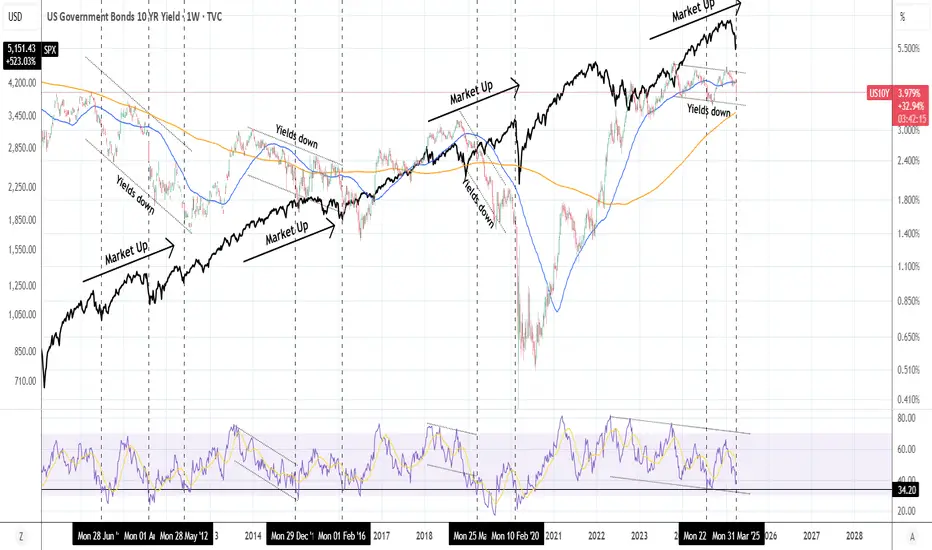
US10Y: This pattern has been extremely bullish for stocks.The U.S. Government Bonds 10 YR Yield is heavily bearish on its 1W technical outlook (RSI = 36.788, MACD = -0.034, ADX = 32.176) and that has historically been favorable for stocks. More specifically, when the Yields have been trending down inside a Channel Up since 2010, the S&P500 was on an uptrend. Going into more detail on the US10Y RSI on the 1W timeframe, it is almost on the 34.20 trendline, which is a key level as every time it hit that (see the dashed vertical lines), the S&P500 bottomed. The exception to the rule was, needless to say the COVID crash in Feb 2020. According to this, Trump's tariffs create the perfect market opportunity for a new long term buy.
## If you like our free content follow our profile to get more daily ideas. ##
## Comments and likes are greatly appreciated. ##
US Recession Imminent! WARNING!Bond traders are best when it comes to economics. Stock traders not so much.
As the chart shows, historically, when rates bunch up, what follows is a recession. During the recession, the economy tries to fix itself by fanning out the yield curve, marking it cheaper to borrow and boosting the economy.
The best time to be buying up stocks and going long the market is when the yield curve is uninverted and fanned out wide—not when it is bunched up like this.
My followers know this is my first warning of a recession since FEB. 2020.
WARNING! Things can get ugly from here very quickly!

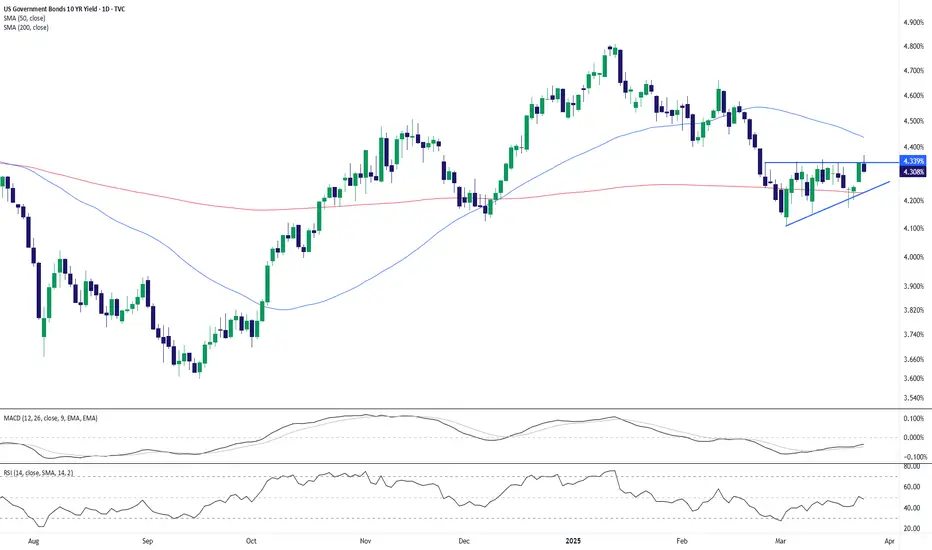
US 10yr Treasury Yields Press Against ResistanceThe U.S. 10-year Treasury yield is hovering just beneath the 4.34% resistance level, with price forming a tight ascending triangle just under this key level. Today’s pullback to 4.31% (-0.74%) suggests hesitation from bulls as momentum indicators turn mixed.
🔹 MACD is flat, showing a lack of directional conviction.
🔹 RSI sits at 47.94, neutral and non-committal.
🔹 Price remains sandwiched between the 50-day SMA (4.43%) and the 200-day SMA (4.22%).
A confirmed breakout above 4.34% could open the door for a run toward 4.50% or even 4.80%. Conversely, a drop below the rising trendline (~4.24%) would expose downside risk toward the 200-day SMA.
Watch for a catalyst (Fed commentary or inflation data) to break the deadlock.
-MW
Credit Spreads - About to Blow?While credit spreads, which reached near-historic lows in 2024, remain tight, they have widened notably since the beginning of 2025. If this trend accelerates, it could put substantial pressure on the bond market, resulting in tighter financial conditions and corresponding headwinds for the domestic economy. The last 2-3 weeks have seen risk assets come under pressure, but the below chart suggests that the risk-off sentiment shift may still be early-stage... Whether viewed through a traditional technical lens or supply/demand, current levels could be considered supportive - risk is to the upside.
A few impacted ETFs: NASDAQ:IEF , NASDAQ:TLT , AMEX:HYG , AMEX:JNK
Jon
JHartCharts

Are bonds (TLT) about to fall?I've been thinking for the past few months that TLT would rally up to the 100 area. However, that move hasn't materialized and now I think there's a chance of yields rising and bonds falling. Over the past few weeks the chart has morphed more bearish.
It looks like something should set off the bond market this week and cause a lot of volatility in bonds.
I think there's potentially a chance we see the lower supports get hit before we see a relief rally.
Let's see how it plays out.

US10Y Strong sell signal below the 1D MA50.The U.S. Government Bonds 10YR Yield (US10Y) has been trading within a Channel Down since the October 23 2023 High. In the past 2 months it has been on a downtrend, which is the technical Bearish Leg of the pattern.
The 1D MACD is on its 2nd Bullish Cross on a decline, very similar with the previous Bearish Leg of the Channel Down. We are again on the 0.5 Fibonacci level and as long as any rebound gets rejected below or on the 1D MA50 (blue trend-line), the long-term bearish pattern remains intact.
We expect a similar Bearish Leg of -24% overall to target 3.685%.
-------------------------------------------------------------------------------
** Please LIKE 👍, FOLLOW ✅, SHARE 🙌 and COMMENT ✍ if you enjoy this idea! Also share your ideas and charts in the comments section below! This is best way to keep it relevant, support us, keep the content here free and allow the idea to reach as many people as possible. **
-------------------------------------------------------------------------------
💸💸💸💸💸💸
👇 👇 👇 👇 👇 👇

$BONDS MMSMWhen analyzing the bonds, we identified an SMT between them at a PDA located in the monthly premium region, further reinforcing the possibility of a DXY rally and a drop in EURUSD, along with bond depreciation. However, to validate this scenario, we still need confirmations on the daily chart to ensure that the bias remains aligned with the market structure.

How to pick a benchmark for you portfolio and beat the market What is a benchmark?
A benchmark is an index or a basket of assets used to evaluate the performance of an investment portfolio In the context of portfolio analysis the benchmark serves as a point of comparison to determine whether a fund a strategy or an investment is performing better worse or in line with the reference market.
In the current chart, Bitcoin ( BINANCE:BTCUSDT ) is displayed with a solid and larger blue line in relation to other cryptocurrencies for the current period.
Benchmarks are essential tools for institutional and private investors as they allow measuring the effectiveness of asset allocation choices and risk management Additionally they help determine the added value of an active manager compared to a passive market replication strategy.
Benchmark analysis example: NASDAQ:TSLA - NASDAQ:NDX
Benchmark analysis example: NASDAQ:TSLA - NASDAQ:AAPL - NASDAQ:NDX
What is the purpose of a benchmark
The use of a benchmark in portfolio analysis has several objectives
1) Performance Evaluation: Provides a parameter to compare the portfolio's return against the market or other funds
2) Risk Analysis: Allows comparing the volatility of the portfolio against that of the benchmark offering a measure of risk management
3) Performance Attribution: Helps distinguish between returns derived from asset selection and those linked to market factors
4) Expectation Management: Supports investors and managers in assessing whether a portfolio is meeting expected return objectives
5) Strategy Control: If a portfolio deviates excessively from the benchmark it may signal the need to review the investment strategy
How to select an appropriate benchmark?
The choice of the correct benchmark depends on several factors:
1) Consistency with Portfolio Objective: The benchmark should reflect the market or sector in which the portfolio operates
2) Representativeness of Portfolio Assets: The benchmark should have a composition similar to that of the portfolio to ensure a fair comparison
3) Transparency and Data Availability: It must be easily accessible and calculated with clear and public methodologies
4) Stability Over Time: A good benchmark should not be subject to frequent modifications to ensure reliable historical comparison
5) Compatible Risk and Return: The benchmark should have a risk and return profile similar to that of the portfolio
Most used benchmarks
There are different benchmarks based on asset type and reference market Here are some of the most common.
Equity
FRED:SP500 Representative index of the 500 largest US companies.
NYSE:MSCI World Includes companies from various developed countries ideal for global strategies
FTSE:FTSEMIB Benchmark for the Italian stock market
NASDAQ:NDX Represents the largest technology and growth companies
Bonds
Barclays Global Aggregate Bond Index Broad benchmark for the global bond market
JP Morgan Emerging Market Bond Index EMBI Benchmark for emerging market debt
[* ]BofA Merrill Lynch US High Yield Index Representative of the high-yield bond market junk bonds
Mixed or Balanced
6040 Portfolio Benchmark 60 equities SP 500 and 40 bonds Bloomberg US Aggregate used to evaluate balanced portfolios
Morningstar Moderate Allocation Index Suitable for moderate-risk investment strategies
Alternative
HFRI Fund Weighted Composite Index Benchmark for hedge funds
Goldman Sachs Commodity Index GSCI Used for commodity-related strategies
Bitcoin Index CoinDesk BPI Benchmark for cryptocurrencies
A reference benchmark is essential in portfolio analysis to measure performance manage risk and evaluate investment strategies The selection of an appropriate benchmark must be consistent with the strategy and market of the portfolio to ensure meaningful comparison.
Understanding and correctly selecting the benchmark allows investors to optimize their decisions and improve long-term results.

USD lower, yields whacked on renewed Fed-cut betsEven as recently as two weeks ago, the thought of fed cuts were in the distant past. Yet a slew of weak data from the US since Friday including two consumer sentiment reports and a surprise PMI miss has seen markets reconsider a 25bp Fed cut in June. Today I cover bond yields, the US dollar index and futures exposure to update my dollar outlook.
Matt Simpson, Market Analyst at City Index and Forex.com

S&P500 How Expensive Is It?The Average Wage Earner Needs To Work166.5 Hours To Buy One Share Of The S&P500
If this chart does not drive the point home. Nothing will.
Sometimes simple common sense is more powerful than all the fancy analysis one can buy or think of to create.
Price is what you pay, and value is what you get! Remember that my friends.
DANGER IS SCREAMING AT YOU!

Sailing27db97e52ec7b1b43e5391bb5861b8d4cf37d3a7c3a1a06d3aa0533382d52733
Bitcoin's conservative addressable share of speculative assets is 2%.
The total market cap of the speculative portion of assets are as follows:
Real Estate: $2.14 trillion
Gold: $7.83 trillion
Silver: $108 billion (0.108 trillion)
Stock Market: $21.8 - $32.7 trillion (We'll consider the lower and upper estimates)
Bonds: $7.035 - $14.07 trillion
Total speculative market cap: $38.913 trillion to $56.848 trillion.
Conservative estimate for Bitcoin's share of this is 2%, or 0.778T-1.137T
The conservative multiplier for Bitcoin, is 118x. This means that for every $1 invested in Bitcoin, the market cap tends to increase by $118. Let's assume 10x instead.
0.778T-1.137T X 10 = 7.783T - 11.370T
Conservative projected price range 350k-666k
Market Cap details below:
Real Estate:
* Total Market Cap: $379.7 trillion
* Speculative Portion Market Cap: $2.14 trillion (Investment real estate)
* Speculative Portion: 0.56%
Gold:
* Total Market Cap: $19.57 trillion
* Speculative Portion Market Cap: $7.83 trillion
* Speculative Portion: 40%
Silver:
* Total Market Cap: $1.816 trillion
* Speculative Portion Market Cap: $108 billion
* Speculative Portion: 5.95%
Stock Market:
* Total Market Cap: $109 trillion
* Speculative Portion Market Cap: $21.8 - $32.7 trillion
* Speculative Portion: 20-30%
Bonds:
* Total Market Cap: $140.7 trillion
* Speculative Portion Market Cap: $7.035 - $14.07 trillion
* Speculative Portion: 5-10%

U.S. FIRMS SWAP DOLLARS FOR EURO to lower funding costsU.S. FIRMS SWAP DOLLARS FOR EURO to lower funding costs—SMART MOVE?
(1/9)
Good afternoon, Tradingview! U.S. companies are flipping dollar debt into euros—slashing borrowing costs 📈🔥. Cross-currency swaps are the hot ticket amid rate gaps. Let’s break it down! 🚀
(2/9) – SWAP SURGE
• Trend: Dollar bonds morph into euros 💥
• Why: Eurozone rates lag U.S. by ~200 points 📊
• Volume: $266B in Jan ‘25 swaps, up 7% YoY
Lower rates, big savings—companies pounce!
(3/9) – THE TRIGGER
• Fed: Holds steady—U.S. rates stay high 🌍
• ECB: Eases up—eurozone softens 🚗
• Trump Tariffs: Stir inflation fears—volatility spikes 🌟
Dollar strength pushes firms to euro deals!
(4/9) – HOW IT WORKS
• Swap: Trade dollar debt for euro payments 📈
• Gain: Cheaper interest, currency hedge
• Impact: Millions saved, euro cash flows shine
It’s a financial jujitsu move—clever stuff! 🌍
(5/9) – RISKS IN PLAY
• Euro Flip: Stronger euro could zap savings ⚠️
• FX Losses: Hedging costs climb if dollar dips 🏛️
• Uncertainty: Fed vs. ECB—rate dance wobbles 📉
Smart bet, but not risk-free!
(6/9) – WHY NOW?
• Rate Gap: U.S. high, eurozone low—carry’s juicy 🌟
• Trump Effect: Tariffs fuel dollar power 🔍
• Global Ops: U.S. firms shield Europe earnings 🚦
Timing’s ripe—swaps are the shield!
(7/9) – MARKET VIBE
• Early ‘25: Swap restructures cash in 🌍
• Savings: redirected to debt, flexibility 📈
• Trend Watch: Grows if rate split holds
Companies adapt—financial acrobatics in action!
(8/9) – Dollar-to-euro swaps—what’s your take?
1️⃣ Bullish—Cost cuts win big.
2️⃣ Neutral—Works now, risks later.
3️⃣ Bearish—Euro rebound kills it.
Vote below! 🗳️👇
(9/9) – FINAL TAKEAWAY
U.S. firms swap dollars for euros—saving millions as rates diverge 🌍🪙. Tariffs and Fed fuel the play, but euro risks lurk. Genius or gamble?

Critical 4.50% level being tested ahead of Trump speech and FOMCThe US10-year yield closed the week marginally higher at 4.48% after a busy week of events which saw the DXY stumble by 1.2% despite US CPI rising for the 4th consecutive month coupled with a rather hawkish yet upbeat testimony before congress from Fed chair Powell, which in my opinion was all dollar positive. US CPI for the month of January came in hotter than expected at 3.0% yoy, up from 2.9% in December. Additionally, on top of Powell’s comments regarding the strength of the US economy, the ISM Manufacturing PMI completely shattered expectations after coming in stronger than expected at 50.9 for the month of January.
The US10-year yield is currently testing the 50-day MA level of 4.52% as well as the blue support range between 4.45% and 4.50%. A break below 4.40% will however force me to invalidate my series of ideas on the US10-year yield calling for a move higher towards 5.00%. A break below 4.40% will allow bond bulls to pull the yield lower onto the 61.8% Fibo retracement at 4.30% and the 200-day MA at 3.69%.
