#BONK/USDT About to Break Out !#BONK
The price is moving within a descending channel on the 1-hour frame and is expected to break and continue upward.
We have a trend to stabilize above the 100 moving average once again.
We have a downtrend on the RSI indicator that supports the upward break.
We have a support area at the lower boundary of the channel at 0.00002440, acting as a strong support from which the price can rebound.
We have a major support area in green that pushed the price upward at 0.00002372.
Entry price: 0.00002552.
First target: 0.00002694.
Second target: 0.00002882.
Third target: 0.00003118.
To manage risk, don't forget stop loss and capital management.
When you reach the first target, save some profits and then change the stop order to an entry order.
For inquiries, please comment.
Thank you.
Bonkcoin

BONK : Best of luck to you...Hello friends🙌
👀Considering the decline we had, you can see that the price was supported by buyers and broke the specified resistance. Now, in the price correction, there is a good opportunity to buy with risk and capital management and in steps and be patient until the specified targets are reached.
🔥Follow us for more signals🔥
*Trade safely with us*

BONK price analysis “Someone” decide to revive the price of CRYPTOCAP:BONK , or are there fundamental reasons for this? (Please share your thoughts in the comments.)
📈 However, the last time there was such a powerful surge in trading volume on the OKX:BONKUSDT chart, the price managed to gain +256% in just over two weeks.
❓ Do you think that the price of #Bonk , in the current wave of growth, will manage to rise by at least +156% and reach the mark of $0.0000290, and the capitalization of the memecoin project will grow from the current $1.75 billion to $2.25 billion?
_____________________
Did you like our analysis? Leave a comment, like, and follow to get more
BONK BONKUSDT Hello, greetings...
🐱🐉 The support and resistance levels in Bonk during the 4-hour timeframe are shown in the graph as I have indicated.
🐱🐉 However, what I want to discuss with you is how we should follow Bonk and how we can maintain control over its strength. I will show this to you...
🐱🏍 First, let's just look at the support, resistance, and our trend...
🐱🏍 When we look at it, we see a strong upward trend showing rapid growth and there is both a support level and a resistance level. It appears that the upward trend will continue until we reach the yellow line. When we reach the yellow trend, the color of things will change.
🐱👤 What I want to explain most to you is the indicator part now...
🐱👤 The blue arrow marks indicate the strength of the trend, the white line is called ADX, which shows how strong the trend is. The purple one is the well-known RSI,
🐱👤 So what is ADX telling us right now?
🐱👤 ADX is still looking upwards and at a high level, so it makes more sense to hold on to our long positions.
🐱🚀 The indicator we know as DI+ and DI- consists of green and red thin lines. What does it tell us?
🐱🚀 If DI+ (green) crosses above DI- (red), it indicates a positive trend and we are currently seeing a significant positive movement. We will use this indicator like this: if ADX turns downward and DI- crosses above DI+, those who are holding long positions should be cautious.
CONTINUE TO HOLD THE POSITION
+DI > -DI
ADX > 25
RSI < 70 → Should not be in an overbought area
BE CAUTIOUS
-DI > +DI
ADX > 25
RSI > 30 → Should not be in an oversold area
BONK – Long Here, Patience RequiredTime to go long on $BONK.
Hard not to bid at this level—the risk/reward is solid.
Still expecting some range-bound price action before the real move kicks in, so patience is key here.
First target: the yearly open—nearly a 2x from current levels. BINANCE:BONKUSDT

BONKUSDT Forming Falling WedgeBONKUSDT is catching the attention of savvy crypto traders as it displays a classic falling wedge pattern, a well-known bullish reversal signal. This technical setup suggests that the prolonged downtrend could be nearing exhaustion, opening the door for a significant upside move. With good trading volume accompanying recent price action, buyers are showing signs of accumulation, laying the groundwork for a potential breakout that could deliver an impressive 90% to 100%+ gain in the coming sessions.
The falling wedge pattern is one of the most reliable chart formations for spotting trend reversals in the crypto market. As BONKUSDT continues to coil tighter within the wedge, the pressure is building for a breakout to the upside. Investors are becoming increasingly optimistic as they see strong support levels being defended, indicating that the bears are losing momentum. When price action breaks out of the wedge with convincing volume, a swift rally is likely to follow, rewarding those who positioned themselves early.
BONKUSDT’s growing popularity among retail and institutional traders further adds to its bullish outlook. The project is generating a buzz across crypto communities as investors recognize its potential for high percentage returns. Combined with solid fundamentals and renewed market sentiment, BONKUSDT has what it takes to deliver a powerful move once the falling wedge confirms its breakout. Smart money is watching this pair closely for a breakout candle that could ignite a trend reversal rally.
It’s crucial for traders to keep an eye on volume spikes and daily closes above key resistance to validate the wedge breakout. Clear risk management and well-defined stop-loss placements are essential to ride this setup with confidence. If the pattern plays out as expected, BONKUSDT could become one of the top performing coins in the near term, offering traders an excellent opportunity to capitalize on this bullish momentum.
✅ Show your support by hitting the like button and
✅ Leaving a comment below! (What is You opinion about this Coin)
Your feedback and engagement keep me inspired to share more insightful market analysis with you!

BONK About to Explode or Fakeout? Key Levels Are UnfoldingYello, Paradisers! Is #BONK gearing up for a face-melting rally, or is this just another trap designed for emotional traders?
💎BONKUSDT has recently formed a double bottom, a key reversal pattern that often appears before significant bullish momentum kicks in. This comes after a sustained bearish trend, and we’re now seeing signs of strength re-entering the market.
💎What’s even more interesting, a lookalike of skewed triangle pattern is starting to emerge. These often signal continuation of strength, and when paired with an already bullish reversal, it paints a potentially explosive short-term picture.
💎#BONKUSDT is currently sitting on ascending support around the $0.00001980 level. This zone is further bolstered by the EMA-50, adding extra technical significance. If BONK can continue to hold this level, the price is well-positioned to push higher toward the $0.00002470 mark, a moderate resistance zone that could serve as the next stepping stone in this bullish scenario.
💎If BONK clears this resistance with conviction, momentum could pick up rapidly, opening the doors for an aggressive move toward the $0.00003100 to $0.00003400 region. This is a critical profit-taking zone, not only because of historical resistance but also due to a dense confluence of technical barriers.
💎Zooming into the 12-hour timeframe, BONK has just entered a golden cross formation. This bullish crossover is acting as dynamic support, with the $0.00001800 level becoming an important defensive area for price stability moving forward.
Paradisers, strive for consistency, not quick profits. Treat the market as a businessman, not as a gambler.
MyCryptoParadise
iFeel the success🌴

#BONK/USDT#BONK
The price is moving within a descending channel on the 1-hour frame, adhering well to it, and is on its way to breaking it strongly upwards and retesting it.
We are seeing a bounce from the lower boundary of the descending channel. This support is at 0.00002070.
We have a downtrend on the RSI indicator that is about to break and retest, supporting the upward trend.
We are looking for stability above the 100 moving average.
Entry price: 0.00002205
First target: 0.00002287
Second target: 0.00002404
Third target: 0.00002551

#BONK/USDT#BONK
The price is moving within a descending channel on the 1-hour frame and is expected to break and continue upward.
We have a trend to stabilize above the 100 moving average once again.
We have a downtrend on the RSI indicator that supports the upward move with a breakout.
We have a support area at the lower boundary of the channel at 0.00001825, which acts as strong support from which the price can rebound.
Entry price: 0.00001883
First target: 0.00001967
Second target: 0.00002078
Third target: 0.00002222

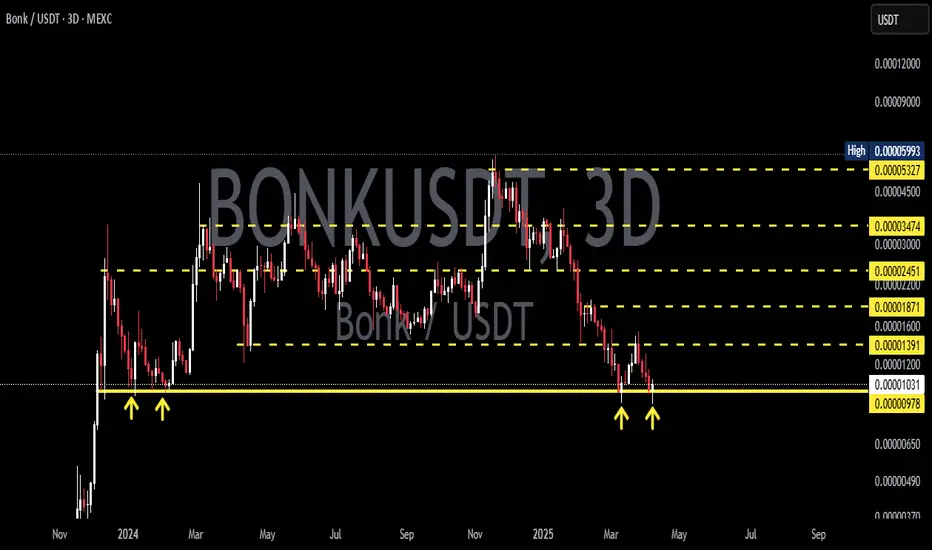
BONKUSDT 3DBONK ~ 3D Analysis
#BONK Important support that must be maintained for now. bouncing from here a short -term target of at least 15%+.
BONK / TetherUS. 2 week TF Hey traders is Bonk ready to go Bonkers again? we have had a great retrace to the demand zone.

$BONK: Hold or Fall? Potential 3x from Here!Decided to bid this area one more time on BINANCE:BONKUSDT :
The lows need to hold, or it’s an easy path down to 0.00002150 or lower.
It needs to break the current swing highs to at least flip the downtrend.
Just placing a bet here, expecting the following to happen. Will add significantly once the MSB occurs at the swing high.
It’s a good level, and I still believe CRYPTOCAP:SOL holds above 170. Don’t think twice, it’s simple.

#BONK/USDT Ready to go higher#BONK
The price is moving in a descending channel on a 1-day frame and sticking to it well
We have a bounce from the lower limit of the descending channel, this support is at 0.00002500
We have a downtrend on the RSI indicator that is about to be broken, which supports the rise
We have a trend to stabilize above the moving average 100
Entry price 0.00003350
First target 0.00003500
Second target 0.00004186
Third target 0.00004854

$BONK consolidation is ending. Ready to pump again.SEED_DONKEYDAN_MARKET_CAP:BONK experienced a significant pump in November 2024 and has been consolidating since.
It touched my refill zone at 0.00002500 and bounced from there. However, its MACD and RSI were showing signs of a significant bearish divergence.
The correction appears to have bottomed out, with a MACD crossover on the 1D chart. This could indicate the potential for another upward pump.
The green lines on my chart mark the possible resistance/support levels.
DYOR!

Bonk Elliot wave - Fib LevelsBonk targets for wave 3 and wave 5. Telling my audience with more decription - happy tv

#BONK/USDT Ready to go higher#BONK
The price is moving in a descending channel on the 1-hour frame and sticking to it well
We have a bounce from the lower limit of the descending channel, this support is at 0.00002974
We have a downtrend on the RSI indicator that is about to break, which supports the rise
We have a trend to stabilize above the moving average 100
Entry price 0.00003107
First target 0.00003278
Second target 0.00003437
Third target 0.00003618

$BONKUSDTThis is how I look at BONK in a Long run, a profitable run years ahead. A good long term investment, looking at ROI of more than 80% in a year. My money on $BONK.

BONK/USDT - H4 - Wedge BreakoutThe BONK/USDT pair on the H4 timeframe presents a Potential Buying Opportunity due to a recent breakout from a Wedge Pattern. This suggests a shift in momentum towards the upside and a higher likelihood of further advances in the coming Days.
Possible Long Trade:
Entry: Consider Entering A Long Position Above The Broken Trendline Of The Triangle After Confirmation. Ideally, This Would Be Around Breakout.
Target Levels:
1st Resistance
2nd Resistance
Your likes and comments are incredibly motivating and will encourage me to share more analysis with you.
Best Regards, KABHI FOREX TRADING
Thank you.

$BONK: A New Entry OpportunityLooking to enter CRYPTOCAP:BONK below $0.000038.
The $0.000035 range marks the lowest entry point, and I'll re-evaluate the price action if it reaches that area. Stay tuned to see how it behaves there before making any further moves.

BonkBonk usdt Daily analysis
Time frame daily
Risk rewards ratio >1.5
Short position
Bink airdrop causes this pump and now this pump ended and bonk isn't attractive for users so I think price will come down

BONK MEME COIN LONG IDEA - Solana Memecoin TrendBONK is a popular Solana meme coin and is gaining attention amid the ongoing meme coin trend, so it’s worth keeping an eye on.
Technical Analysis: BONK recently broke out of a bearish trendline, retested it, and appears to be consolidating here. I believe we could see strong upward momentum soon. The price has also recently broken a larger bearish trendline, created a weekly demand zone, run daily liquidity, and reached a daily demand level, followed by a strong breakout.
I'm already in this trade and would consider adding more if the price retests and reacts at the trendline.
Please note the tight stop-loss on this trade and adjust your risk accordingly.
SL: 0.020847
TP1: 0.0305
TP2: 0.0339
TP3: 0.0357
After reaching TP1, I'll move my stop-loss to breakeven, and I suggest you consider doing the same.

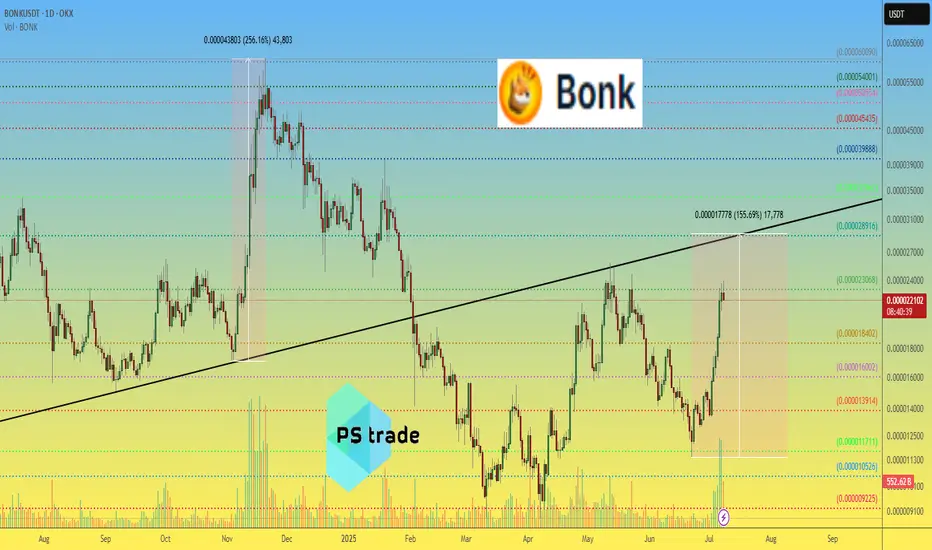
BONKUSDT Triangle Pattern!BONKUSDT technical analysis update
CRYPTOCAP:BONK price is breaking out of a triangle pattern on the daily charts. The price has been trading within this triangle pattern for the past year. If the breakout is confirmed, we can expect a strong bullish move. Over the last few days, there has been an increase in volume, which is also considered a bullish sign for BINANCE:BONKUSDT

BONKUSDT Ready for Big PUMP!!!BINANCE:BONKUSDT has recently broken out and successfully retested a previous resistance level, showing signs of strength. Now, it’s attempting to break out of a triangle pattern, with the resistance line acting as a key barrier. If it manages to break through, a significant upward move could be on the horizon, fueled by the ongoing memecoin craze. However, caution is advised—consider using only a small portion of your capital to manage risk in this volatile environment.
BINANCE:1000BONKUSDT.P Currently trading at $0.000036
Buy level: Above $0.000033
Stop loss: Below $0.0000262
Max Leverage 3x
Always keep Stop loss
Follow Our Tradingview Account for More Technical Analysis Updates, | Like, Share and Comment Your thoughts
