BONK BONKUSDT Hello, greetings...
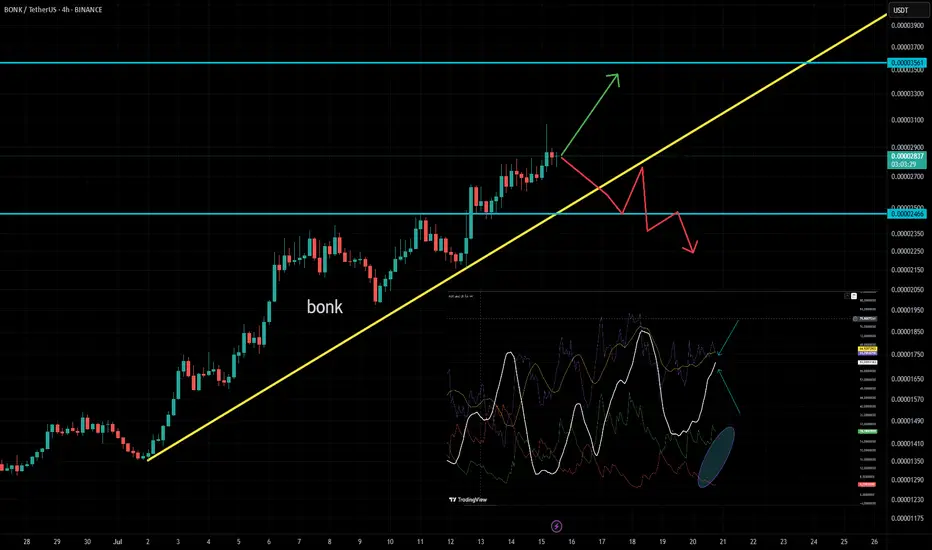
🐱🐉 The support and resistance levels in Bonk during the 4-hour timeframe are shown in the graph as I have indicated.
🐱🐉 However, what I want to discuss with you is how we should follow Bonk and how we can maintain control over its strength. I will show this to you...
🐱🏍 First, let's just look at the support, resistance, and our trend...
🐱🏍 When we look at it, we see a strong upward trend showing rapid growth and there is both a support level and a resistance level. It appears that the upward trend will continue until we reach the yellow line. When we reach the yellow trend, the color of things will change.
🐱👤 What I want to explain most to you is the indicator part now...
🐱👤 The blue arrow marks indicate the strength of the trend, the white line is called ADX, which shows how strong the trend is. The purple one is the well-known RSI,
🐱👤 So what is ADX telling us right now?
🐱👤 ADX is still looking upwards and at a high level, so it makes more sense to hold on to our long positions.
🐱🚀 The indicator we know as DI+ and DI- consists of green and red thin lines. What does it tell us?
🐱🚀 If DI+ (green) crosses above DI- (red), it indicates a positive trend and we are currently seeing a significant positive movement. We will use this indicator like this: if ADX turns downward and DI- crosses above DI+, those who are holding long positions should be cautious.
CONTINUE TO HOLD THE POSITION
+DI > -DI
ADX > 25
RSI < 70 → Should not be in an overbought area
BE CAUTIOUS
-DI > +DI
ADX > 25
RSI > 30 → Should not be in an oversold area
Bonklong
BONKUSDT Forming Descending TriangleBONKUSDT is rapidly emerging as a favorite among traders looking for high-growth meme coins with serious upside potential. This coin has recently shown strong price action, supported by healthy volume that signals growing investor confidence. The market sentiment around BONK has been increasingly bullish, and with current patterns aligning well with a potential breakout, traders are eyeing an impressive 90% to 100% gain from its current levels. Such explosive potential makes BONKUSDT one of the standout opportunities in the altcoin space right now.
As the crypto community continues to embrace meme coins, BONK has carved out a unique space with its vibrant community and strong social engagement. This coin’s popularity on social platforms is fueling its liquidity, and the recent accumulation phases suggest that smart money may be positioning for the next wave up. Technical traders should pay close attention to how BONKUSDT reacts at key resistance zones, as a confirmed breakout could open the door to a major rally in the coming weeks.
The technical structure shows BONKUSDT maintaining its trend above critical support levels while forming higher lows — a promising sign of sustained upward momentum. Traders are watching for a decisive move above recent swing highs to confirm the bullish continuation. With solid volume backing up these moves, there’s a strong chance that BONK will reward patient holders with substantial returns. Keep an eye out for breakout candles and spikes in trading volume as potential signals for entry.
✅ Show your support by hitting the like button and
✅ Leaving a comment below! (What is You opinion about this Coin)
Your feedback and engagement keep me inspired to share more insightful market analysis with you!

BONKUSDT Forming Falling WedgeBONKUSDT is catching the attention of savvy crypto traders as it displays a classic falling wedge pattern, a well-known bullish reversal signal. This technical setup suggests that the prolonged downtrend could be nearing exhaustion, opening the door for a significant upside move. With good trading volume accompanying recent price action, buyers are showing signs of accumulation, laying the groundwork for a potential breakout that could deliver an impressive 90% to 100%+ gain in the coming sessions.
The falling wedge pattern is one of the most reliable chart formations for spotting trend reversals in the crypto market. As BONKUSDT continues to coil tighter within the wedge, the pressure is building for a breakout to the upside. Investors are becoming increasingly optimistic as they see strong support levels being defended, indicating that the bears are losing momentum. When price action breaks out of the wedge with convincing volume, a swift rally is likely to follow, rewarding those who positioned themselves early.
BONKUSDT’s growing popularity among retail and institutional traders further adds to its bullish outlook. The project is generating a buzz across crypto communities as investors recognize its potential for high percentage returns. Combined with solid fundamentals and renewed market sentiment, BONKUSDT has what it takes to deliver a powerful move once the falling wedge confirms its breakout. Smart money is watching this pair closely for a breakout candle that could ignite a trend reversal rally.
It’s crucial for traders to keep an eye on volume spikes and daily closes above key resistance to validate the wedge breakout. Clear risk management and well-defined stop-loss placements are essential to ride this setup with confidence. If the pattern plays out as expected, BONKUSDT could become one of the top performing coins in the near term, offering traders an excellent opportunity to capitalize on this bullish momentum.
✅ Show your support by hitting the like button and
✅ Leaving a comment below! (What is You opinion about this Coin)
Your feedback and engagement keep me inspired to share more insightful market analysis with you!

BONK looks ready to pivot—clear skies aheadLiking the price action so far. It’s flipped above the mid-level, which aligns with key pivots across multiple timeframes.
Ideally looking for a week of consolidation here before the next major move.
Entry around 0.0000158
Targeting 0.000028 if things unfold as expected
SEED_DONKEYDAN_MARKET_CAP:BONK BINANCE:BONKUSDT
#BONK/USDT#BONK
The price is moving within a descending channel on the 1-hour frame, adhering well to it, and is on its way to breaking it strongly upwards and retesting it.
We are seeing a bounce from the lower boundary of the descending channel. This support is at 0.00002070.
We have a downtrend on the RSI indicator that is about to break and retest, supporting the upward trend.
We are looking for stability above the 100 moving average.
Entry price: 0.00002205
First target: 0.00002287
Second target: 0.00002404
Third target: 0.00002551

#BONK/USDT#BONK
The price is moving within a descending channel on the 1-hour frame and is expected to break and continue upward.
We have a trend to stabilize above the 100 moving average once again.
We have a downtrend on the RSI indicator that supports the upward move with a breakout.
We have a support area at the lower boundary of the channel at 0.00001825, which acts as strong support from which the price can rebound.
Entry price: 0.00001883
First target: 0.00001967
Second target: 0.00002078
Third target: 0.00002222

BONK / TetherUS. 2 week TF Hey traders is Bonk ready to go Bonkers again? we have had a great retrace to the demand zone.

BONK vs DOGE! Both are gone!Gone means not completely, but loooks like they both retest thier lows completely once more, bearish stances again!

Bonk Support targetBonksi is falling down. The support is on the cross. There is a chance it will consolidate at the rising wedge on the weekly chart, Will buy some here.

#BONK/USDT Ready to go higher#BONK
The price is moving in a descending channel on a 1-day frame and sticking to it well
We have a bounce from the lower limit of the descending channel, this support is at 0.00002500
We have a downtrend on the RSI indicator that is about to be broken, which supports the rise
We have a trend to stabilize above the moving average 100
Entry price 0.00003350
First target 0.00003500
Second target 0.00004186
Third target 0.00004854

Bonk Elliot wave - Fib LevelsBonk targets for wave 3 and wave 5. Telling my audience with more decription - happy tv

Delik, reversal to uptrend! Hold on!Bonk (BONK):
Similarly, Bonk (BONK) is also showing signs of an impending breakout as it approaches the upper resistance of its falling wedge formation. Trading at $0.00003141, BONK has been consolidating for weeks but now appears to be building momentum.
The RSI for BONK is at 43.88, suggesting that there is room for upward movement if buyers step in. The MACD indicator also reflects a waning bearish trend, with the potential for a shift in momentum.

BONK DELIK CRYPTO PONGThe Bonk (BONK) token experienced a 7.2% decline in price following the recent token-burning event, which successfully removed 1.69 trillion BONK tokens—valued at over $51 million—from circulation.
The event, dubbed “BURNmas,” was initially scheduled for Dec. 25 but took place a day later on Dec. 26 at 5:40 p.m. UTC.
This substantial burn reportedly accounted for 1.85% of the total circulating supply, reducing it from 100 trillion to approximately 90.97 trillion BONK tokens. The Bonk team had proposed burning 1 trillion tokens through community engagement on social media, offering to burn 1,000 BONK for posts that used the hashtag #LetsBONK and 10,000 BONK for each new follower on platforms like Instagram and TikTok.

Bonk DetailedThe current price of BONK / TetherUS (BONK) is 0.00002987 USDT — it has fallen −2.32% in the past 24 hours. Try placing this info into the context by checking out what coins are also gaining and losing at the moment and seeing BONK price chart.

BONK possibly before UptrendThe current price of BONK / TetherUS (BONK) is 0.00002987 USDT — it has fallen −2.32% in the past 24 hours. Try placing this info into the context by checking out what coins are also gaining and losing at the moment and seeing BONK price chart.

#BONK/USDT Ready to go higher#BONK
The price is moving in a descending channel on the 1-hour frame and sticking to it well
We have a bounce from the lower limit of the descending channel, this support is at 0.00002974
We have a downtrend on the RSI indicator that is about to break, which supports the rise
We have a trend to stabilize above the moving average 100
Entry price 0.00003107
First target 0.00003278
Second target 0.00003437
Third target 0.00003618

$BONKUSDTThis is how I look at BONK in a Long run, a profitable run years ahead. A good long term investment, looking at ROI of more than 80% in a year. My money on $BONK.

BONK/USDT Chart Update.The BONK/USDT chart highlights a potential long trade setup based on technical analysis.
The price appears to be consolidating within a descending triangle pattern, with a breakout opportunity on the horizon.
Support Zone:
A crucial support zone appears between 0.00001697 and 0.00001999, suggesting a potential rebound zone for bullish momentum.
200-Day Moving Average:
The price is approaching the 200-day moving average, which could act as dynamic support.
Ichimoku Cloud:
The cloud suggests near-term bearishness, but a breakout above the resistance could signal a trend reversal.
Long Target Zone:
A green zone extending up to 0.00006239 indicates a high probability target for the next bullish leg.
Trade Setup:
Entry Point: Around the support zone at 0.00001999.
Stop-Loss: Below 0.00001697 to manage risk.
Take Profit Target:
Primary: 0.00004500.
Secondary: 0.00006239 for higher potential profits.
Risk/Reward:
The setup offers a favorable risk-to-reward ratio, making it an attractive option for long trades. However, before entering the trade, confirmation of a reversal (e.g., bullish candlestick pattern or volume spikes) is recommended.
DYOR, NFA
@Peter_CSAdmin

BONK: will the 1 trillion token burn fuel price growth?The Solana (SOL)-based memecoin BONK rallied 100% in the past seven days, driven by an overall market pump and a massive deflationary plan to burn 1 trillion tokens.
On 15th November, Bonk DAO announced the deflationary plans with the 2024 Christmas deadline.
Immediately after the news, BONK pumped 27% and added on its weekly gains, which crossed 100% amid an extra weekend pump. For context, burning tokens reduces supply and ultimately boosts the value of the remaining assets.
The extra pump on Sunday eyed the immediate bullish target of $0.000057 on the Fib tool. If the uptrend extended, the next target would be $0.000067, offering an extra 40% potential gains.
But BONK grabbing the extra gains could only be feasible if the mememcoin stayed above its previous ATH.
That said, technical indicators showed massive buying interest but an overheated market scenario. The Stochastic RSI was in oversold territory, while the OBV (On Balance Volume) reached new highs.
Interestingly, leveraged bulls also FOMO’ed on the BONK’s rally. The OI (open interest) rates surged 3X, from about $50M to over $150M in just days. This suggested that leveraged players took massive debts to place bullish bets on BONK.
Market pundits expect the BONK rally to extend, partly due to the expected 1T token burn. However, the broader market sentiment could determine the next price direction for the memecoin.

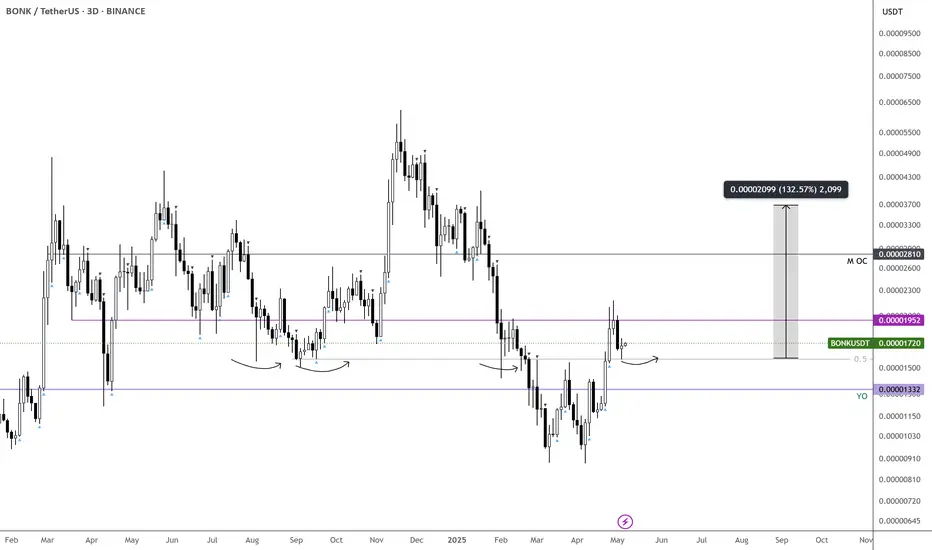
BONKUSDT 3DBONK ~ 3D
#BONK Buy gradually inside this pattern,. Minimum target 20%++.
it is only a matter of time until this pattern is broken and the Bulls dominate.

"Don’t Sleep on BONK: New Signals Pointing to a Trend Reversal!"Time to pay attention to BONK.
It has a 9-mode trend on the weekly and just fired a new signal on the daily. I was staying away from it since it was lacking momentum, but last week’s retest at 0.0000193 was enough to signal a trend continuation and that it was ready.
Easy 2x from here!
This one and CRYPTOCAP:DOGE seem poised to start making moves. Maybe higher-cap memes will trend soon.

#BONK/USDT#BONK
The price is moving in a descending channel on the 4-hour frame upwards and is expected to continue
We have a trend to stabilize above the moving average 100 again
We have an upward trend on the RSI indicator that supports the rise by breaking it upwards
We have a support area at the lower limit of the channel at a price of 0.00002000
Entry price 0.00002360
First target 0.00002614
Second target 0.00003149
Third target 0.00003507

BONKUSDTBONK ~ 3D
#BONK Make purchases gradually in this pattern. It is only a matter of time until this pattern breaks out and the bulls return quickly
