Why hello there ETH, can we be friends?barring any black swan events - now that we have the new ETH release forthcoming, the bitcoin halving in the future, and the bear market behind us (fingers crossed?), this is the trend - we'll see some stops and volatility at the major support/resistances for trading.
I'll just be holding for the next year or two. Less stress!
Bottom

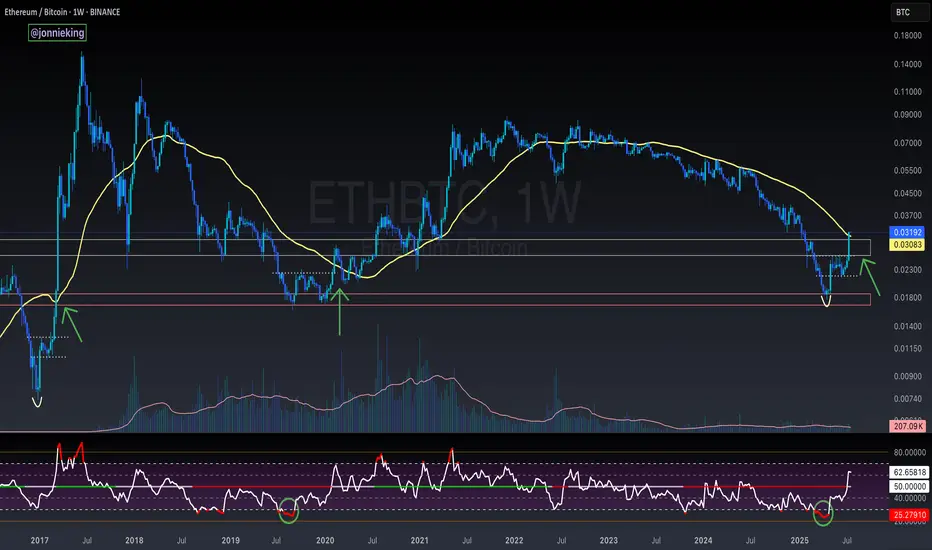
$ETH Closes Above the 50WMA - Alt Season Signal ALT SEASON ALERT 🚨
CRYPTOCAP:ETH Closed the Week ABOVE the 50WMA
Historically this has signaled the start of ALT SEASON.
*NOTE* 2020 had the pandemic hiccup.
This bottoming pattern looks very similar to the 2017 explosion.
Also the RSI matches the 2019 bottom.
Dare I call it yet bros? 🤓
Bandhan Bank - first major trend reversal! Upside to ₹215–230Thesis:
Bandhan Bank has broken out above the ₹185 zone after constructing a multi-month rounded base between ₹130 and ₹185. This marks the first major structural reversal after a multi-year downtrend. The breakout is backed by above-average volume and positive momentum.
Technical Structure:
Breakout Level: ₹180
Current Price: ₹189.64
Volume Surge: 11.4M (above 20-day average)
RSI (14): 67.5 — trending strong, near breakout zone
Targets:
₹215 ( 13.8% upside ) — measured move of near-term range
₹259 ( 25% upside ) — major horizontal resistance from 2022
Disclaimer:
Not a recommendation. For educational use only. Position already held from earlier. This post reflects personal strategy execution in a structured portfolio.

$SOL Local Bottom FormingCRYPTOCAP:SOL closed the day back within the POI.
RSI oversold.
Should see a retest ~$136 to confirm the local bottom.

ETH/BTC Looking Juicy ...Well... not a bad time to scoop some ETH at these low levels for some long term hold...
As always, DYOR!
Peace,
Subawu

Bitcoin Bottom- i saw many traders using vrvp or vpvr like and claiming BTC will go 10k.
- They just don't know how to use this tool and didn't understand how it works.
- if u don't know how to use a tool, simply don't use it. so less people's will rekt. this is an advanced trading tool.
- The Timeline of those tools are VERY IMPORTANT, they cannot be set up from 2015 or 2013.
What happened when BTC was Bearish :
- Actually when BTC dipped from 30,000$ ish, the columns started in the vrpv darker zone ( Less Demand )
- BTC reached 20,000$ and columns started to grow ( Demand Zone but Fear "Retailers" )
- Then dipped 17,500$ and the columns diminished size ( Good Demand " Smart Money" )
- This is at this point that you can detect a BOTTOM Zone. ( Darker zones + Small Columns )
Then what happened when BTC was Bullish :
- if you watch VRVP when BTC was growing you will notice the inverse.
- The Main demand was around 30,000$.
- BTC Reached 50,000$ and VRVP started to be darker ( More Demand impulse "FOMO" ).
- Then BTC reached 70,000$ ( No Demand ). ( Darker zones + Small Columns )
- i will post an exemple under this post to show a bad use of VRVP/VPVR. please don't use it that way.
Happy Tr4Ding !

$NKE potential bottom around $58-63- For NYSE:NKE longs, they gotta feel 10-15% more downside for potential bottom. $63 is the 200 SMA on monthly scale where it could potentially bottom.
- Ideally, NYSE:NKE has been losing market share to NYSE:ONON , deckers etc. On top of that there's zero innovation in the shoes and design. Premium price for Nike seems unjustified.
- Fair value based on multiple compression seems to be around $78-85. Therefore, buying it in 70s isn't worth holding. I believe parking money here is like betting on dead horse as of now.
- Turn around in brick and mortar business takes long time and patience as compared to SAAS business where one could see positive turn around within 1-2 quarters.
- CEO is a veteran which is a plus but investors should be cautiously optimistic.
- Buying around $58-63 provides good upside adjusted for slow rate of pace of growth and competition fears.

#PARTIUSDT is showing signs of a reversal🚀 The price BYBIT:PARTIUSDT.P is showing signs of a reversal after a prolonged downtrend.
🚀 The scenario becomes more likely if the price holds above $0.1520 with increasing volume.
🚀 Watch for a breakout and confirmation above the $0.1500–$0.1520 zone — this would strengthen the bullish setup.
🚀 If volume picks up during the continuation of the move, a quick push toward $0.18 is possible.
📈 LONG BYBIT:PARTIUSDT.P from $0.1533
🛡 Stop loss: $0.1492
🕒 Timeframe: 1H
✅ Overview:
➡️ The price has broken out above the Bearish Flag, confirming a break in the downtrend structure.
➡️ The Double Bottom formation increases the likelihood of an upward move.
➡️ Entry at $0.1533 is just above the resistance zone and confirms the breakout.
➡️ The upward potential remains toward $0.1600 and beyond, aiming for the POC volume area.
🎯 TP Targets:
💎 TP 1: $0.1555
💎 TP 2: $0.1575
💎 TP 3: $0.1600
📢 Support zone: $0.1500–$0.1510 — must hold to maintain the bullish structure.
📢 If price consolidates above $0.1555, expect a potential acceleration toward $0.1600.
📢 A drop below $0.1492 invalidates the scenario — stop is mandatory.
🚀 BYBIT:PARTIUSDT.P breaks key level — bullish signal confirmed! Watch for continuation!

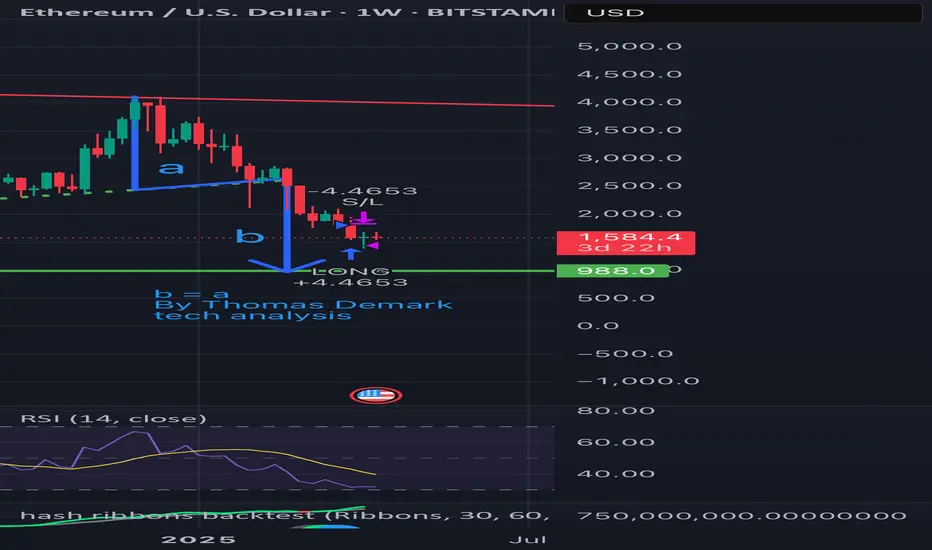
ETH is falling per Demark’s technical analysis: Target at $988?According to Thomas Demark’s method — when b = a, the next target for ETH is around $988.
📉 Price broke the ascending support
🔻 Wave “a” from $4000 to $2500 has already played out
📏 Wave “b” is projected downward — target aligns with a strong historical support zone
📊 Weekly RSI is nearing oversold territory
Conclusion: The $988 area is critical. A reversal may occur there if selling pressure weakens.
Stay sharp.
#ETH #Demark #CryptoAnalysis #TechnicalAnalysis #Ethereum
"When the VIX is low, look out below!""When the VIX is low, look out below!"
+
FEDs motto "Higher for longer"
=
Fed rate hikes to go: 2-3 left
it is pivot time, change of market dynamic from "bad news is good news" to "bad news is bad news".
state of economy is not good and it will start sinking in to investors and public

Updated XRP Count Bearish (Short Term)Hello Friends,
I've been trying to tackle this count for a couple of days now and finally came up with something that fits the picture and seems to work. I’m not in love with this count—it’s very tricky when it comes to the X wave. I’ve been reviewing and processing what the highest probability count could be for this part of the structure.
As we understand it, Wave 1 of the 5th wave (or Wave A of the Y wave) was completed around January 20th at approximately $3.40. From that point until now, we are likely in Wave 2 of the 5th wave (or Wave B of the Y wave), which appears to be nearly complete.
Wave 2 (or Wave B) is forming as a sharp double zigzag:
A zigzag in Wave W
A truncated, ugly-looking sharp double in the X wave (which I’m not a fan of, though I believe it’s valid and it fits)
And a zigzag in Wave Y, which we are currently still in
Probabilistically, we are in Wave B of the Y wave and should retrace to around $2.10–$2.40. As more subdivisions develop in the B wave, they’ll help confirm more precise target ranges in the coming days.
I expect we’ll finish in the $1.60–$1.36 range (leaning more toward the lower end around $1.43–$1.36) to complete this correction before continuing toward the $10 target area.
Thoughts?
Thank you,
GOD BLESS and TRADE ON!

SHORT TERM BOTTOM/BUYZONE w/SELL ZONE.Charting a short-term bottom (3mos. - 6mos.) We may quest to 5000. However, I believe this to be the end of a two part measured move to the downside.

Bottom Still Not in, Drop could hit low 70kBTC is falling due to markets and investor fear. The Bottom still hasn't travelled the length of the the FVG on the Weekly Chart that will be attractive to smart money and institutional investors
When looking at the Historical Data it shows that the price had a pullback and found resistance at the Weekly 21 day RMA .
Currently that looks like a point where Resistance once again will be established when combined with the FVG on the Weekly, Price will likely fall below and recover to hold the 21d RMA

$SOL RSI Fully Reset! Could Very Well Have Seen the BottomI’ve been waiting a few days before posting an update on CRYPTOCAP:SOL to see if it forms a cluster that mimics the fractal before the Trump Pump.
So far it has been playing out perfectly.
I still think we might have a wick at the very least to retest $155, but it does not necessarily have to happen as we’ve already have some confirmed price action in that region.
Main target is reclaiming the DMA9 and then prior Trend.
The RSI has FULLY RESET, so we could very well have seen the bottom here.

DOGE might finished drop—short-term targets: $2.22 - $4.44BINANCE:DOGEUSDT ’s price action over the past two years has formed a large rounded bottom and a complex inverse head and shoulders.
Looking at the two major recent drops as the right shoulders and comparing them to two similar drops in 2021 as the left shoulders, the decline percentages are almost identical:
🔵 Recent right shoulder drop: -53.52%
🔵 Left shoulder drop in 2021: -54.25%
🟣 Previous right shoulder drop: -45.87%
🟣 Previous left shoulder drop in 2021: -42.94%
This suggests that the decline is likely complete.
So, assuming this bull market continues, where could CRYPTOCAP:DOGE go next?
Using this pattern, I estimated two potential target prices:
🔴 Conservative target: $2.22 (~7x from current price)
🔵 More aggressive target: $4.44 (~15x from current price)
Historically, DOGE’s pumps have been fast and explosive, often reaching targets within weeks.
Some people think the crypto market has already turned bearish. If you’re bearish, a safer short entry might be after DOGE breaks below 2/3 of its recent support.
There are no guarantees in trading, so always set a stop loss for risk management.
Stay safe! 🚀
🔴 Read my signature & publications for more info you don’t want to miss.
🔥 for more future script "guesses" like this!

Is Altcoin Season STILL About to Begin in 2025?Looking at CRYPTOCAP:BTC.D , before the 2021 altseason kicked off, there were 3 key stages:
▍Stage 1: A steep rounded top formed.
▍Stage 2: Along the neckline of the rounded top, a rounded bottom developed.
▍Stage 3: BTC.D dropped sharply, triggering a crazy altseason.
For 2025, it seems we're about to enter Stage 3:
▍Stage 1: Again, a steep rounded top formed.
▍Stage 2: Just like before, a rounded bottom appeared along the neckline.
What’s different this time?
BTC.D just retested the neckline resistance zone for the second time yesterday.
After touching it, BTC.D formed a long lower wick, signaling strong rejection.
Now, it's all about watching the next moves.
If BTC.D mirrors Stage 3 from the last cycle, we could see a sharp drop soon.
And if that happens, the crazy altseason might start before anyone is ready.
🔴 for more future script "guesses" like this!
🔥 I've dropped another 2 analyses for the 2025 altseason on the right hand side if you're using computer, and scroll down a bit to see the link if you're using mobile.

Celer - Ultimate Altcoin Top & Bottom IndicatorSince the last Altseason (2021), Celer has consistently signaled tops and bottoms for altcoins. The red zone has marked altcoin peaks, while the green zone has indicated market bottoms.

31% higher since we called bottom on $TMDX31% higher since we called bottom on NASDAQ:TMDX
Where are my bulls at?!
We are just getting started on this name with massive upside potential!
$100 inbound!! 🎯
Not financial advice

Updated XRP Count Marco Wave 4 Completed What a tricky count! If it smells like a triangle, looks like a triangle then its probably triangle, right? Well in some case that is true in others it's not. Considering the price action we got yesterday with the liquidation event, we are forced to look at our alternative counts. This is a revised count of the competed Macro Wave 4 XRP.
Feel free to ask questions
God Bless and Trade on!

TOTAL2 / BTC ALTS Should be Close to BottomingWho remembers this chart I posted a month ago on TOTAL2 / BTC ?
This was the one that TradingView shared of mine on 12/31/24
Called the double bottom here. My squiggles are undefeated.
Alts should be close to the end of bleeding.
One last flush I presume (hope) 😂

TLT HAS BOTTOMED TODAY at 85.34 a perfect .786 of wave A downThe chart posted is the TLT we have now reached a fib relationship at today low of .786 of wave or wave 1 both counts calls for a sharp rally back above 90 plus or mins 1 I have now moved to a 40 % net long in the money calls best of trades wavetimer

Market bottom called perfectly at $581 $SPY $QQQ $DIA Market bottom called perfectly at $581 🎯 AMEX:SPY NASDAQ:QQQ AMEX:DIA
This was one and only mention too 🎯

$AMD DOUBLE BOTTOM EASY $175 BY NEXT EARNINGA double bottom pattern is a traditional technical analysis chart formation that signifies a significant trend reversal and a shift in momentum from a previous downward movement in market trading. It depicts a security or index experiencing an initial decline, followed by a rebound, then another decline to a level similar to the initial drop, and finally a subsequent rebound that may lead to a new uptrend.
- PlayStation 6 Processor Contract : NASDAQ:AMD has secured the contract to supply processors for the upcoming PlayStation 6, surpassing Intel. This agreement ensures the sale of millions of custom chips and generates billions in revenue, solidifying AMD's position in the gaming console market.
- Strong Financial Performance: NASDAQ:AMD reported remarkable revenue growth, with a 17.57% increase in the third quarter of 2024. This performance underscores AMD's robust market position and profitability.
-AI and Semiconductor Supercycle: The semiconductor industry, including NASDAQ:AMD , is poised to benefit from the rising demand for AI-related products and services. This trend is expected to drive further growth and profitability for AMD.
Positive Analyst Ratings: Numerous analysts have given NASDAQ:AMD a "Strong Buy" rating, with price targets ranging from $155 to $250. This optimistic outlook suggests significant potential gains in AMD's stock value.
AS OF 12/16/2024
RSI (14) 33.31
52W Low 3.99%
